| Param | Original file | Final file |
|---|---|---|
| Filename | modeM0/AS1A12_101T01_9000005612_41179cztM0_level2.fits | modeM0/AS1A12_101T01_9000005612_41179cztM0_level2_quad_clean.evt |
| Size (bytes) | 606,211,200 | 123,111,360 |
| Size | 578.1 MB | 117.4 MB |
| Events in quadrant A | 4,185,027 | 856,106 |
| Events in quadrant B | 3,739,377 | 877,151 |
| Events in quadrant C | 10,429,257 | 650,622 |
| Events in quadrant D | 3,459,965 | 783,409 |
| Mode M9 | |||
|---|---|---|---|
| Quadrant | BADHDUFLAG | Total packets | Discarded packets |
| A | 0 | 30 | 0 |
| B | 0 | 30 | 0 |
| C | 0 | 30 | 0 |
| D | 0 | 30 | 0 |
| Mode M0 | |||
|---|---|---|---|
| Quadrant | BADHDUFLAG | Total packets | Discarded packets |
| A | 0 | 17418 | 3 |
| B | 0 | 17086 | 2 |
| C | 0 | 36566 | 2 |
| D | 0 | 16662 | 2 |
| Mode SS | |||
|---|---|---|---|
| Quadrant | BADHDUFLAG | Total packets | Discarded packets |
| A | 0 | 164 | 0 |
| B | 0 | 164 | 0 |
| C | 0 | 164 | 0 |
| D | 0 | 164 | 0 |
| Quadrant | Total seconds | Saturated seconds | Saturation percentage |
|---|---|---|---|
| A | 8065 | 18 | 0.223187% |
| B | 8065 | 54 | 0.669560% |
| C | 8065 | 2113 | 26.199628% |
| D | 8065 | 17 | 0.210787% |
Noise dominated data is calculated using 1-second bins in cleaned event files. If a bin has >2000 counts, and if more than 50% of those come from <1% of pixels, then it is considered to be noise-dominated and hence unusable.
| Quadrant | # 1 sec bins | Bins with >0 counts | Bins with >2000 counts | High rate bins dominated by noise | Noise dominated (total time) | Noise dominated (detector-on time) | Marked lightcurve |
|---|---|---|---|---|---|---|---|
| A | 10991 | 8067 | 2 | 2 | 0.02% | 0.02% | 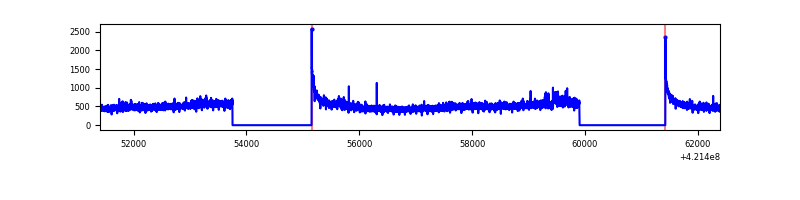 |
| B | 10991 | 8067 | 32 | 32 | 0.29% | 0.40% | 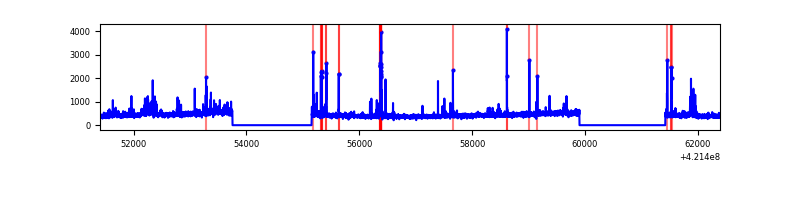 |
| C | 10990 | 8066 | 1826 | 1826 | 16.62% | 22.64% | 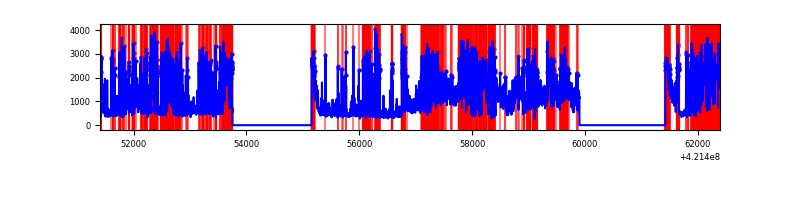 |
| D | 10991 | 8067 | 15 | 15 | 0.14% | 0.19% | 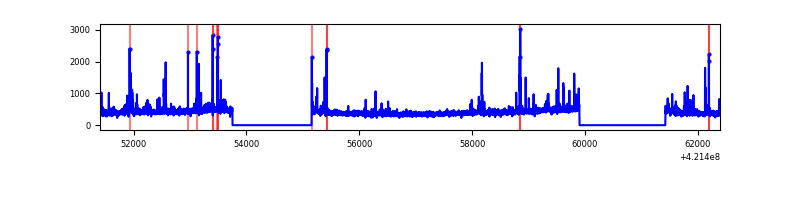 |
Top three noisy pixels from each quadrant. If the there are fewer than three noisy pixels in the level2.evt file, extra rows are filled as -1
| Pixel properties | Quadrant properties | ||||||
|---|---|---|---|---|---|---|---|
| Quadrant | DetID | PixID | Counts | Sigma | Mean | Median | Sigma |
| A | 10 | 83 | 660114 | 3771.04 | 856 | 837 | 174.8 |
| A | 12 | 189 | 192081 | 1093.91 | 856 | 837 | 174.8 |
| A | 13 | 6 | 12370 | 65.97 | 856 | 837 | 174.8 |
| B | 0 | 229 | 217451 | 1309.25 | 847 | 821 | 165.5 |
| B | 5 | 255 | 148175 | 890.57 | 847 | 821 | 165.5 |
| B | 0 | 245 | 23217 | 135.36 | 847 | 821 | 165.5 |
| C | 9 | 54 | 6880814 | 39714.01 | 741 | 745 | 173.2 |
| C | 15 | 214 | 309354 | 1781.39 | 741 | 745 | 173.2 |
| C | 0 | 10 | 266262 | 1532.65 | 741 | 745 | 173.2 |
| D | 2 | 249 | 147835 | 723.55 | 833 | 809 | 203.2 |
| D | 13 | 249 | 99376 | 485.07 | 833 | 809 | 203.2 |
| D | 2 | 234 | 43142 | 208.33 | 833 | 809 | 203.2 |
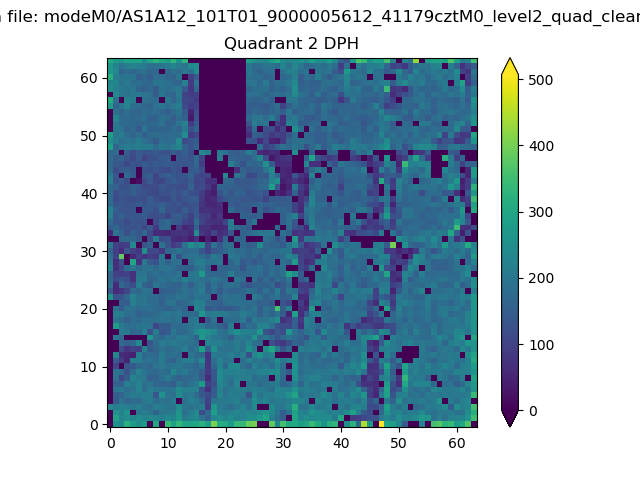
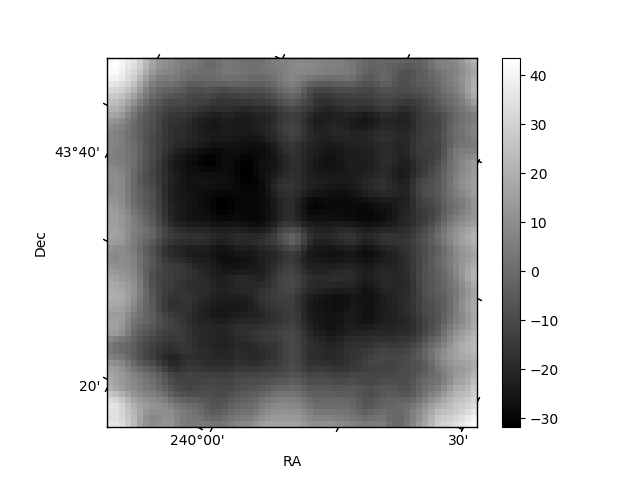
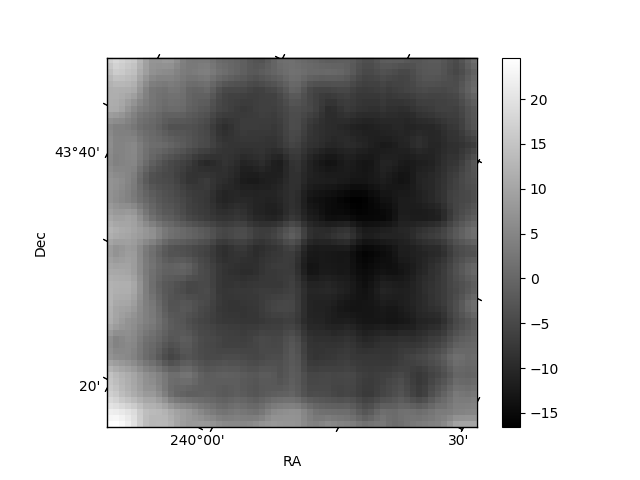
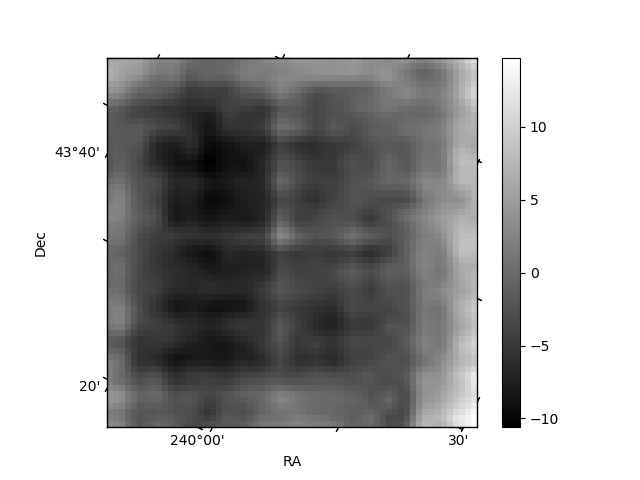
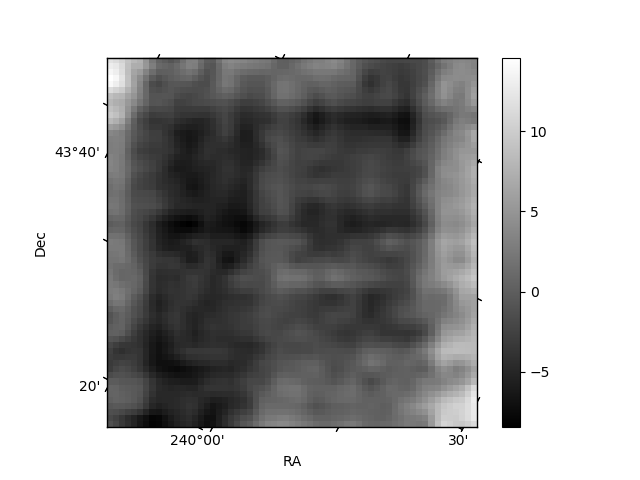
Histogram calculated using DETX and DETY for each event in the final _common_clean file
| Quadrant A | 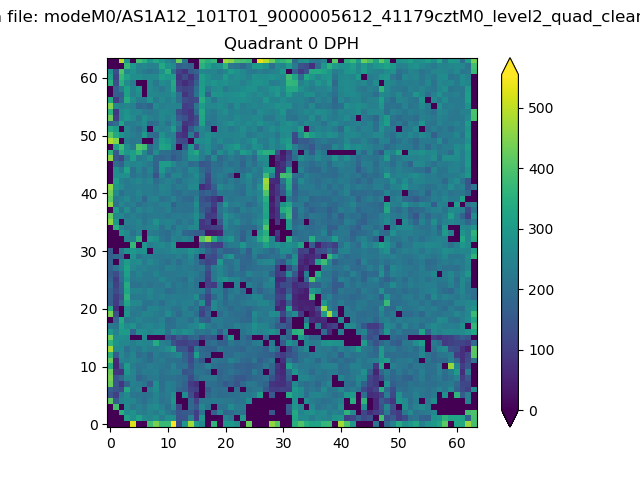 |
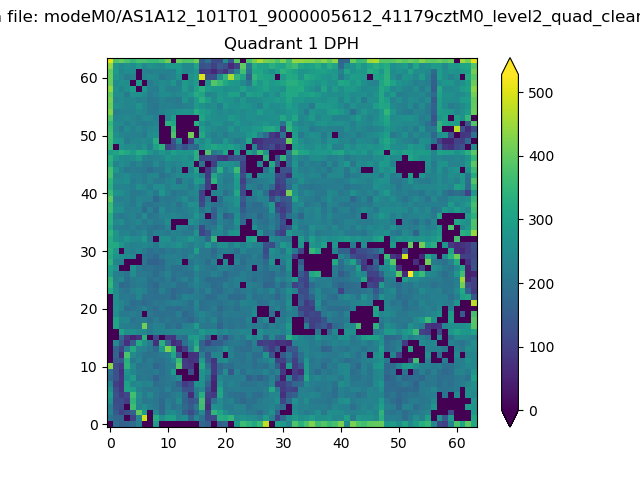 |
Quadrant B |
|---|---|---|---|
| Quadrant D | 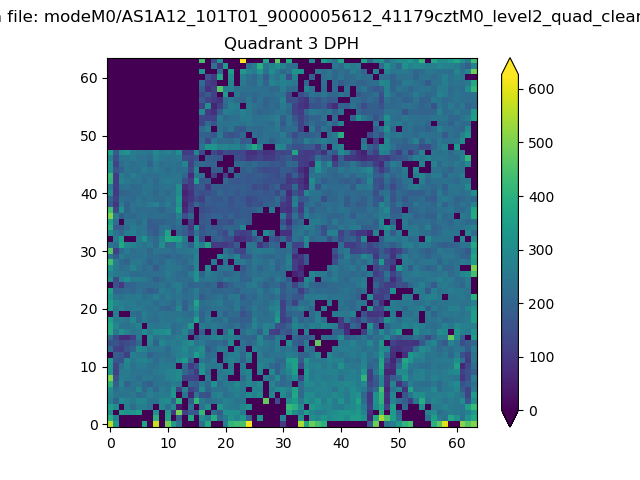 |
 |
Quadrant C |
| Plot type | Count rate plots | Images |
|---|---|---|
| Comparison with Poisson distribution Blue bars denote a histogram of data divided into 1 sec bins. Red curve is a Poisson curve with rate = median count rate of data. |
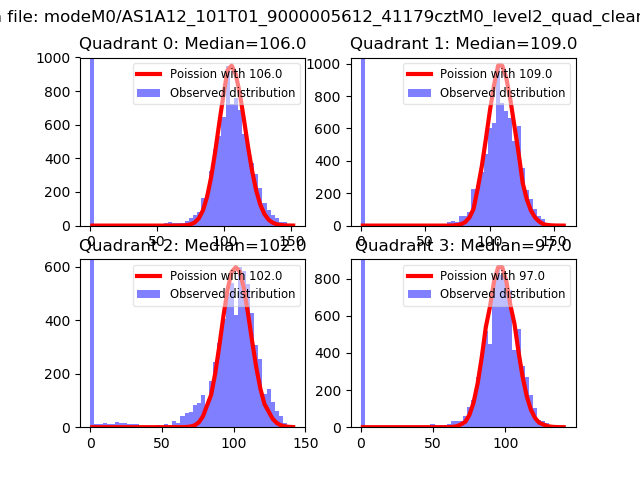 |
 |
| Quadrant-wise count rates Data is divided into 100 sec bins |
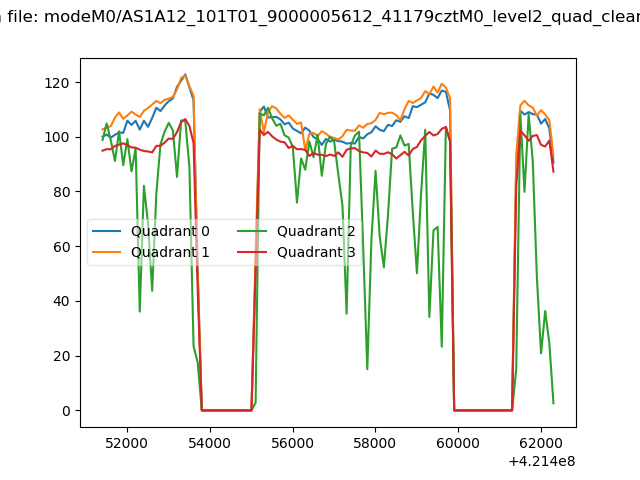 |
|
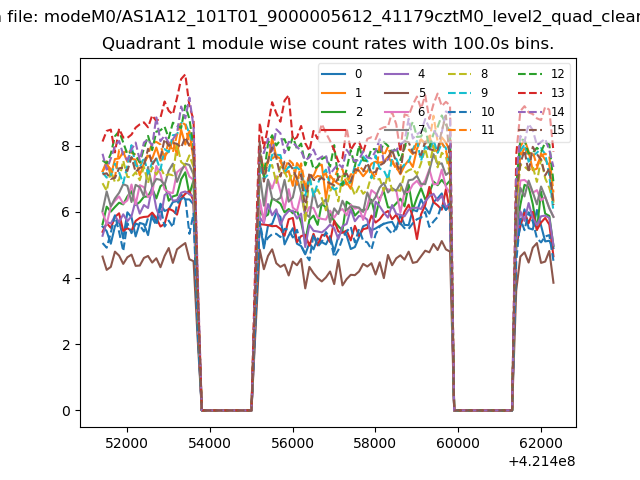
| Module-wise count rates for Quadrant A Data is divided into 100 sec bins |
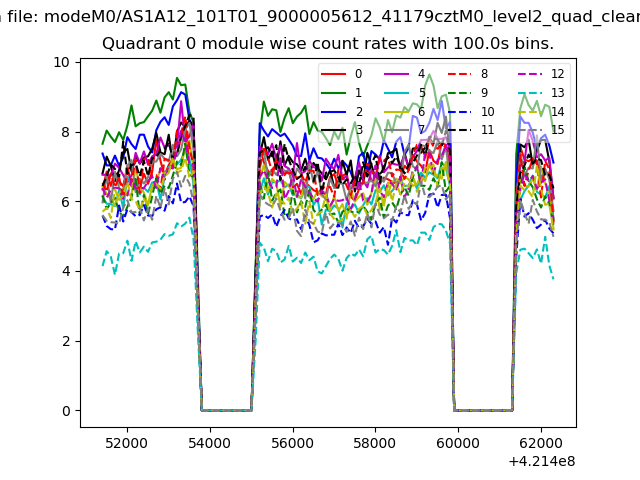 |
 |
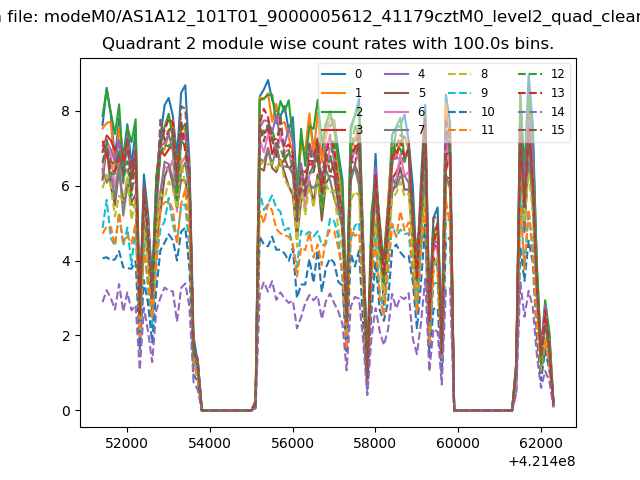
| Module-wise count rates for Quadrant B Data is divided into 100 sec bins |
 |
 |
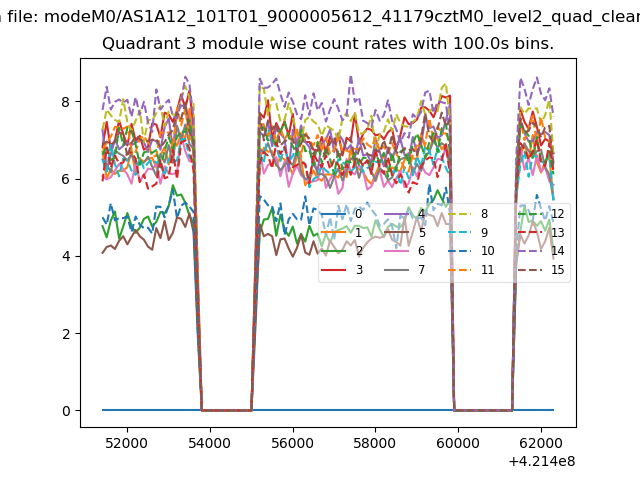
| Module-wise count rates for Quadrant C Data is divided into 100 sec bins |
 |
 |
| Module-wise count rates for Quadrant D Data is divided into 100 sec bins |
 |
 |
| Parameter | Plot |
|---|---|
| CZT HV Monitor | 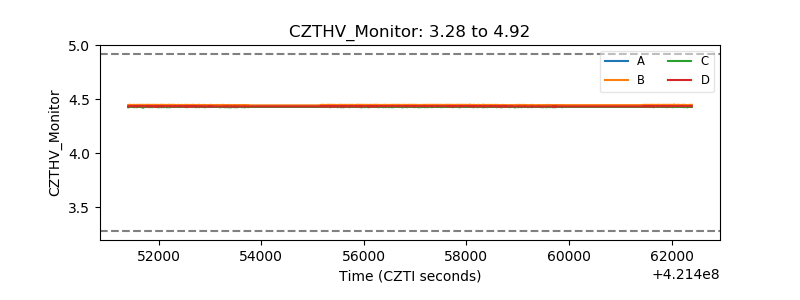 |
| D_VDD | 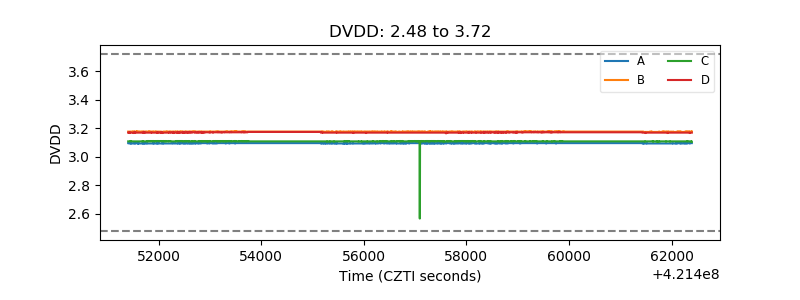 |
| Temperature 1 | 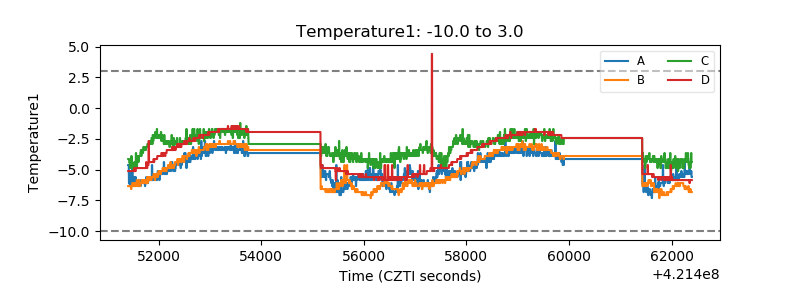 |
| Veto HV Monitor | 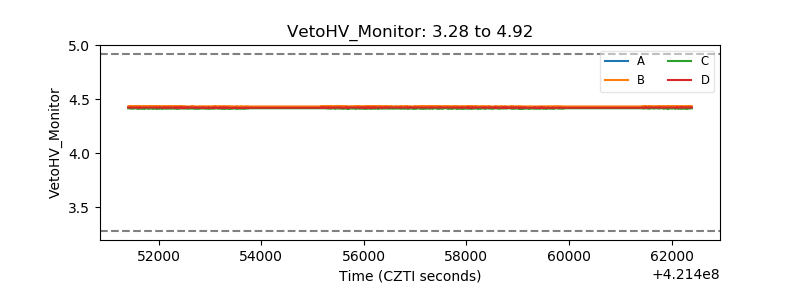 |
| Veto LLD |  |
| Alpha Counter | 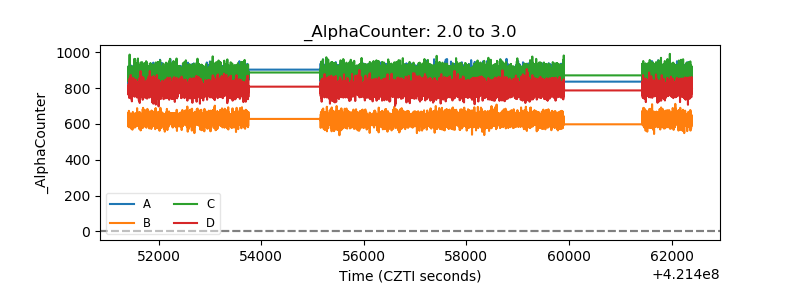 |
| _CPM_Rate | 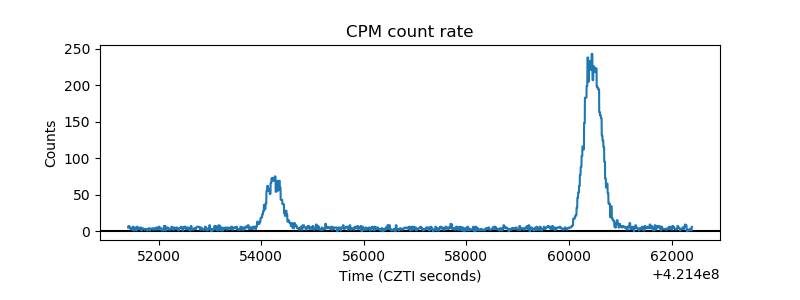 |
| CZT Counter | 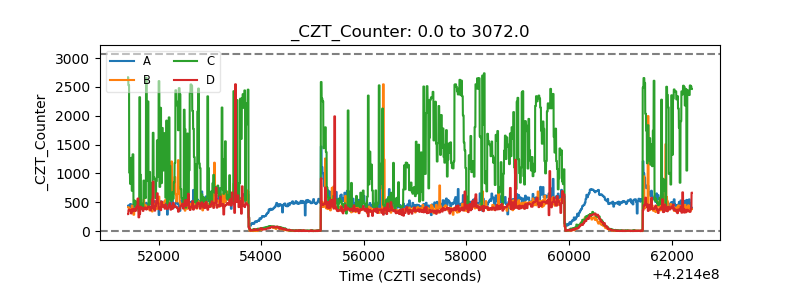 |
| +2.5 Volts monitor | 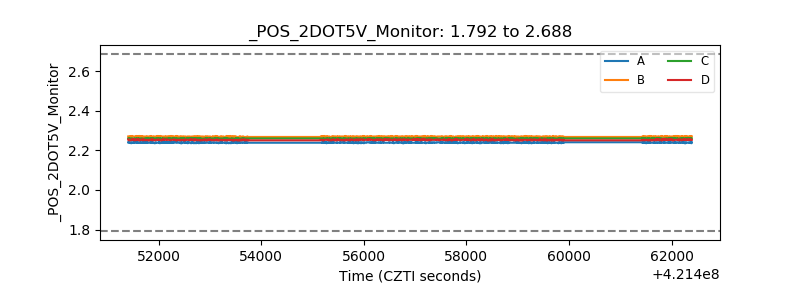 |
| +5 Volts monitor | 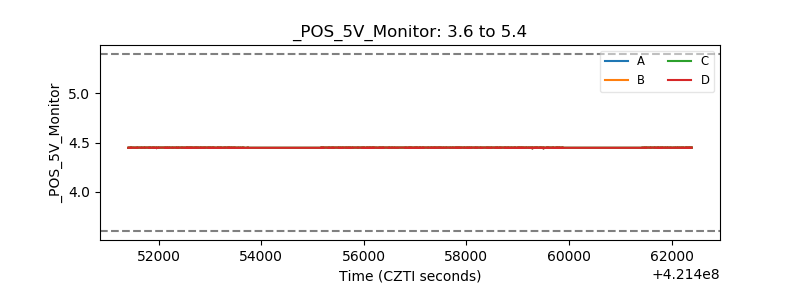 |
| _ROLL_ROT | 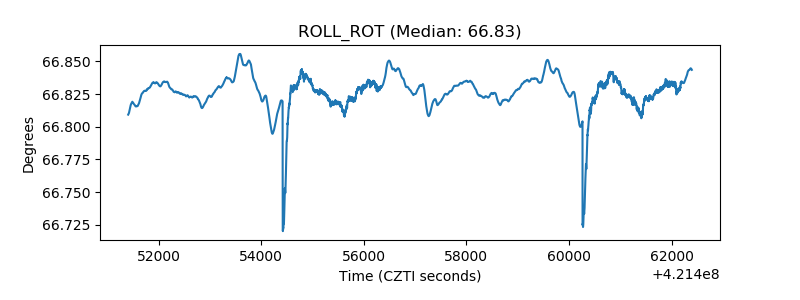 |
| _Roll_DEC | 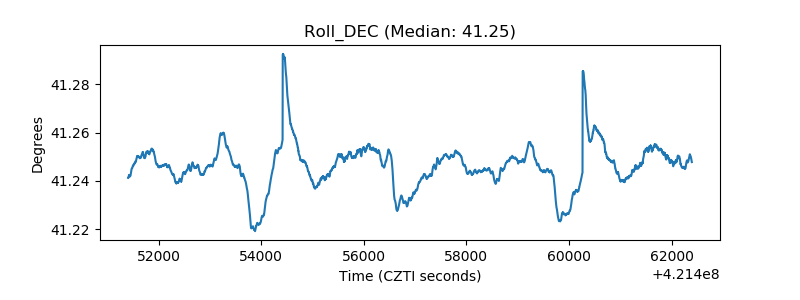 |
| _Roll_RA | 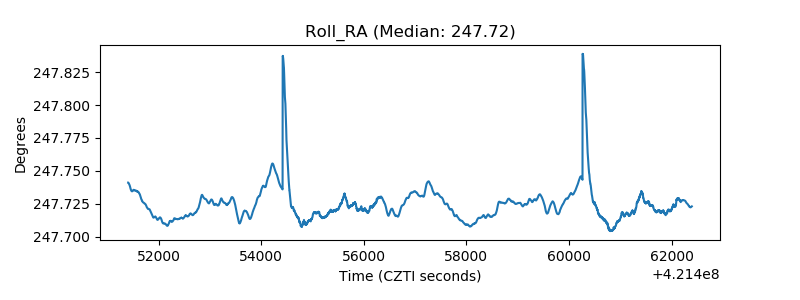 |
| Veto Counter | 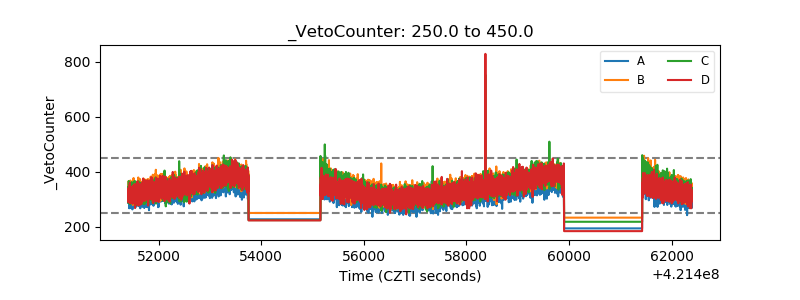 |