| Param | Original file | Final file |
|---|---|---|
| Filename | modeM0/AS1A12_101T01_9000005612_41180cztM0_level2.fits | modeM0/AS1A12_101T01_9000005612_41180cztM0_level2_quad_clean.evt |
| Size (bytes) | 506,741,760 | 77,564,160 |
| Size | 483.3 MB | 74.0 MB |
| Events in quadrant A | 2,884,484 | 585,525 |
| Events in quadrant B | 2,480,102 | 598,323 |
| Events in quadrant C | 10,014,624 | 268,711 |
| Events in quadrant D | 2,951,217 | 511,875 |
| Mode M9 | |||
|---|---|---|---|
| Quadrant | BADHDUFLAG | Total packets | Discarded packets |
| A | 0 | 22 | 0 |
| B | 0 | 22 | 0 |
| C | 0 | 22 | 0 |
| D | 0 | 23 | 0 |
| Mode M0 | |||
|---|---|---|---|
| Quadrant | BADHDUFLAG | Total packets | Discarded packets |
| A | 0 | 11913 | 3 |
| B | 0 | 11526 | 2 |
| C | 0 | 33444 | 2 |
| D | 0 | 13111 | 2 |
| Mode SS | |||
|---|---|---|---|
| Quadrant | BADHDUFLAG | Total packets | Discarded packets |
| A | 0 | 112 | 0 |
| B | 0 | 112 | 0 |
| C | 0 | 112 | 0 |
| D | 0 | 112 | 0 |
| Quadrant | Total seconds | Saturated seconds | Saturation percentage |
|---|---|---|---|
| A | 5487 | 11 | 0.200474% |
| B | 5487 | 20 | 0.364498% |
| C | 5487 | 3072 | 55.986878% |
| D | 5487 | 244 | 4.446874% |
Noise dominated data is calculated using 1-second bins in cleaned event files. If a bin has >2000 counts, and if more than 50% of those come from <1% of pixels, then it is considered to be noise-dominated and hence unusable.
| Quadrant | # 1 sec bins | Bins with >0 counts | Bins with >2000 counts | High rate bins dominated by noise | Noise dominated (total time) | Noise dominated (detector-on time) | Marked lightcurve |
|---|---|---|---|---|---|---|---|
| A | 7160 | 5488 | 4 | 4 | 0.06% | 0.07% | 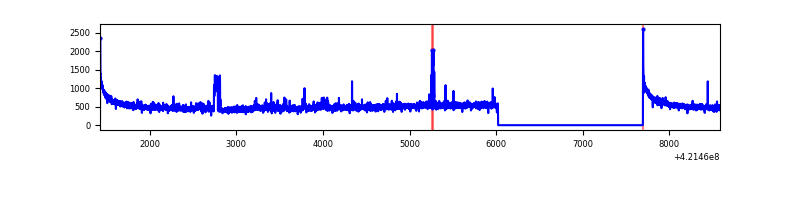 |
| B | 7160 | 5488 | 11 | 11 | 0.15% | 0.20% | 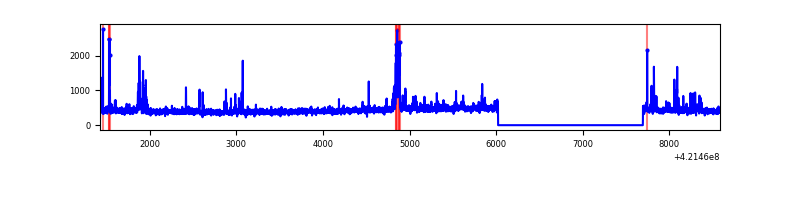 |
| C | 7160 | 5488 | 2899 | 2899 | 40.49% | 52.82% | 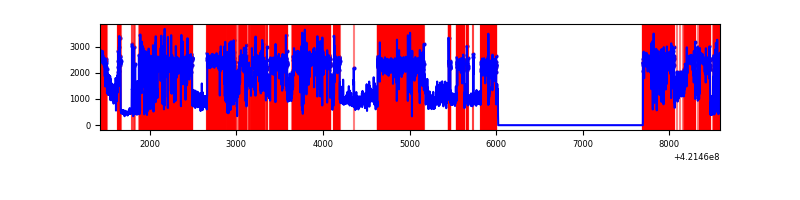 |
| D | 7160 | 5488 | 227 | 227 | 3.17% | 4.14% | 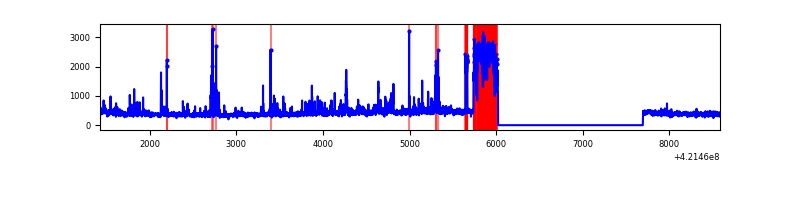 |
Top three noisy pixels from each quadrant. If the there are fewer than three noisy pixels in the level2.evt file, extra rows are filled as -1
| Pixel properties | Quadrant properties | ||||||
|---|---|---|---|---|---|---|---|
| Quadrant | DetID | PixID | Counts | Sigma | Mean | Median | Sigma |
| A | 10 | 83 | 516208 | 4352.36 | 573 | 561 | 118.5 |
| A | 12 | 189 | 99204 | 832.6 | 573 | 561 | 118.5 |
| A | 2 | 79 | 36620 | 304.36 | 573 | 561 | 118.5 |
| B | 0 | 229 | 131180 | 1187.9 | 568 | 554 | 110.0 |
| B | 0 | 190 | 48461 | 435.66 | 568 | 554 | 110.0 |
| B | 5 | 255 | 48235 | 433.6 | 568 | 554 | 110.0 |
| C | 9 | 54 | 8115837 | 87930.22 | 394 | 396 | 92.3 |
| C | 0 | 10 | 184508 | 1994.84 | 394 | 396 | 92.3 |
| C | 15 | 214 | 173270 | 1873.08 | 394 | 396 | 92.3 |
| D | 13 | 249 | 636379 | 4736.65 | 544 | 527 | 134.2 |
| D | 2 | 249 | 114556 | 849.44 | 544 | 527 | 134.2 |
| D | 2 | 120 | 113948 | 844.91 | 544 | 527 | 134.2 |
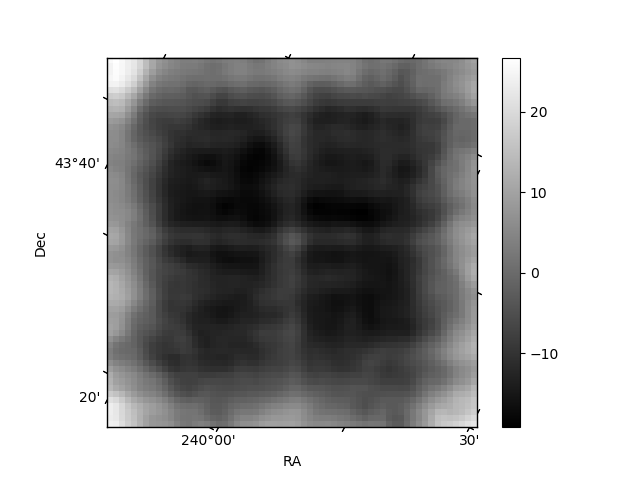
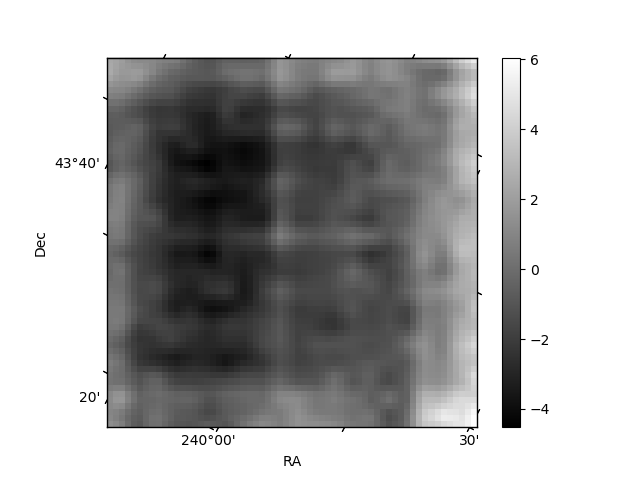
Histogram calculated using DETX and DETY for each event in the final _common_clean file
| Quadrant A | 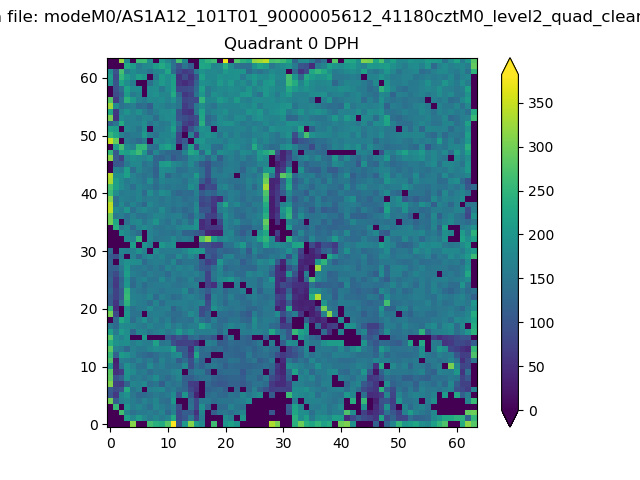 |
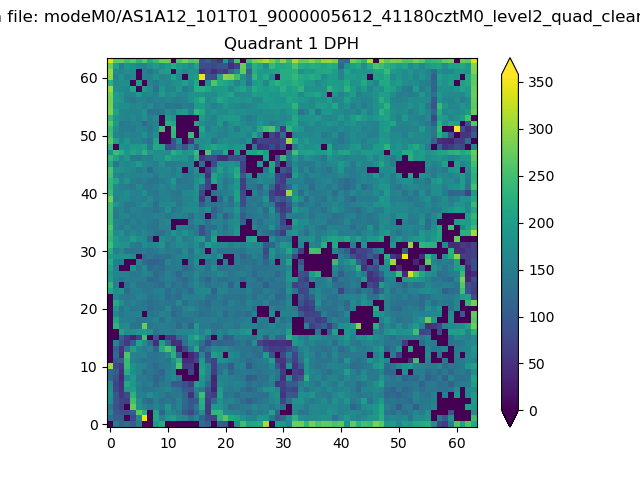 |
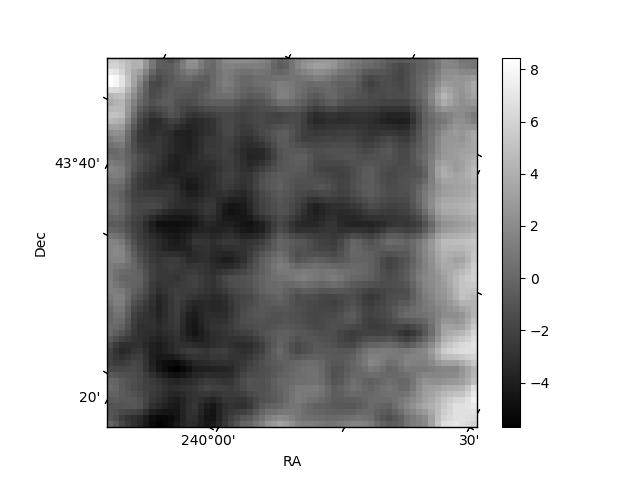
Quadrant B |
|---|---|---|---|
| Quadrant D | 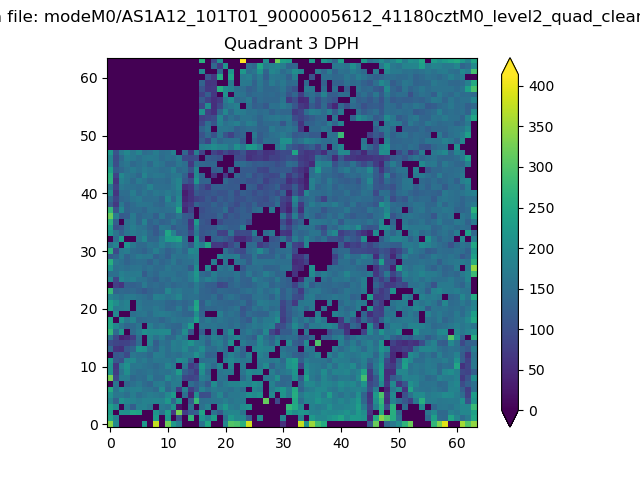 |
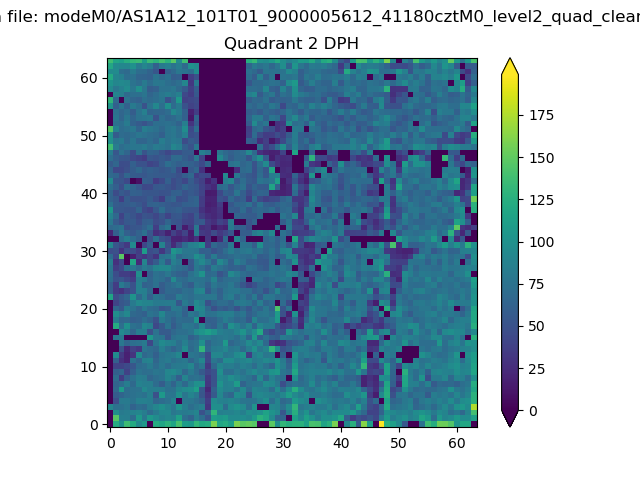 |
Quadrant C |
| Plot type | Count rate plots | Images |
|---|---|---|
| Comparison with Poisson distribution Blue bars denote a histogram of data divided into 1 sec bins. Red curve is a Poisson curve with rate = median count rate of data. |
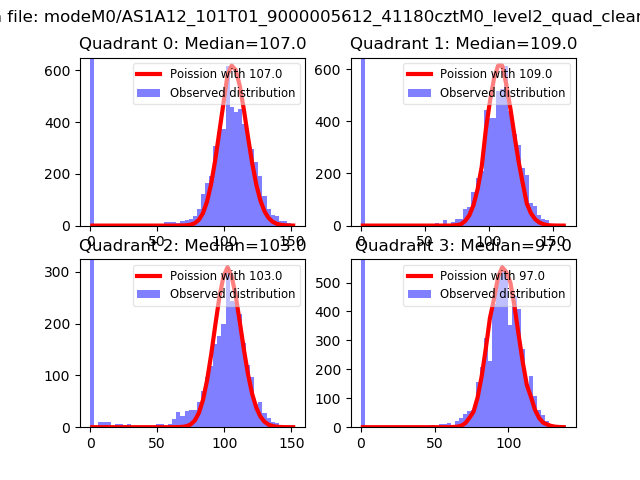 |
 |
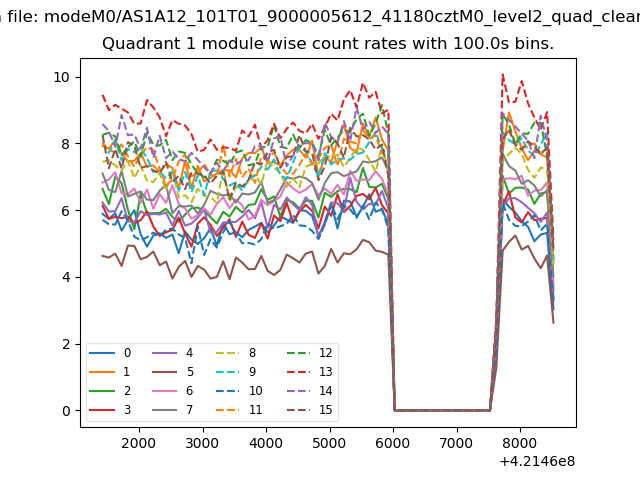
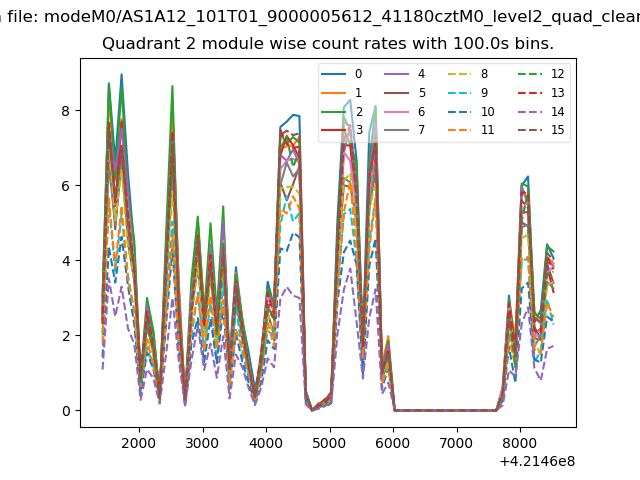
| Quadrant-wise count rates Data is divided into 100 sec bins |
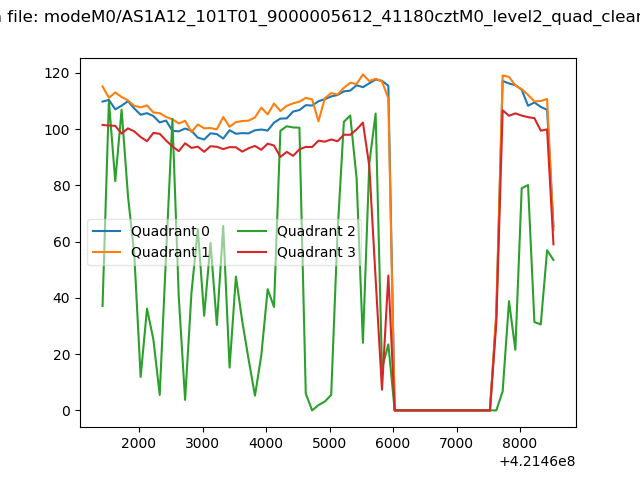 |
|
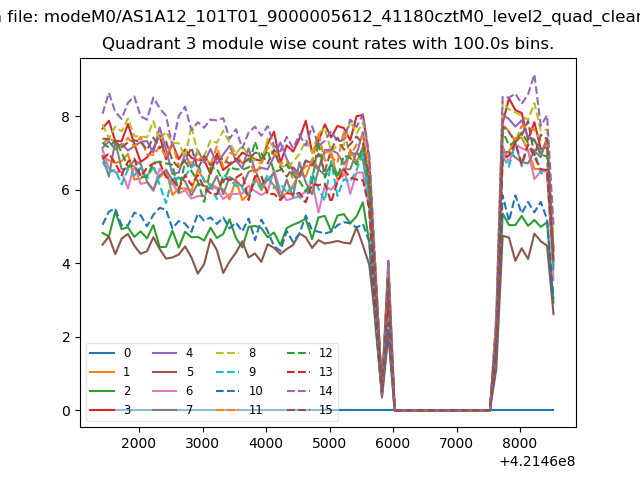
| Module-wise count rates for Quadrant A Data is divided into 100 sec bins |
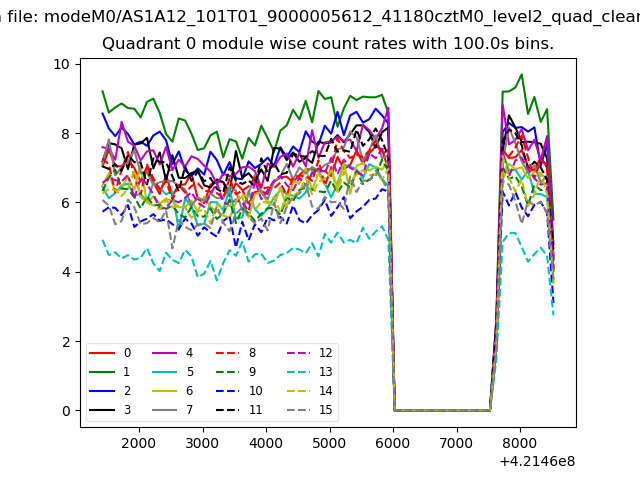 |
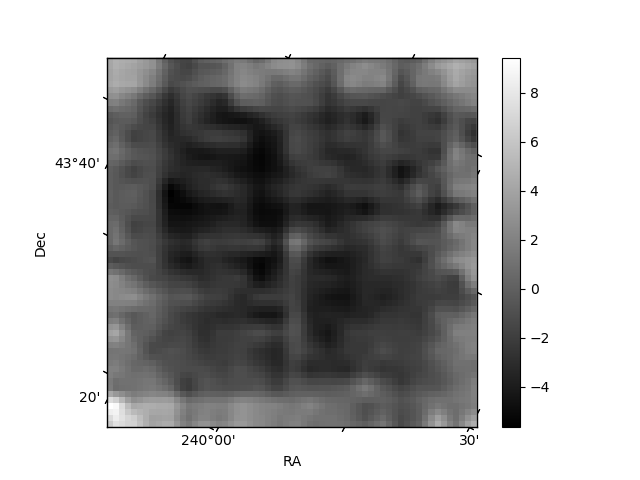 |
| Module-wise count rates for Quadrant B Data is divided into 100 sec bins |
 |
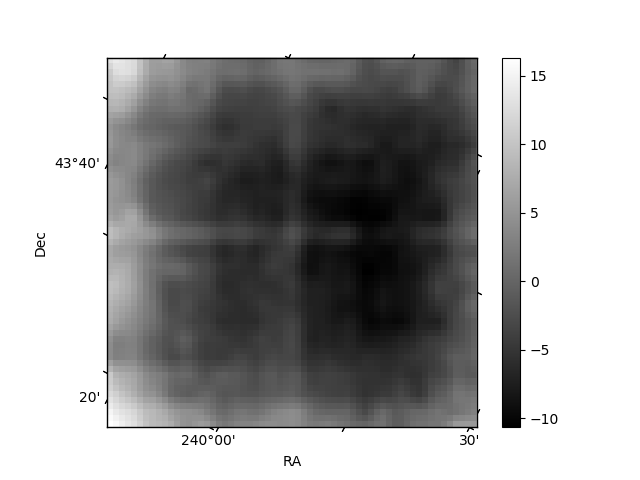 |
| Module-wise count rates for Quadrant C Data is divided into 100 sec bins |
 |
 |
| Module-wise count rates for Quadrant D Data is divided into 100 sec bins |
 |
 |
| Parameter | Plot |
|---|---|
| CZT HV Monitor | 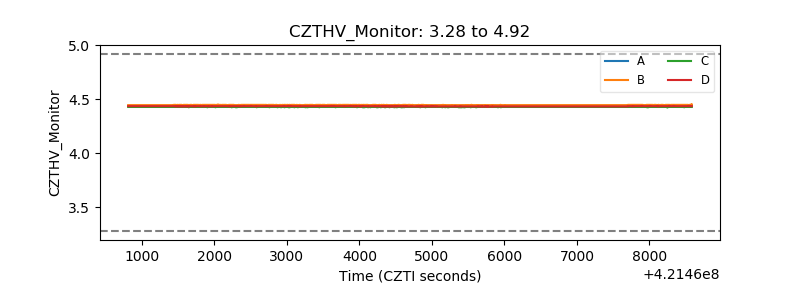 |
| D_VDD | 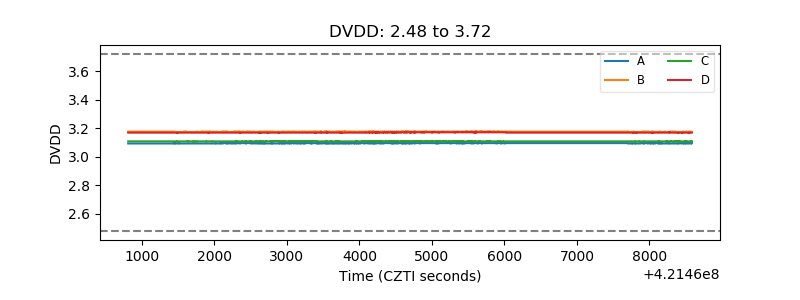 |
| Temperature 1 | 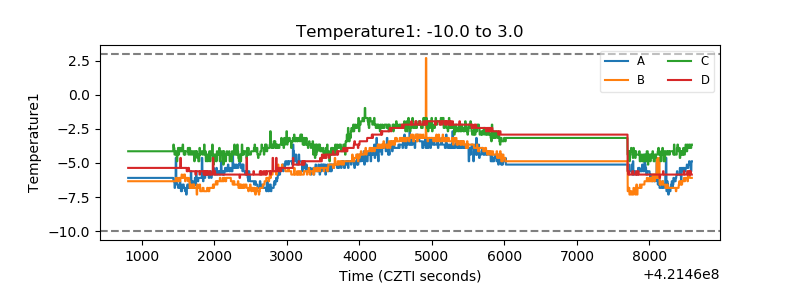 |
| Veto HV Monitor | 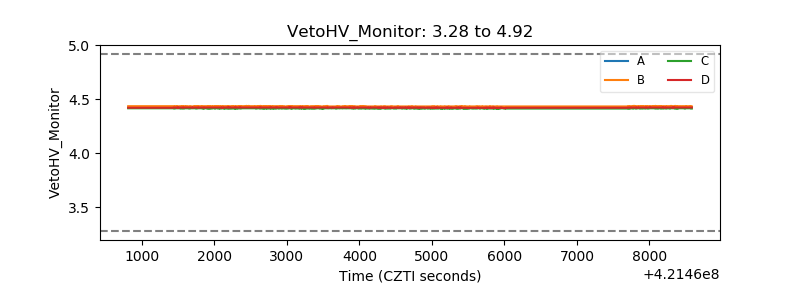 |
| Veto LLD | 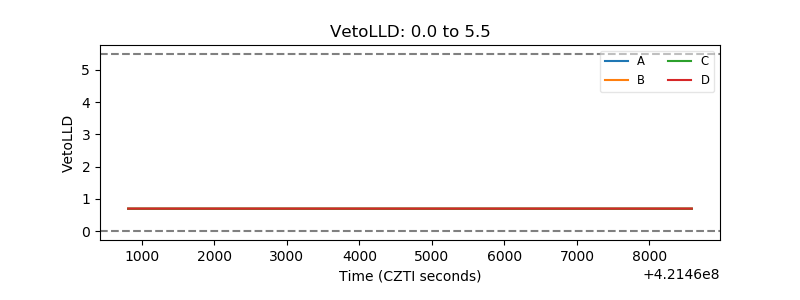 |
| Alpha Counter | 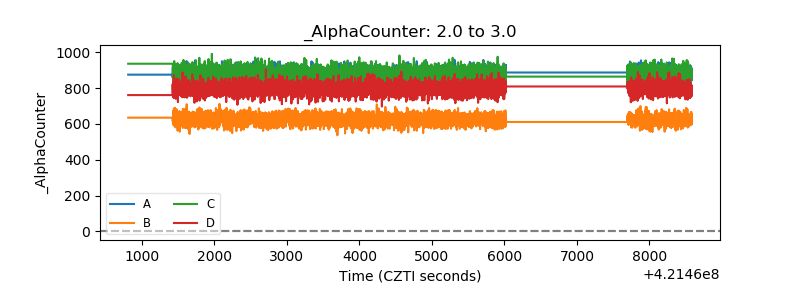 |
| _CPM_Rate | 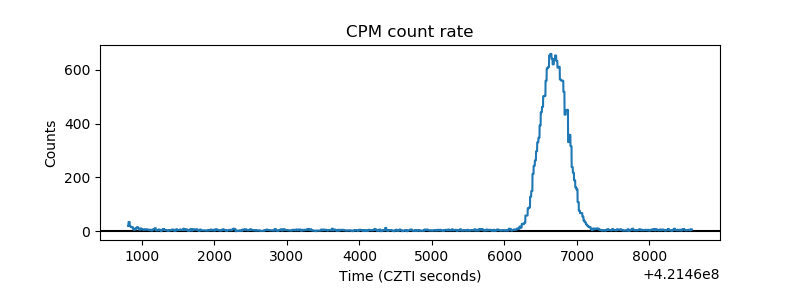 |
| CZT Counter | 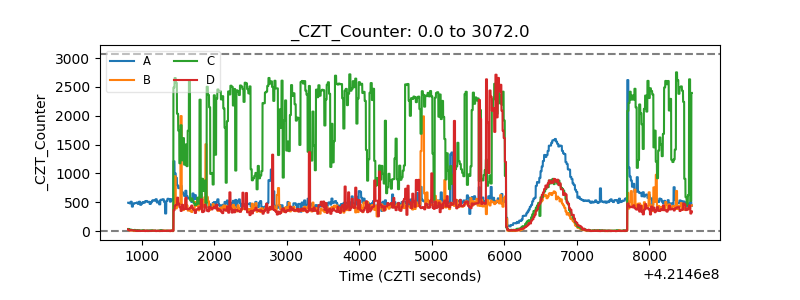 |
| +2.5 Volts monitor | 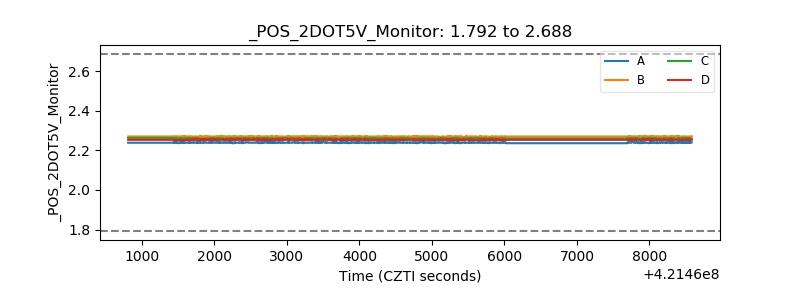 |
| +5 Volts monitor | 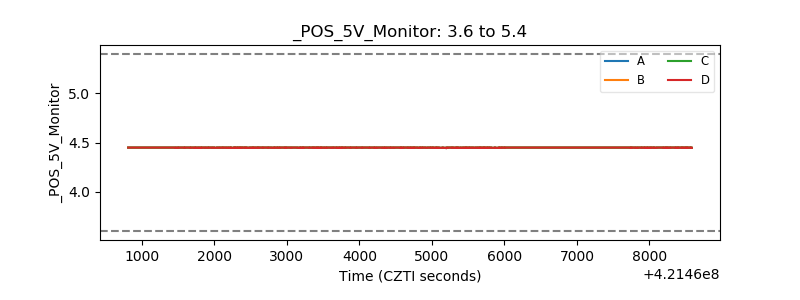 |
| _ROLL_ROT | 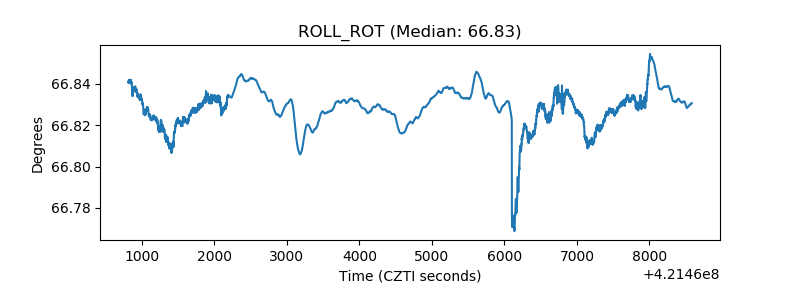 |
| _Roll_DEC | 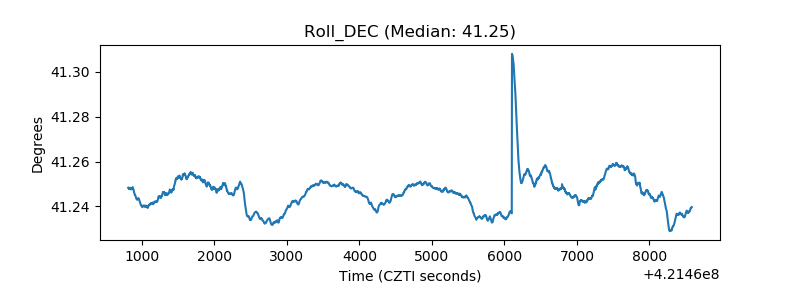 |
| _Roll_RA | 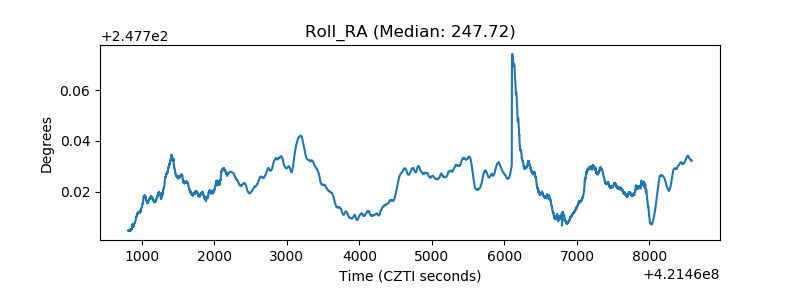 |
| Veto Counter | 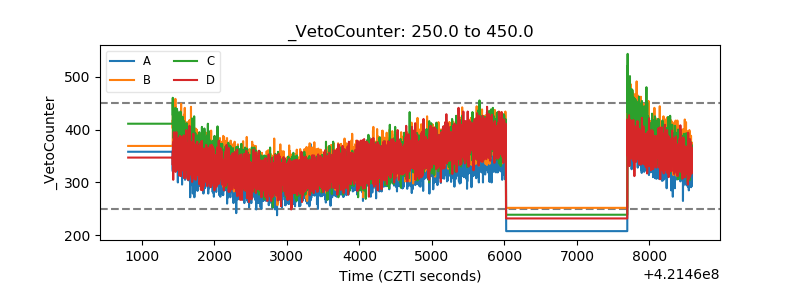 |