| Param | Original file | Final file |
|---|---|---|
| Filename | modeM0/AS1A12_101T01_9000005612_41182cztM0_level2.fits | modeM0/AS1A12_101T01_9000005612_41182cztM0_level2_quad_clean.evt |
| Size (bytes) | 437,163,840 | 79,032,960 |
| Size | 416.9 MB | 75.4 MB |
| Events in quadrant A | 2,766,981 | 580,071 |
| Events in quadrant B | 2,369,044 | 595,975 |
| Events in quadrant C | 8,402,622 | 319,209 |
| Events in quadrant D | 2,233,481 | 529,307 |
| Mode M9 | |||
|---|---|---|---|
| Quadrant | BADHDUFLAG | Total packets | Discarded packets |
| A | 0 | 26 | 0 |
| B | 0 | 26 | 0 |
| C | 0 | 26 | 0 |
| D | 0 | 27 | 0 |
| Mode M0 | |||
|---|---|---|---|
| Quadrant | BADHDUFLAG | Total packets | Discarded packets |
| A | 0 | 11394 | 3 |
| B | 0 | 10859 | 2 |
| C | 0 | 28522 | 2 |
| D | 0 | 10819 | 2 |
| Mode SS | |||
|---|---|---|---|
| Quadrant | BADHDUFLAG | Total packets | Discarded packets |
| A | 0 | 108 | 0 |
| B | 0 | 108 | 0 |
| C | 0 | 108 | 0 |
| D | 0 | 108 | 0 |
| Quadrant | Total seconds | Saturated seconds | Saturation percentage |
|---|---|---|---|
| A | 5260 | 6 | 0.114068% |
| B | 5260 | 15 | 0.285171% |
| C | 5260 | 2529 | 48.079848% |
| D | 5260 | 18 | 0.342205% |
Noise dominated data is calculated using 1-second bins in cleaned event files. If a bin has >2000 counts, and if more than 50% of those come from <1% of pixels, then it is considered to be noise-dominated and hence unusable.
| Quadrant | # 1 sec bins | Bins with >0 counts | Bins with >2000 counts | High rate bins dominated by noise | Noise dominated (total time) | Noise dominated (detector-on time) | Marked lightcurve |
|---|---|---|---|---|---|---|---|
| A | 7083 | 5261 | 2 | 2 | 0.03% | 0.04% | 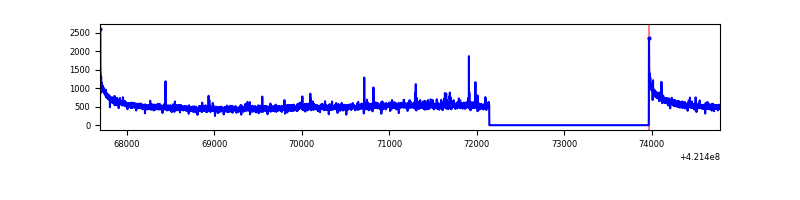 |
| B | 7083 | 5261 | 11 | 11 | 0.16% | 0.21% | 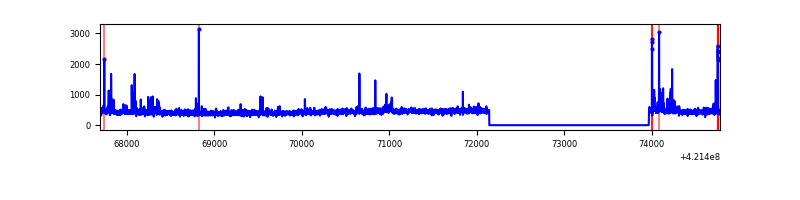 |
| C | 7083 | 5260 | 2097 | 2097 | 29.61% | 39.87% | 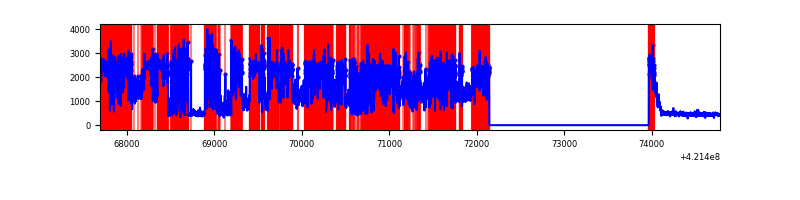 |
| D | 7083 | 5261 | 17 | 17 | 0.24% | 0.32% | 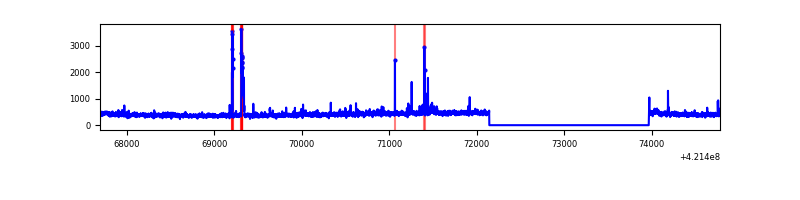 |
Top three noisy pixels from each quadrant. If the there are fewer than three noisy pixels in the level2.evt file, extra rows are filled as -1
| Pixel properties | Quadrant properties | ||||||
|---|---|---|---|---|---|---|---|
| Quadrant | DetID | PixID | Counts | Sigma | Mean | Median | Sigma |
| A | 10 | 83 | 503372 | 4338.4 | 564 | 553 | 115.9 |
| A | 12 | 189 | 37014 | 314.59 | 564 | 553 | 115.9 |
| A | 2 | 79 | 30176 | 255.59 | 564 | 553 | 115.9 |
| B | 0 | 190 | 94366 | 863.96 | 558 | 543 | 108.6 |
| B | 5 | 255 | 31425 | 284.37 | 558 | 543 | 108.6 |
| B | 0 | 229 | 30624 | 277.0 | 558 | 543 | 108.6 |
| C | 9 | 54 | 6230280 | 61496.64 | 434 | 436 | 101.3 |
| C | 0 | 10 | 272967 | 2690.23 | 434 | 436 | 101.3 |
| C | 15 | 214 | 186537 | 1837.06 | 434 | 436 | 101.3 |
| D | 9 | 19 | 70243 | 529.06 | 545 | 531 | 131.8 |
| D | 2 | 249 | 30897 | 230.45 | 545 | 531 | 131.8 |
| D | 2 | 234 | 22836 | 169.28 | 545 | 531 | 131.8 |
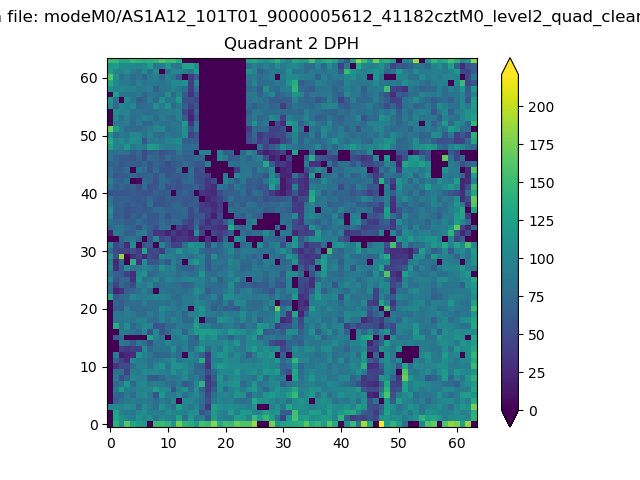
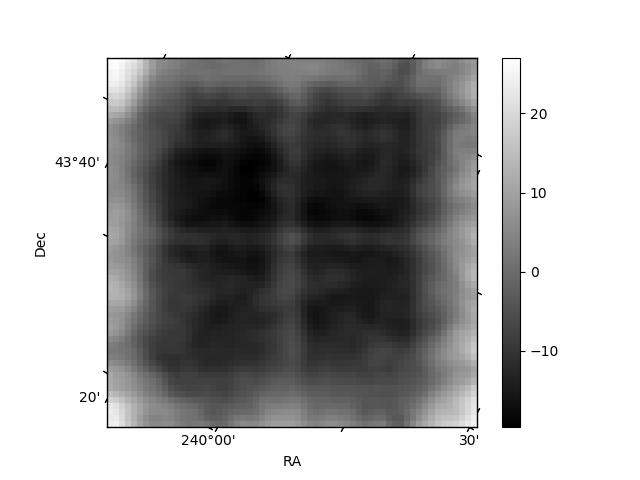
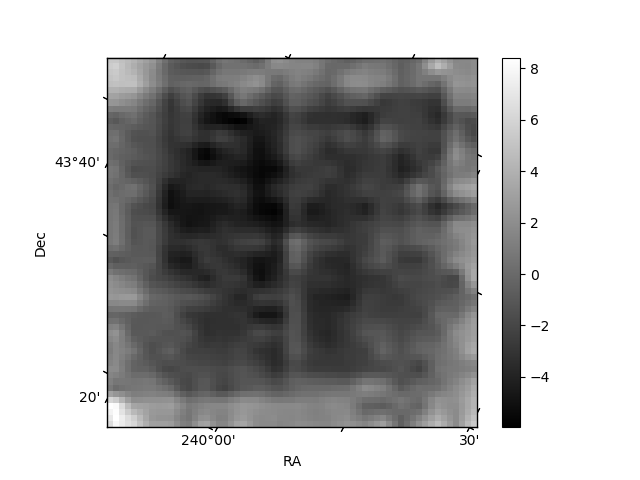
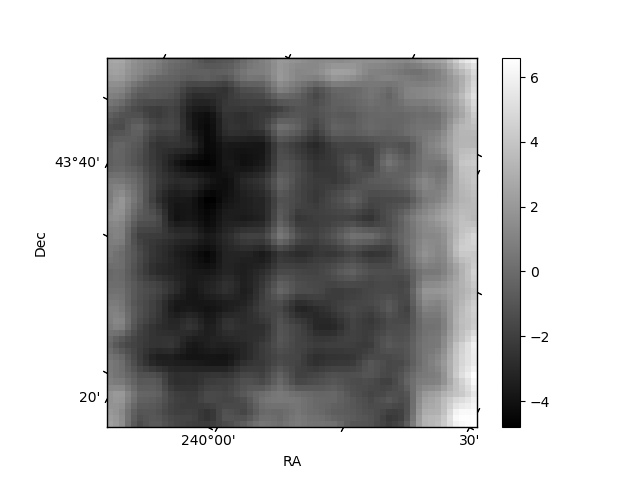
Histogram calculated using DETX and DETY for each event in the final _common_clean file
| Quadrant A | 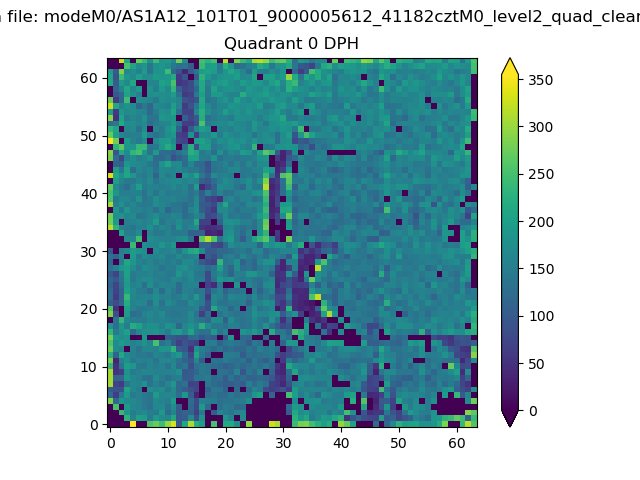 |
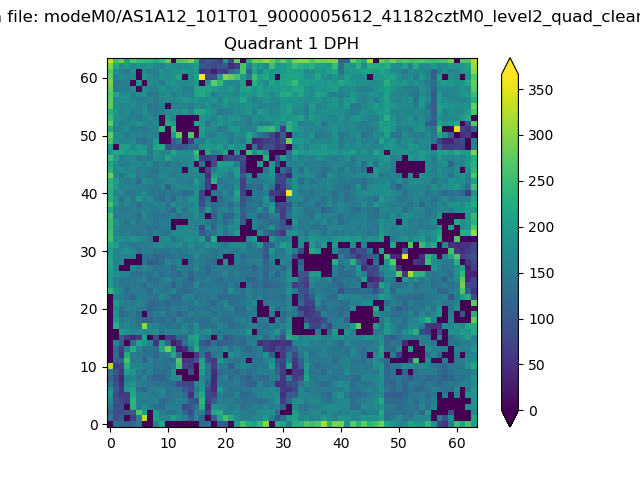 |
Quadrant B |
|---|---|---|---|
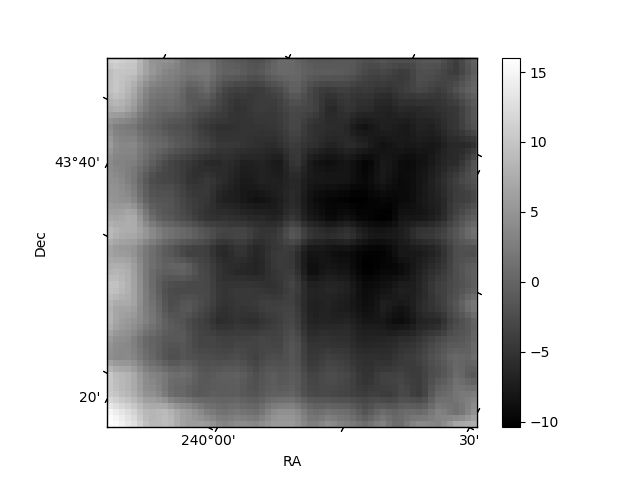
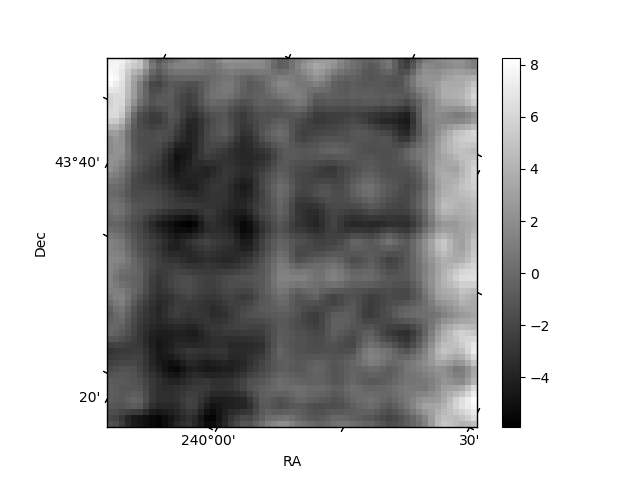
| Quadrant D | 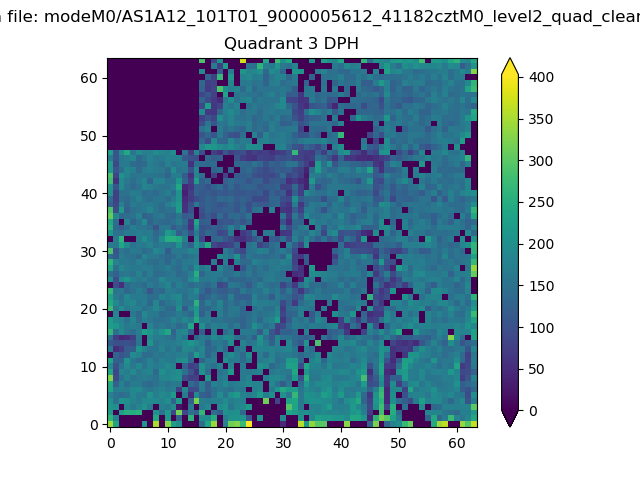 |
 |
Quadrant C |
| Plot type | Count rate plots | Images |
|---|---|---|
| Comparison with Poisson distribution Blue bars denote a histogram of data divided into 1 sec bins. Red curve is a Poisson curve with rate = median count rate of data. |
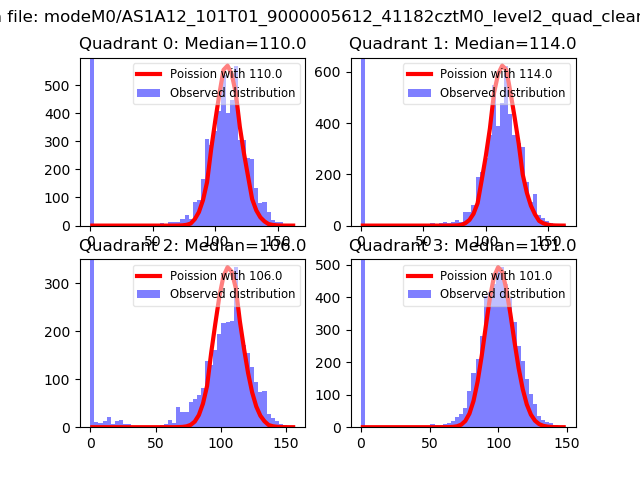 |
 |
| Quadrant-wise count rates Data is divided into 100 sec bins |
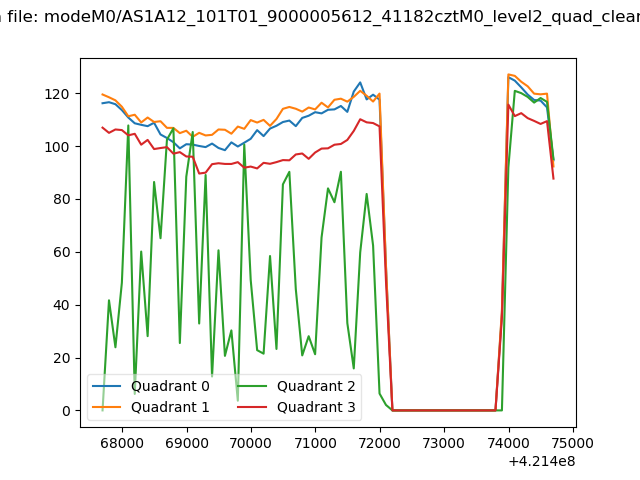 |
|
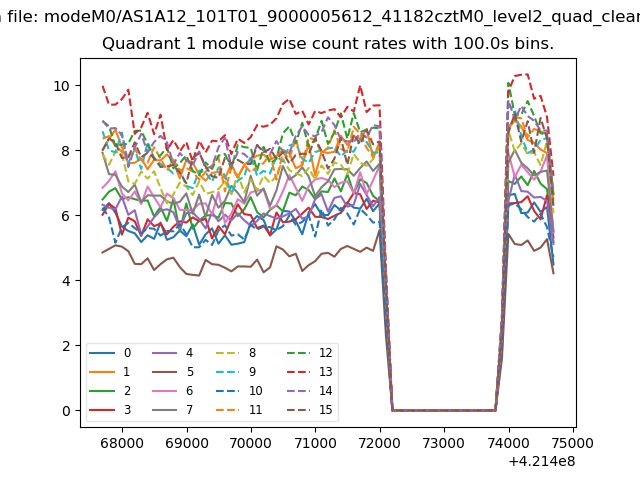
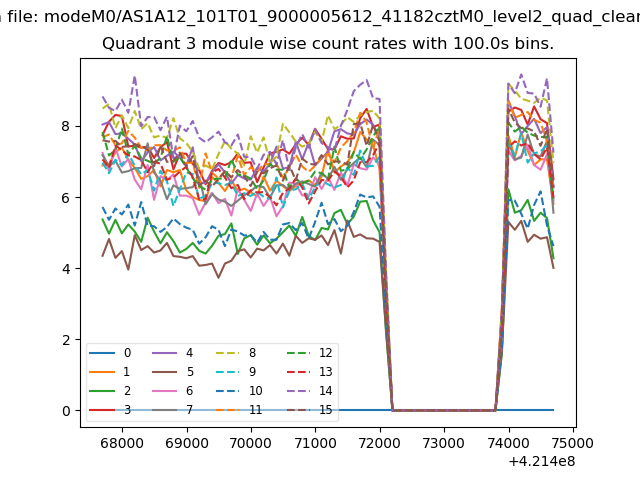
| Module-wise count rates for Quadrant A Data is divided into 100 sec bins |
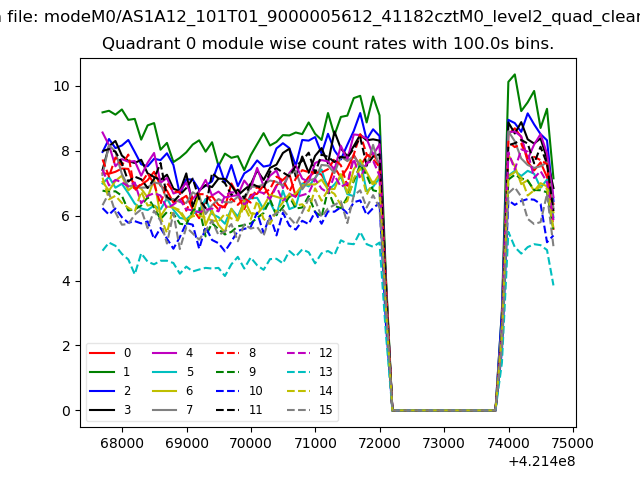 |
 |
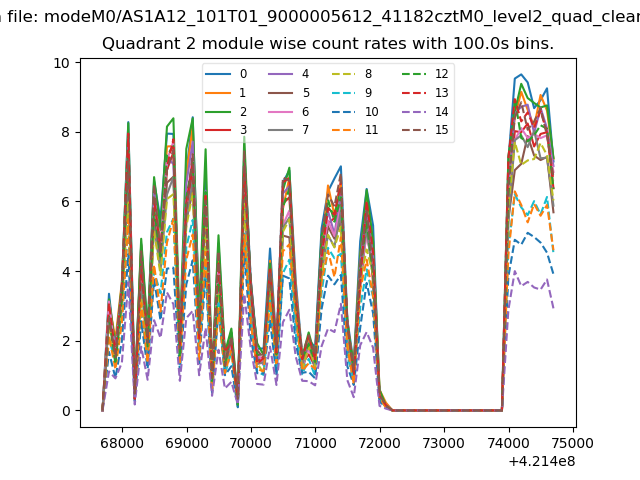
| Module-wise count rates for Quadrant B Data is divided into 100 sec bins |
 |
 |
| Module-wise count rates for Quadrant C Data is divided into 100 sec bins |
 |
 |
| Module-wise count rates for Quadrant D Data is divided into 100 sec bins |
 |
 |
| Parameter | Plot |
|---|---|
| CZT HV Monitor | 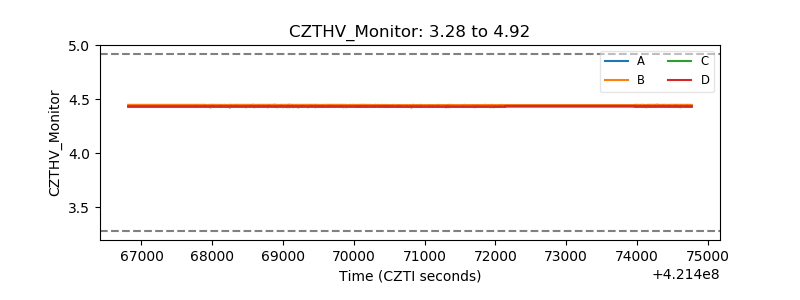 |
| D_VDD | 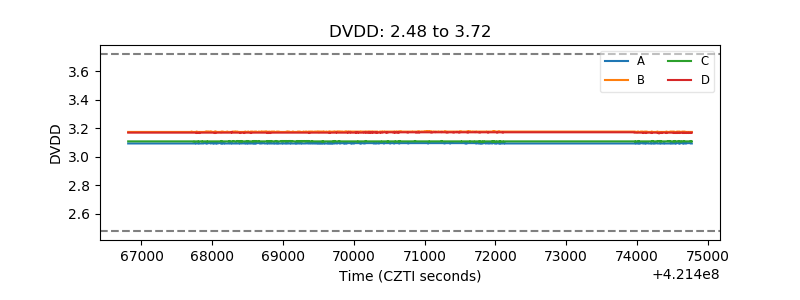 |
| Temperature 1 | 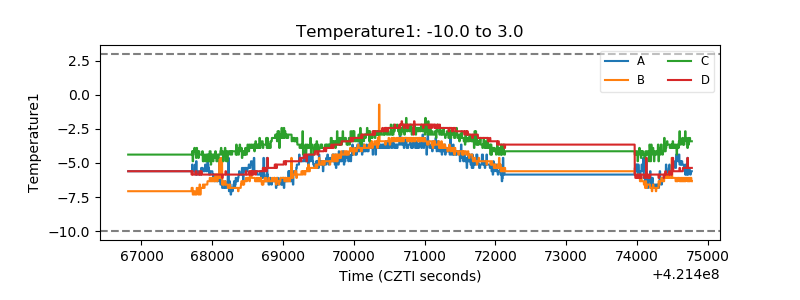 |
| Veto HV Monitor | 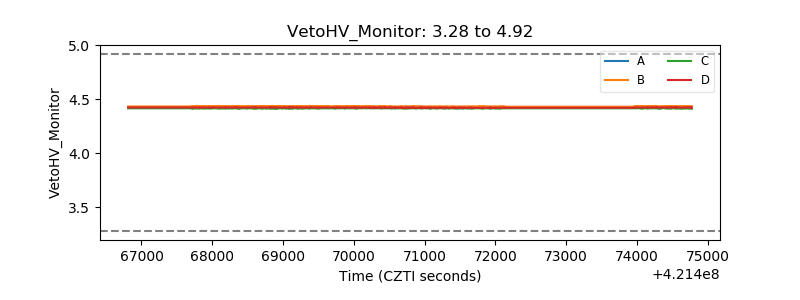 |
| Veto LLD | 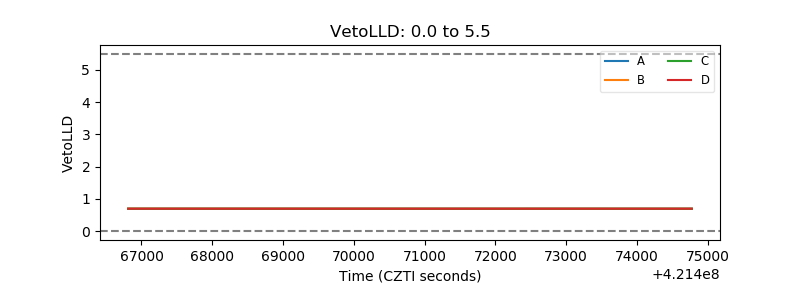 |
| Alpha Counter | 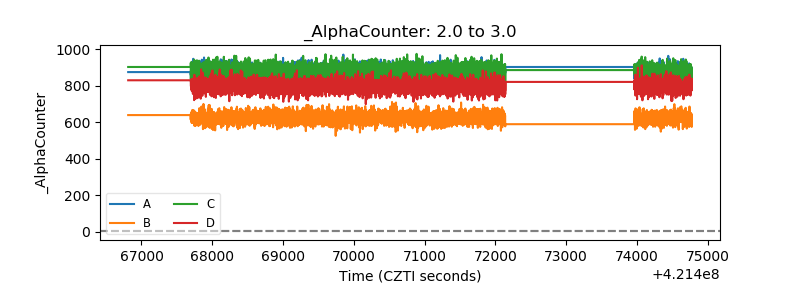 |
| _CPM_Rate | 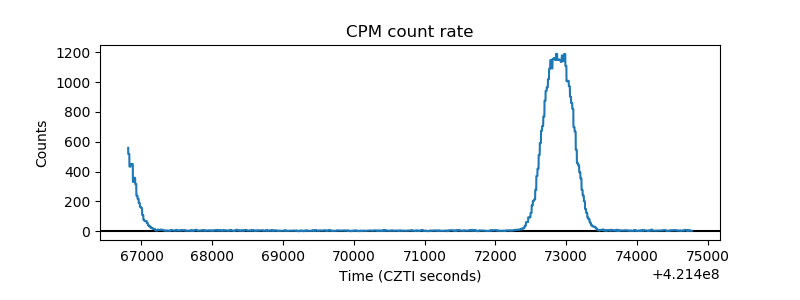 |
| CZT Counter | 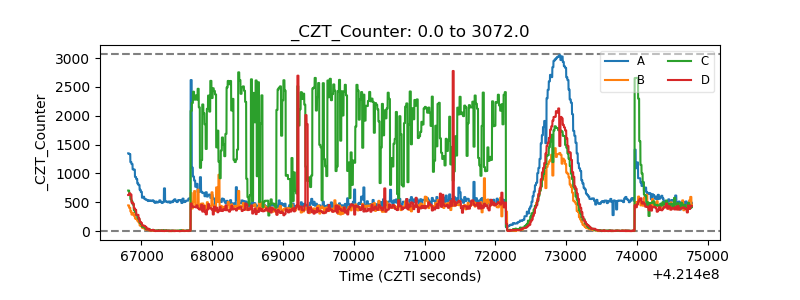 |
| +2.5 Volts monitor | 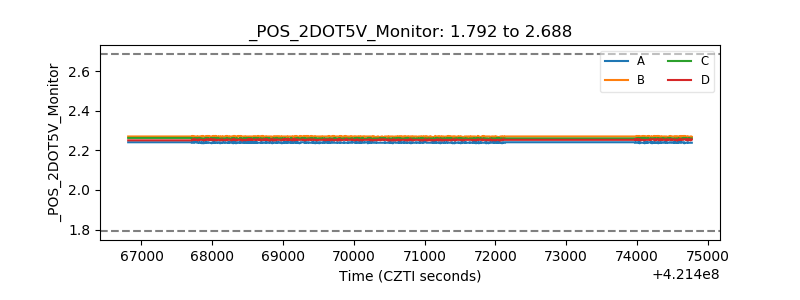 |
| +5 Volts monitor | 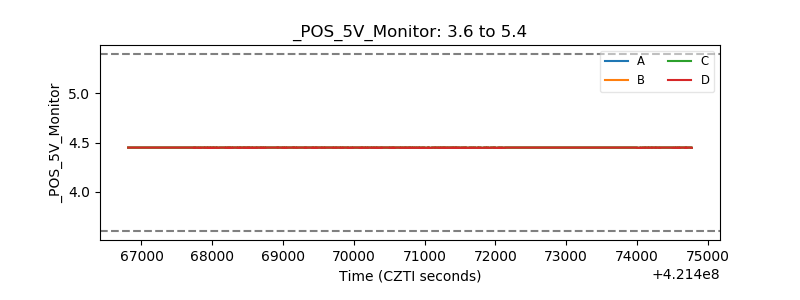 |
| _ROLL_ROT | 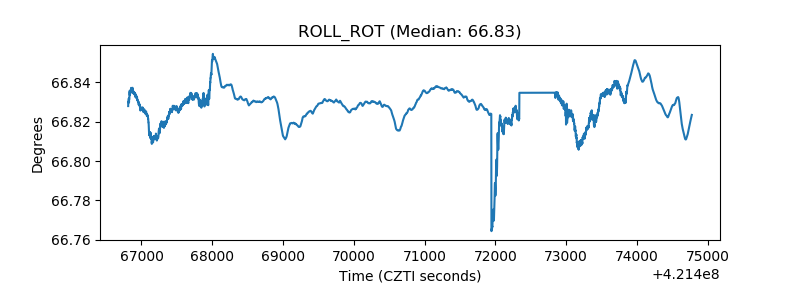 |
| _Roll_DEC | 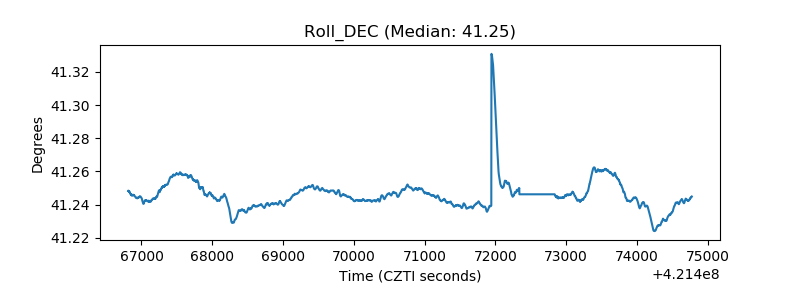 |
| _Roll_RA | 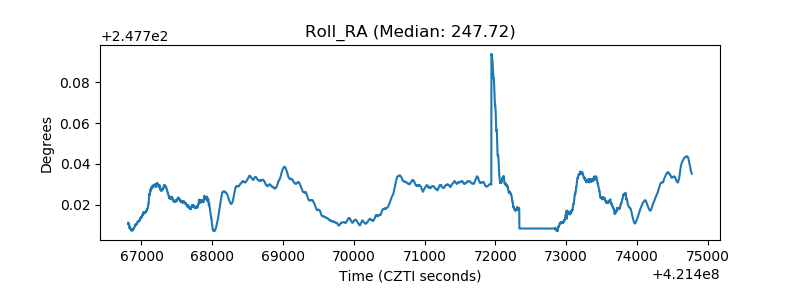 |
| Veto Counter | 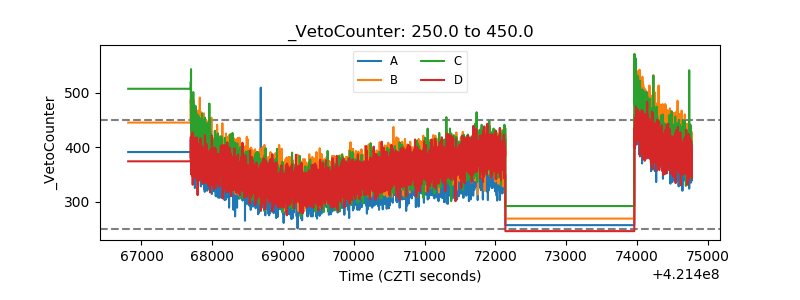 |