| Param | Original file | Final file |
|---|---|---|
| Filename | modeM0/AS1A12_101T01_9000005612_41183cztM0_level2.fits | modeM0/AS1A12_101T01_9000005612_41183cztM0_level2_quad_clean.evt |
| Size (bytes) | 334,935,360 | 87,560,640 |
| Size | 319.4 MB | 83.5 MB |
| Events in quadrant A | 2,741,893 | 598,480 |
| Events in quadrant B | 3,107,022 | 608,198 |
| Events in quadrant C | 2,749,546 | 570,222 |
| Events in quadrant D | 3,400,527 | 515,591 |
| Mode M9 | |||
|---|---|---|---|
| Quadrant | BADHDUFLAG | Total packets | Discarded packets |
| A | 0 | 29 | 0 |
| B | 0 | 29 | 0 |
| C | 0 | 29 | 0 |
| D | 0 | 30 | 0 |
| Mode M0 | |||
|---|---|---|---|
| Quadrant | BADHDUFLAG | Total packets | Discarded packets |
| A | 0 | 11163 | 3 |
| B | 0 | 12645 | 2 |
| C | 0 | 11442 | 2 |
| D | 0 | 13981 | 2 |
| Mode SS | |||
|---|---|---|---|
| Quadrant | BADHDUFLAG | Total packets | Discarded packets |
| A | 0 | 104 | 0 |
| B | 0 | 104 | 0 |
| C | 0 | 104 | 0 |
| D | 0 | 104 | 0 |
| Quadrant | Total seconds | Saturated seconds | Saturation percentage |
|---|---|---|---|
| A | 5126 | 11 | 0.214592% |
| B | 5126 | 94 | 1.833789% |
| C | 5126 | 114 | 2.223956% |
| D | 5126 | 278 | 5.423332% |
Noise dominated data is calculated using 1-second bins in cleaned event files. If a bin has >2000 counts, and if more than 50% of those come from <1% of pixels, then it is considered to be noise-dominated and hence unusable.
| Quadrant | # 1 sec bins | Bins with >0 counts | Bins with >2000 counts | High rate bins dominated by noise | Noise dominated (total time) | Noise dominated (detector-on time) | Marked lightcurve |
|---|---|---|---|---|---|---|---|
| A | 7039 | 5127 | 2 | 2 | 0.03% | 0.04% | 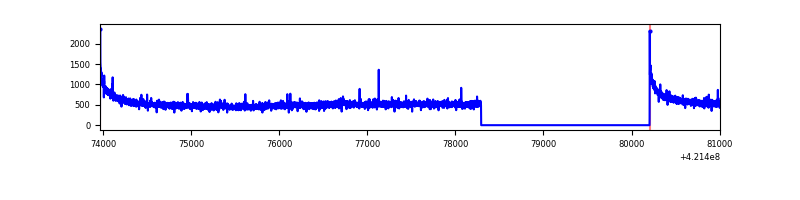 |
| B | 7039 | 5127 | 76 | 76 | 1.08% | 1.48% | 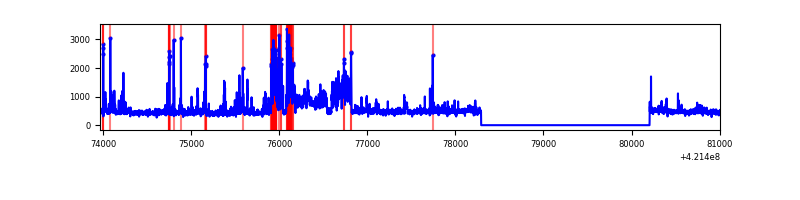 |
| C | 7039 | 5127 | 113 | 113 | 1.61% | 2.20% | 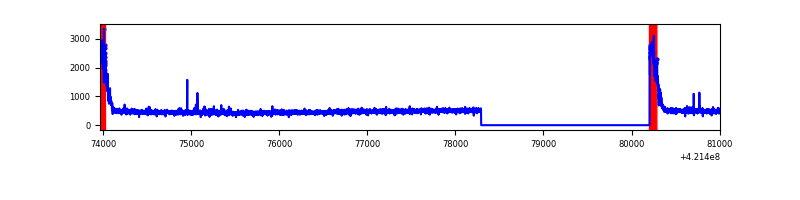 |
| D | 7039 | 5127 | 260 | 260 | 3.69% | 5.07% | 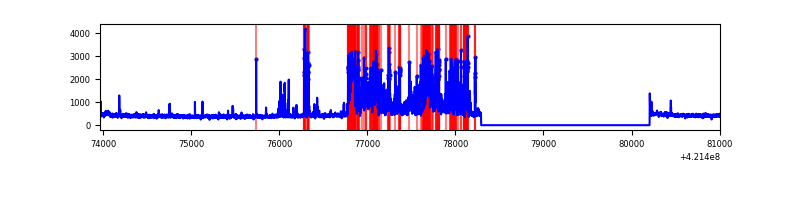 |
Top three noisy pixels from each quadrant. If the there are fewer than three noisy pixels in the level2.evt file, extra rows are filled as -1
| Pixel properties | Quadrant properties | ||||||
|---|---|---|---|---|---|---|---|
| Quadrant | DetID | PixID | Counts | Sigma | Mean | Median | Sigma |
| A | 10 | 83 | 492963 | 4175.59 | 572 | 562 | 117.9 |
| A | 12 | 189 | 15050 | 122.86 | 572 | 562 | 117.9 |
| A | 2 | 79 | 9053 | 72.0 | 572 | 562 | 117.9 |
| B | 0 | 229 | 742350 | 6824.57 | 563 | 548 | 108.7 |
| B | 5 | 255 | 78381 | 716.06 | 563 | 548 | 108.7 |
| B | 0 | 190 | 62219 | 567.37 | 563 | 548 | 108.7 |
| C | 0 | 10 | 392414 | 3076.63 | 543 | 547 | 127.4 |
| C | 15 | 214 | 223387 | 1749.56 | 543 | 547 | 127.4 |
| C | 9 | 54 | 8018 | 58.66 | 543 | 547 | 127.4 |
| D | 13 | 249 | 639759 | 4842.74 | 541 | 526 | 132.0 |
| D | 12 | 233 | 633984 | 4798.99 | 541 | 526 | 132.0 |
| D | 2 | 234 | 23082 | 170.88 | 541 | 526 | 132.0 |
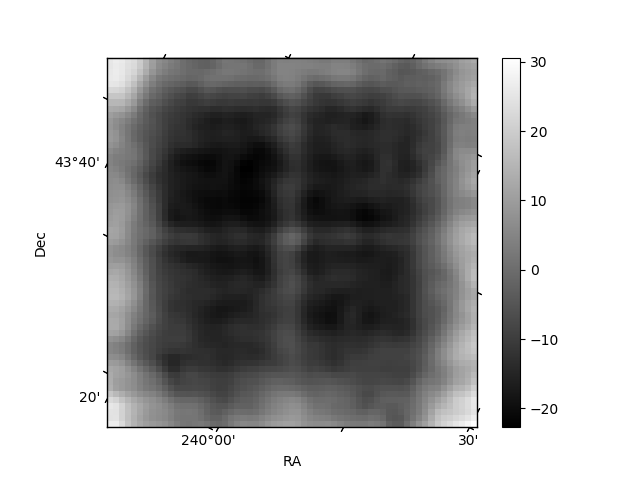
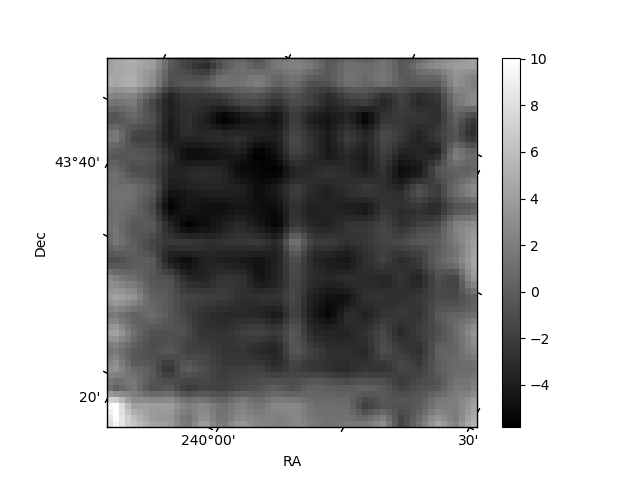
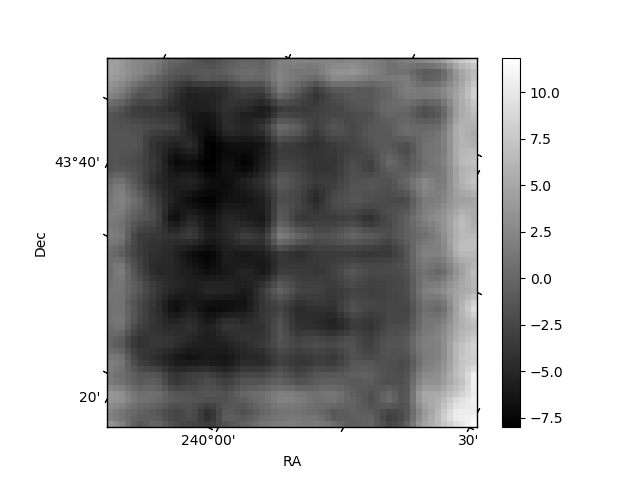
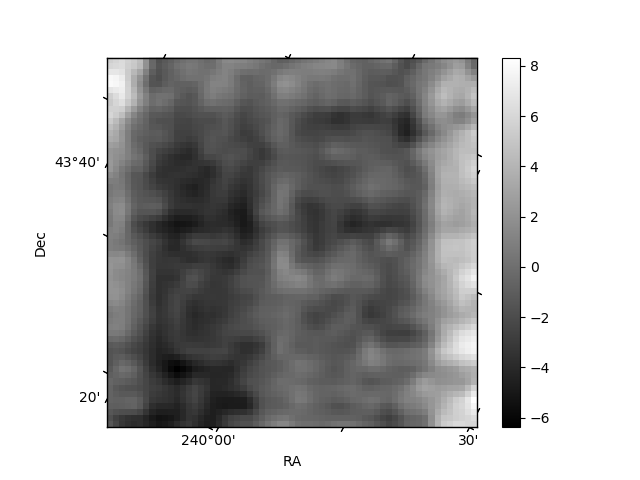
Histogram calculated using DETX and DETY for each event in the final _common_clean file
| Quadrant A | 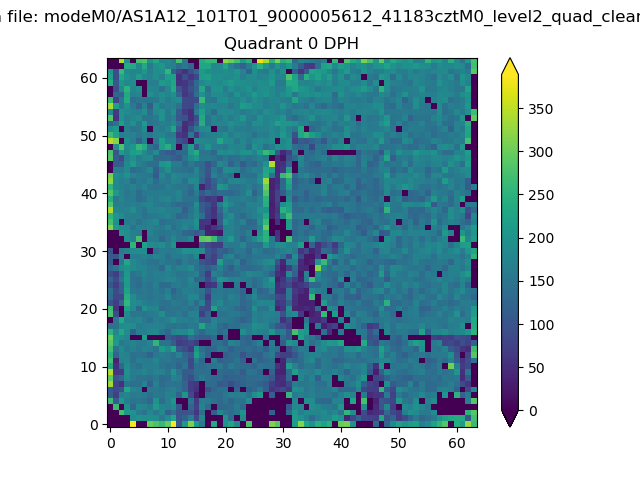 |
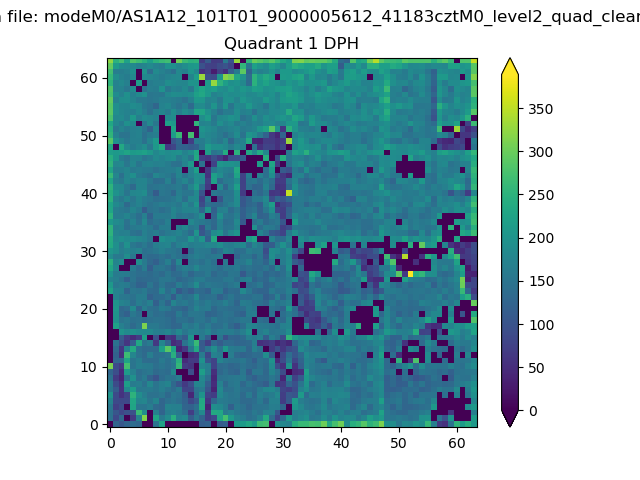 |
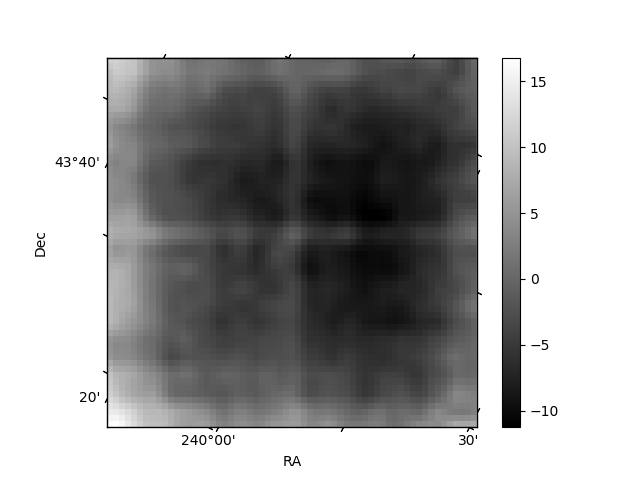
Quadrant B |
|---|---|---|---|
| Quadrant D | 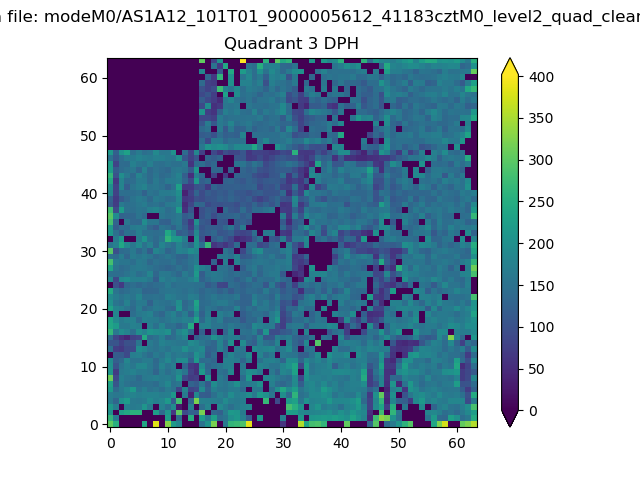 |
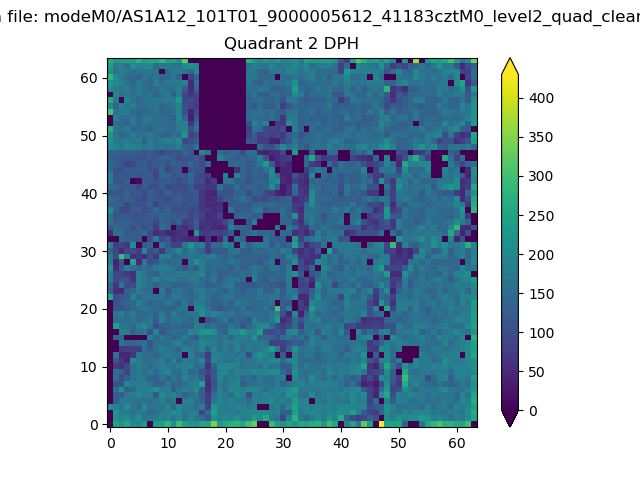 |
Quadrant C |
| Plot type | Count rate plots | Images |
|---|---|---|
| Comparison with Poisson distribution Blue bars denote a histogram of data divided into 1 sec bins. Red curve is a Poisson curve with rate = median count rate of data. |
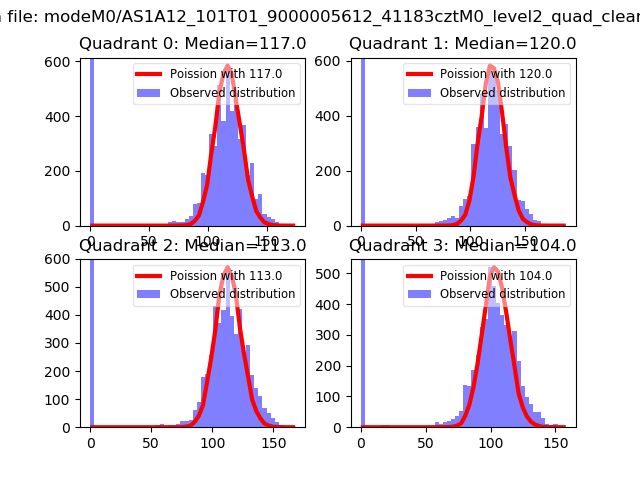 |
 |
| Quadrant-wise count rates Data is divided into 100 sec bins |
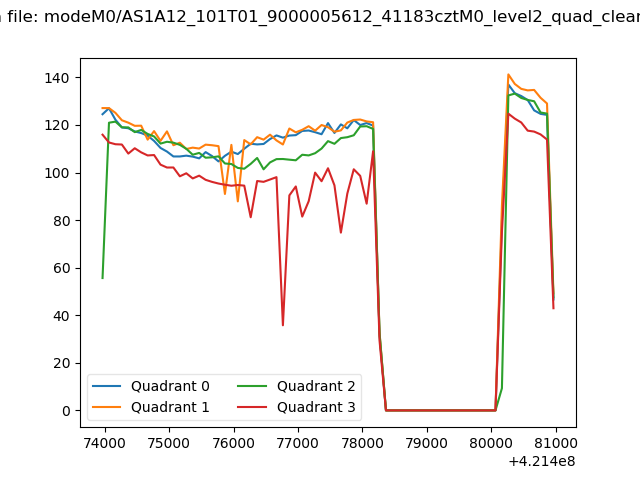 |
|
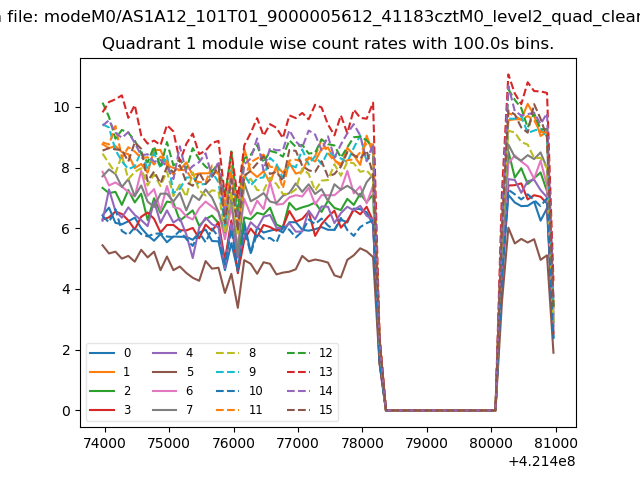
| Module-wise count rates for Quadrant A Data is divided into 100 sec bins |
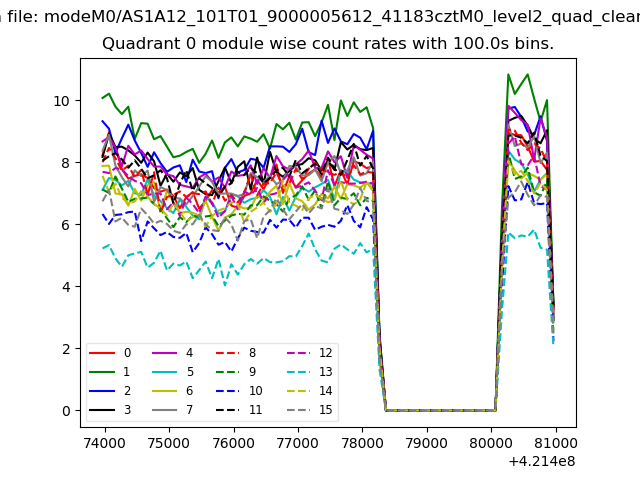 |
 |
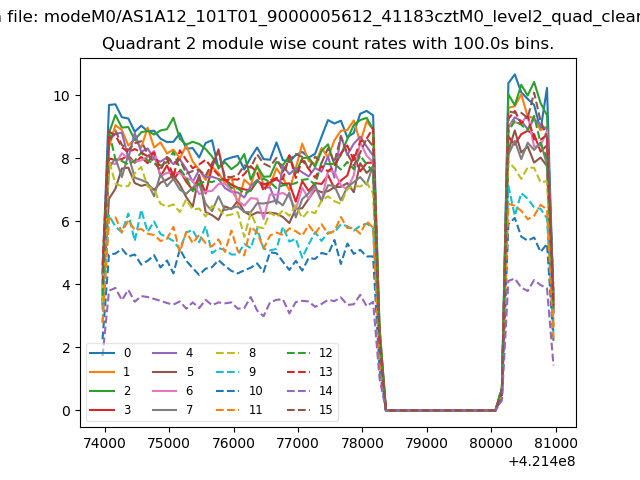
| Module-wise count rates for Quadrant B Data is divided into 100 sec bins |
 |
 |
| Module-wise count rates for Quadrant C Data is divided into 100 sec bins |
 |
 |
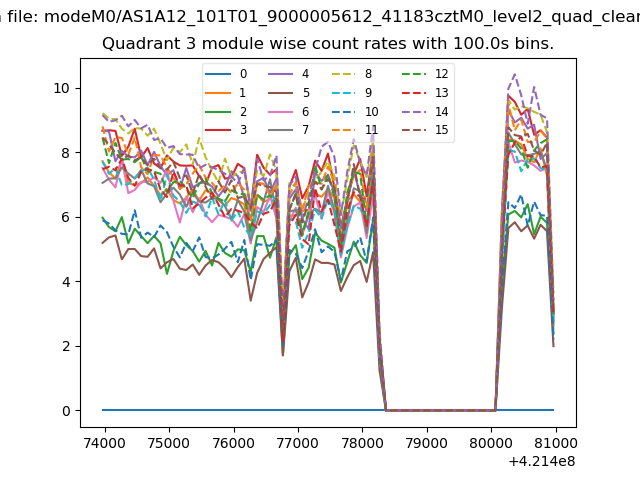
| Module-wise count rates for Quadrant D Data is divided into 100 sec bins |
 |
 |
| Parameter | Plot |
|---|---|
| CZT HV Monitor | 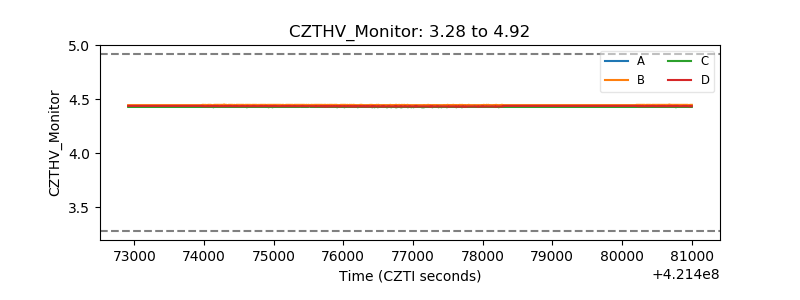 |
| D_VDD | 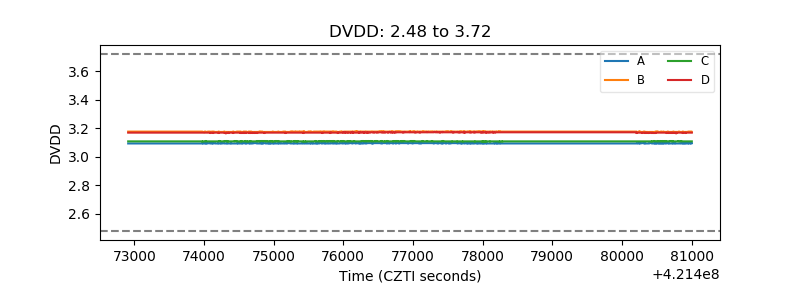 |
| Temperature 1 | 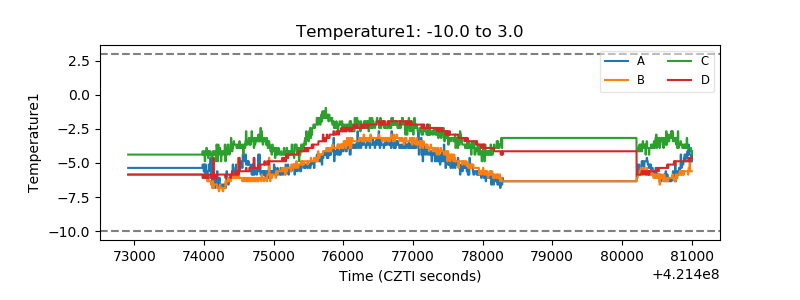 |
| Veto HV Monitor | 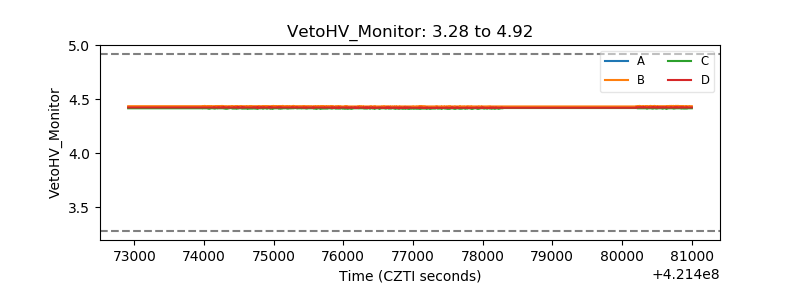 |
| Veto LLD | 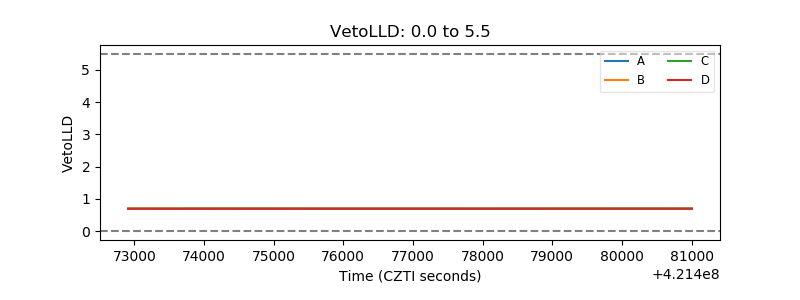 |
| Alpha Counter | 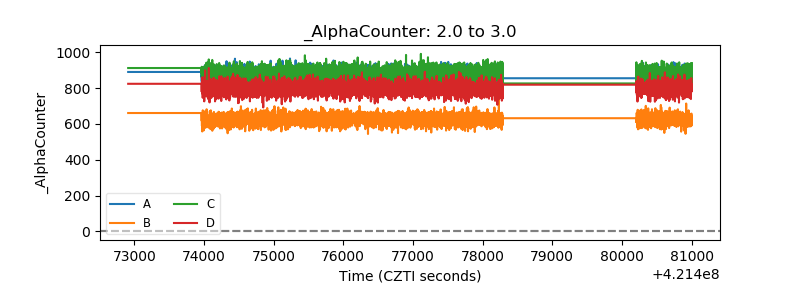 |
| _CPM_Rate | 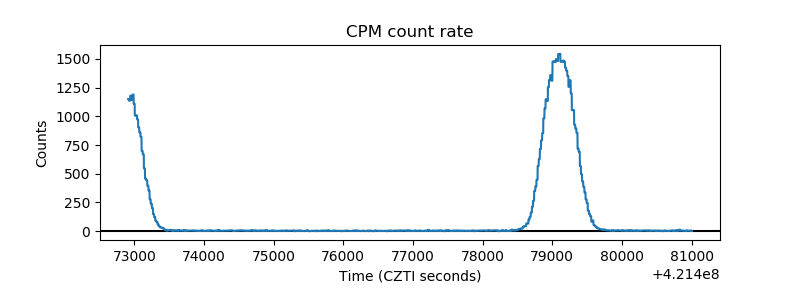 |
| CZT Counter | 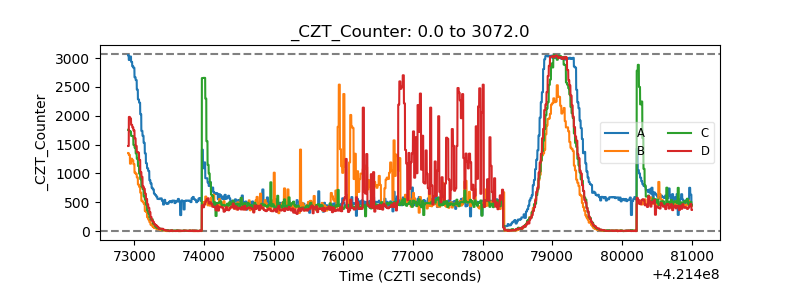 |
| +2.5 Volts monitor | 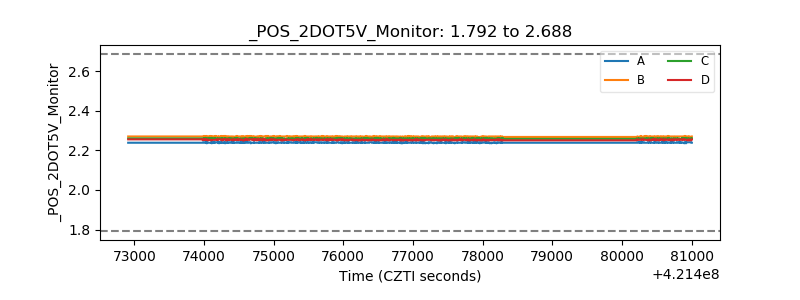 |
| +5 Volts monitor | 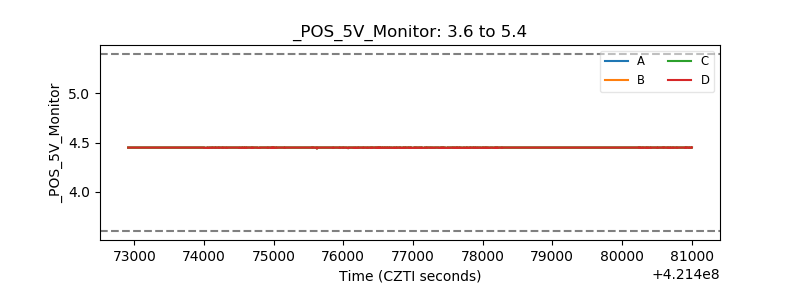 |
| _ROLL_ROT | 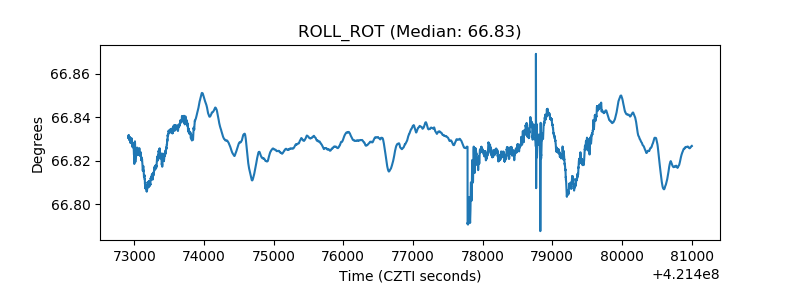 |
| _Roll_DEC | 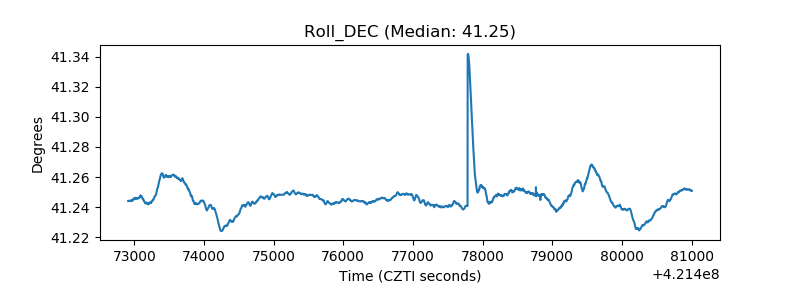 |
| _Roll_RA | 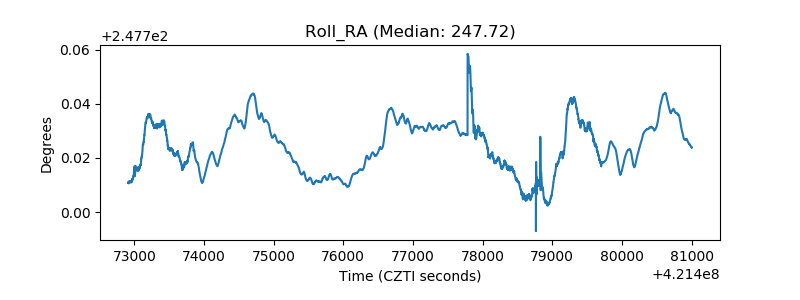 |
| Veto Counter | 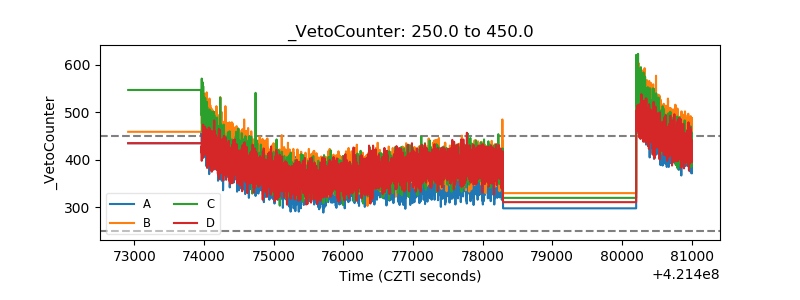 |