| Param | Original file | Final file |
|---|---|---|
| Filename | modeM0/AS1A12_101T01_9000005612_41184cztM0_level2.fits | modeM0/AS1A12_101T01_9000005612_41184cztM0_level2_quad_clean.evt |
| Size (bytes) | 328,446,720 | 96,030,720 |
| Size | 313.2 MB | 91.6 MB |
| Events in quadrant A | 3,028,254 | 659,565 |
| Events in quadrant B | 3,004,120 | 667,905 |
| Events in quadrant C | 3,271,279 | 614,440 |
| Events in quadrant D | 2,435,842 | 590,155 |
| Mode M9 | |||
|---|---|---|---|
| Quadrant | BADHDUFLAG | Total packets | Discarded packets |
| A | 0 | 28 | 0 |
| B | 0 | 28 | 0 |
| C | 0 | 28 | 0 |
| D | 0 | 29 | 0 |
| Mode M0 | |||
|---|---|---|---|
| Quadrant | BADHDUFLAG | Total packets | Discarded packets |
| A | 0 | 12136 | 3 |
| B | 0 | 12412 | 2 |
| C | 0 | 13013 | 2 |
| D | 0 | 11000 | 2 |
| Mode SS | |||
|---|---|---|---|
| Quadrant | BADHDUFLAG | Total packets | Discarded packets |
| A | 0 | 110 | 0 |
| B | 0 | 110 | 0 |
| C | 0 | 110 | 0 |
| D | 0 | 110 | 0 |
| Quadrant | Total seconds | Saturated seconds | Saturation percentage |
|---|---|---|---|
| A | 5369 | 13 | 0.242131% |
| B | 5369 | 140 | 2.607562% |
| C | 5369 | 207 | 3.855467% |
| D | 5369 | 16 | 0.298007% |
Noise dominated data is calculated using 1-second bins in cleaned event files. If a bin has >2000 counts, and if more than 50% of those come from <1% of pixels, then it is considered to be noise-dominated and hence unusable.
| Quadrant | # 1 sec bins | Bins with >0 counts | Bins with >2000 counts | High rate bins dominated by noise | Noise dominated (total time) | Noise dominated (detector-on time) | Marked lightcurve |
|---|---|---|---|---|---|---|---|
| A | 7402 | 5370 | 3 | 3 | 0.04% | 0.06% | 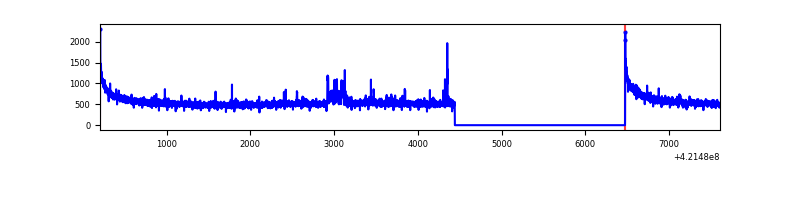 |
| B | 7402 | 5370 | 102 | 102 | 1.38% | 1.90% | 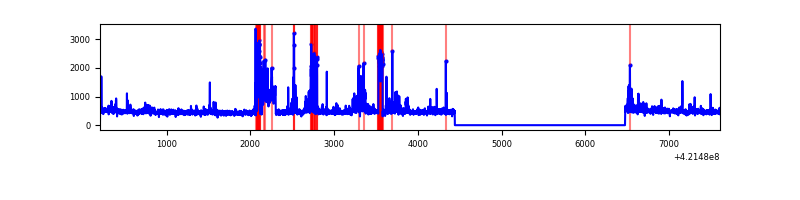 |
| C | 7402 | 5370 | 200 | 200 | 2.70% | 3.72% | 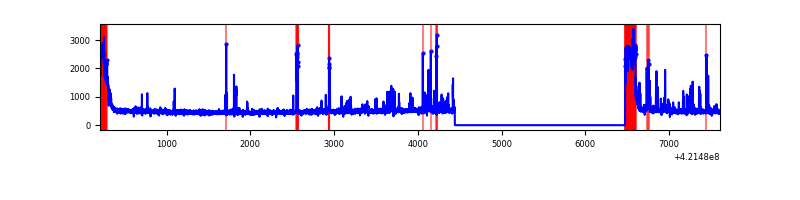 |
| D | 7402 | 5370 | 11 | 11 | 0.15% | 0.20% | 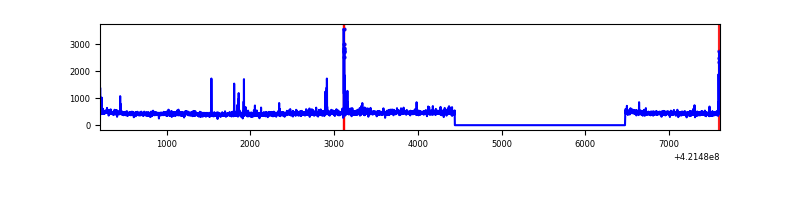 |
Top three noisy pixels from each quadrant. If the there are fewer than three noisy pixels in the level2.evt file, extra rows are filled as -1
| Pixel properties | Quadrant properties | ||||||
|---|---|---|---|---|---|---|---|
| Quadrant | DetID | PixID | Counts | Sigma | Mean | Median | Sigma |
| A | 10 | 83 | 509989 | 4029.71 | 625 | 615 | 126.4 |
| A | 12 | 189 | 47190 | 368.46 | 625 | 615 | 126.4 |
| A | 2 | 79 | 29105 | 225.39 | 625 | 615 | 126.4 |
| B | 0 | 229 | 282381 | 2452.69 | 607 | 591 | 114.9 |
| B | 5 | 185 | 204085 | 1771.2 | 607 | 591 | 114.9 |
| B | 5 | 255 | 77626 | 670.51 | 607 | 591 | 114.9 |
| C | 0 | 10 | 444166 | 3311.45 | 583 | 587 | 134.0 |
| C | 9 | 54 | 304733 | 2270.54 | 583 | 587 | 134.0 |
| C | 15 | 214 | 232041 | 1727.87 | 583 | 587 | 134.0 |
| D | 13 | 249 | 68955 | 468.06 | 602 | 585 | 146.1 |
| D | 2 | 249 | 29928 | 200.88 | 602 | 585 | 146.1 |
| D | 2 | 120 | 29134 | 195.45 | 602 | 585 | 146.1 |
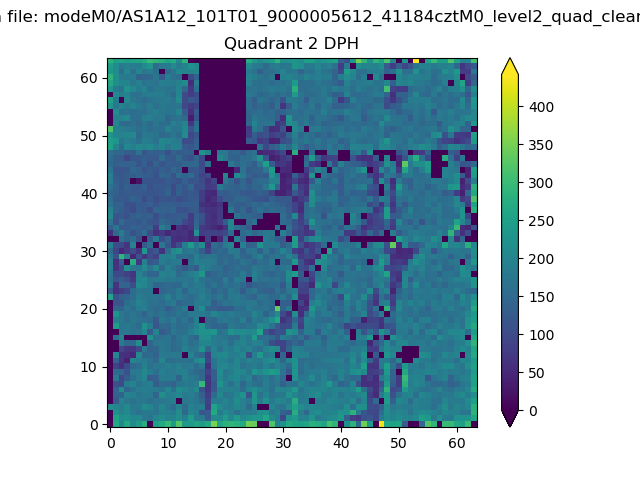
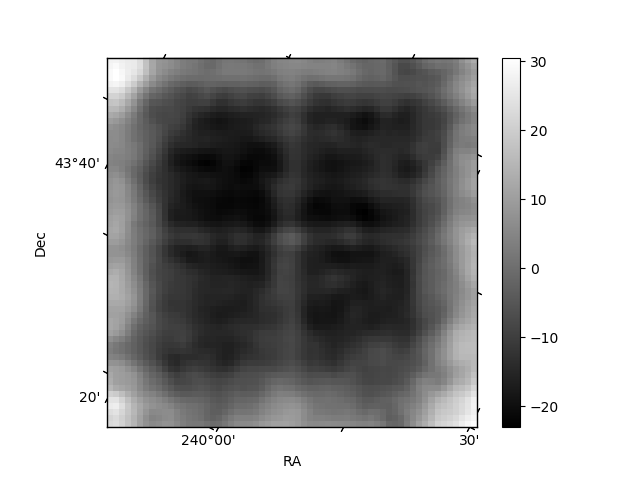
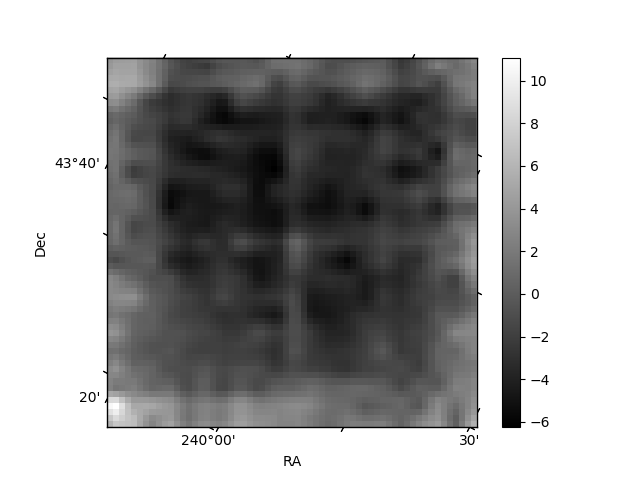
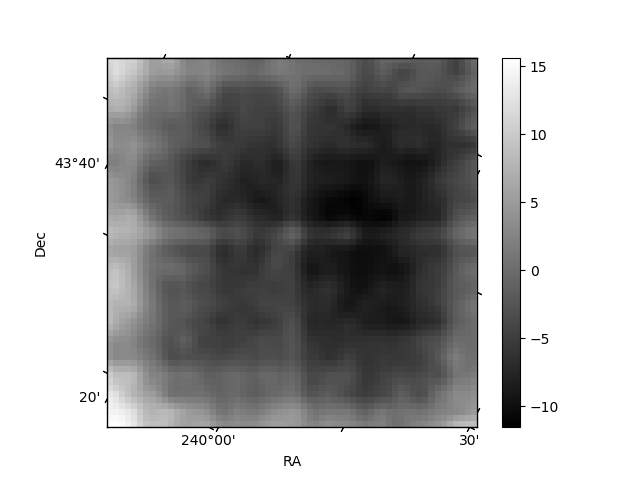
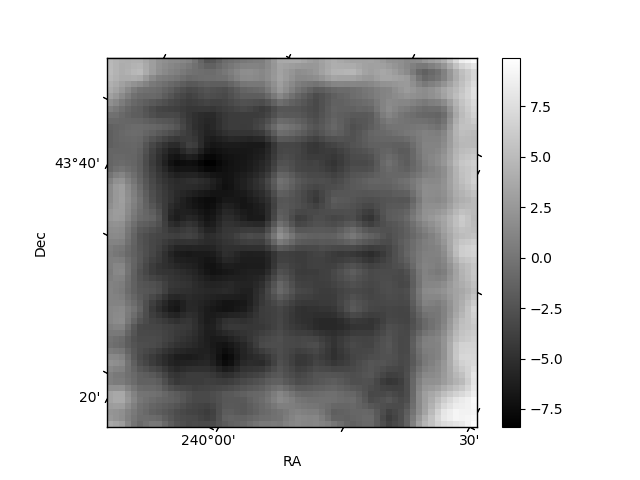
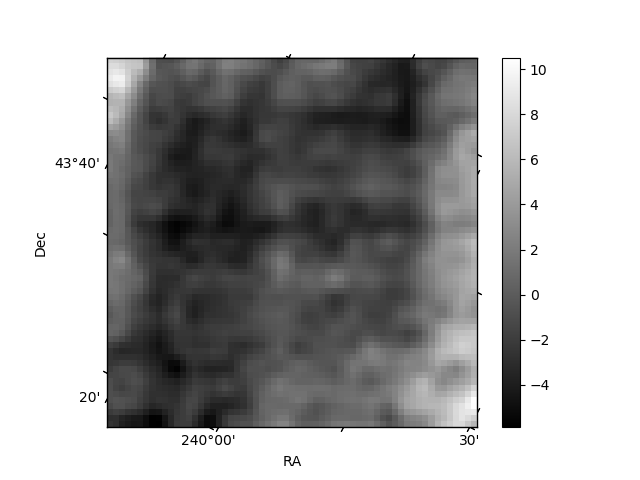
Histogram calculated using DETX and DETY for each event in the final _common_clean file
| Quadrant A | 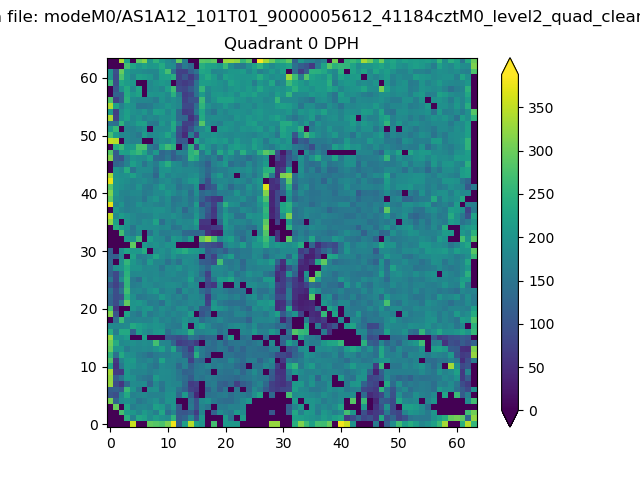 |
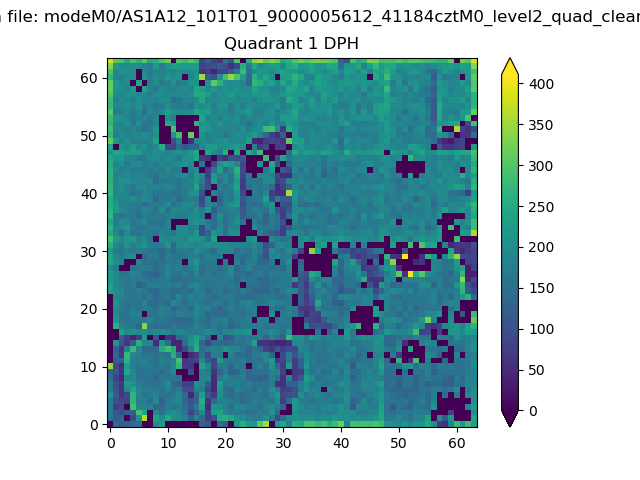 |
Quadrant B |
|---|---|---|---|
| Quadrant D | 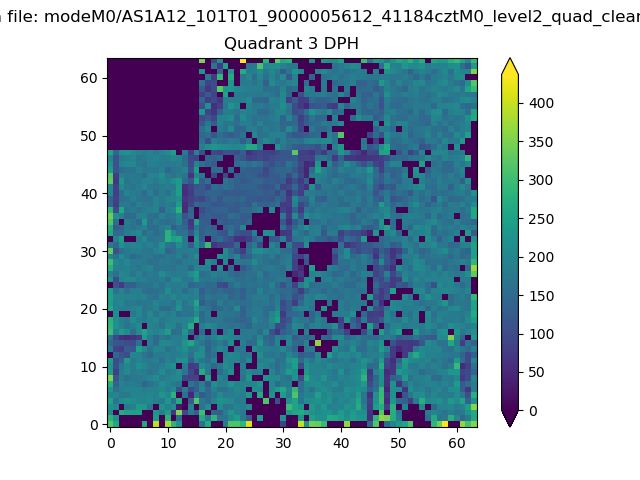 |
 |
Quadrant C |
| Plot type | Count rate plots | Images |
|---|---|---|
| Comparison with Poisson distribution Blue bars denote a histogram of data divided into 1 sec bins. Red curve is a Poisson curve with rate = median count rate of data. |
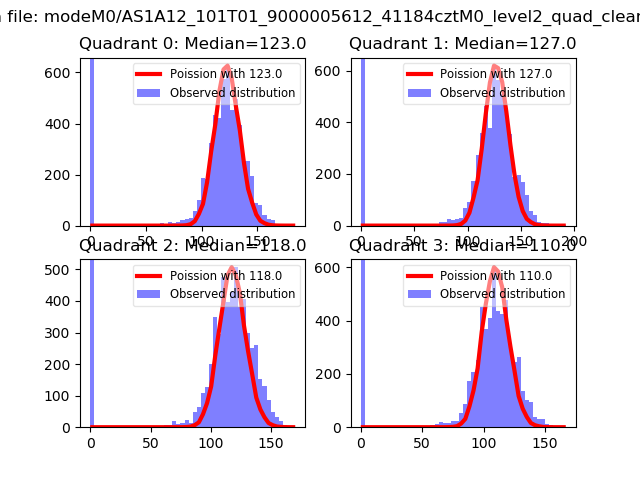 |
 |
| Quadrant-wise count rates Data is divided into 100 sec bins |
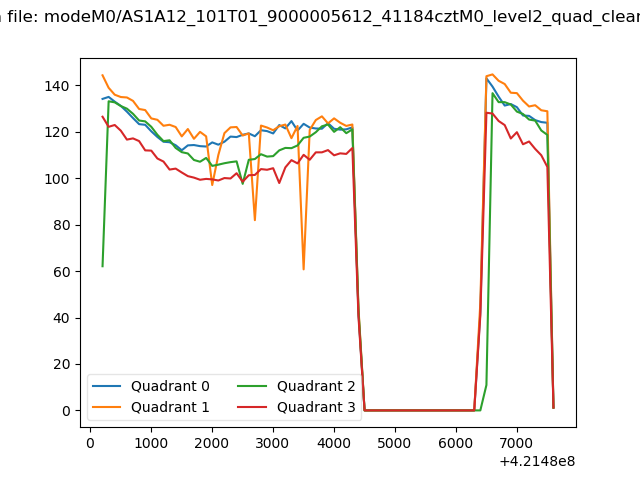 |
|
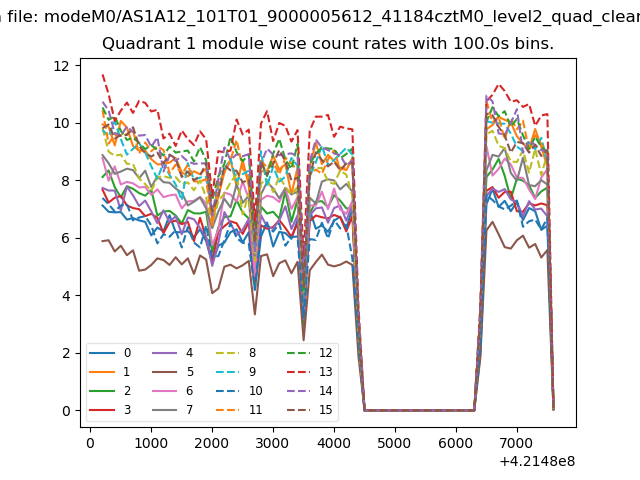
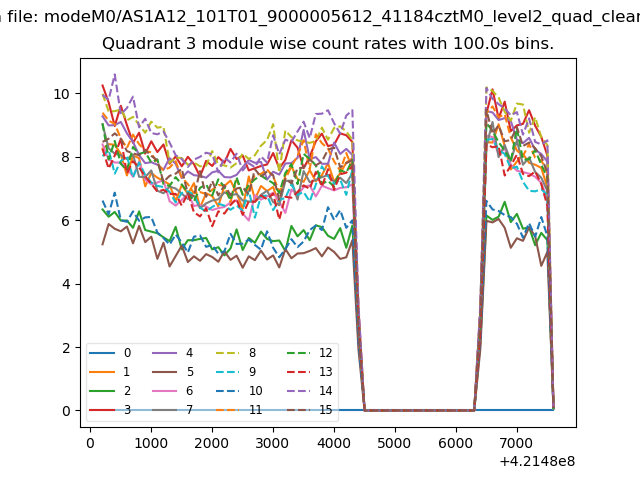
| Module-wise count rates for Quadrant A Data is divided into 100 sec bins |
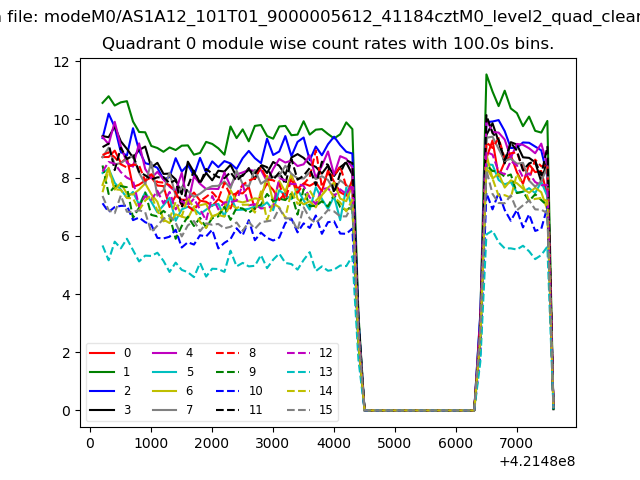 |
 |
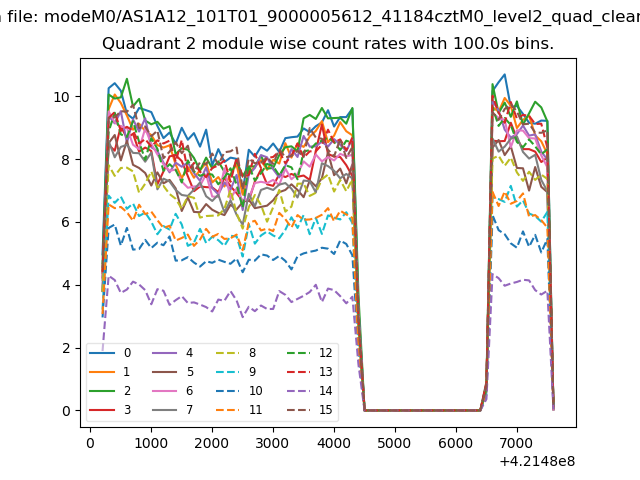
| Module-wise count rates for Quadrant B Data is divided into 100 sec bins |
 |
 |
| Module-wise count rates for Quadrant C Data is divided into 100 sec bins |
 |
 |
| Module-wise count rates for Quadrant D Data is divided into 100 sec bins |
 |
 |
| Parameter | Plot |
|---|---|
| CZT HV Monitor | 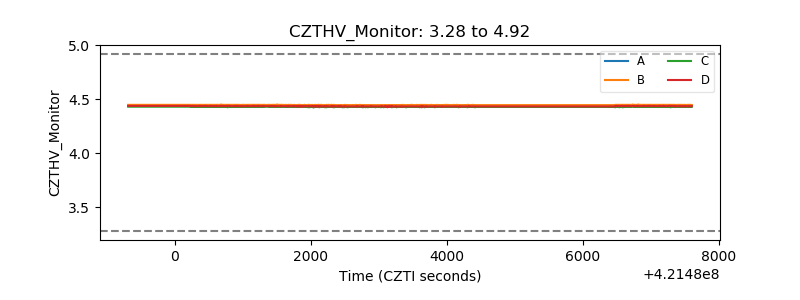 |
| D_VDD | 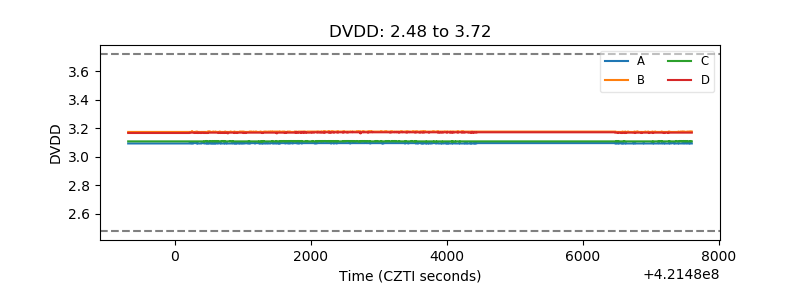 |
| Temperature 1 | 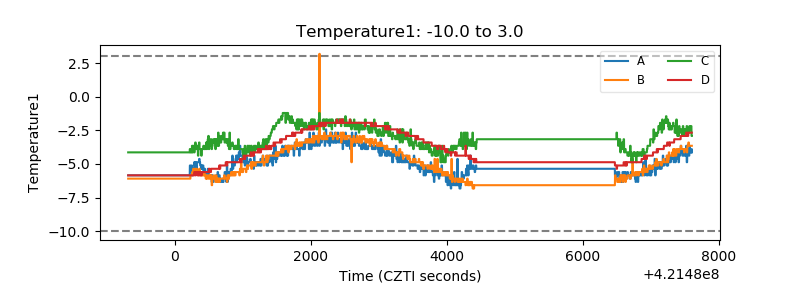 |
| Veto HV Monitor | 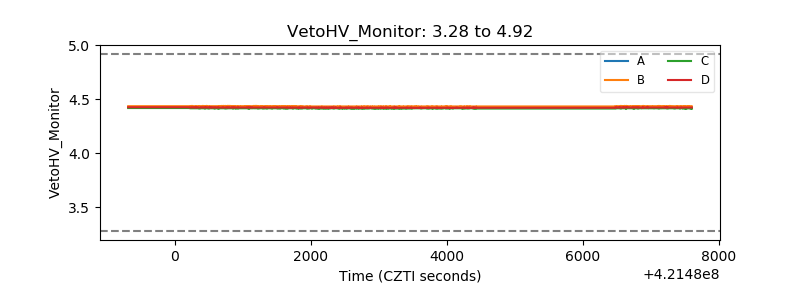 |
| Veto LLD | 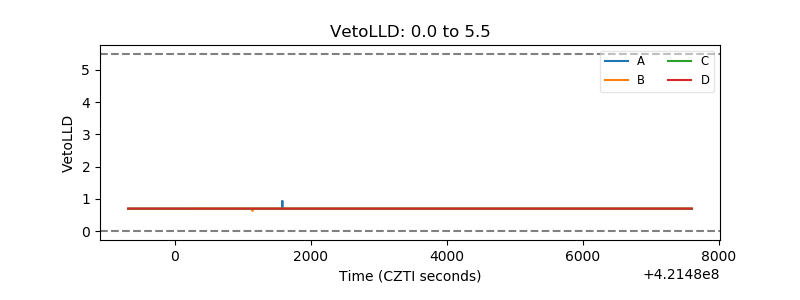 |
| Alpha Counter | 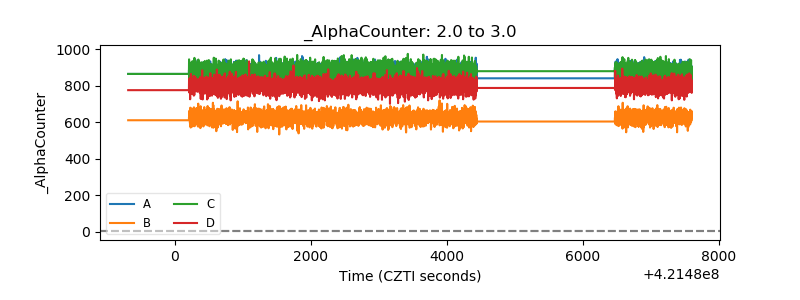 |
| _CPM_Rate | 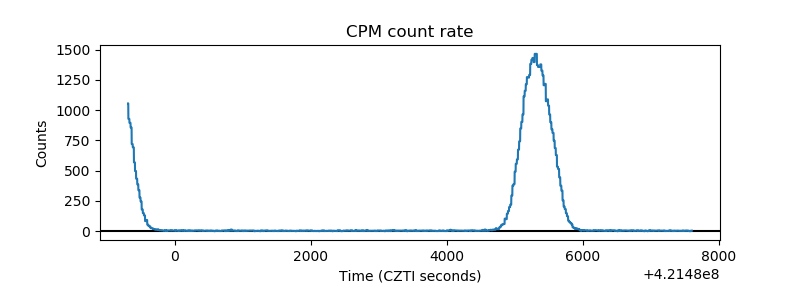 |
| CZT Counter | 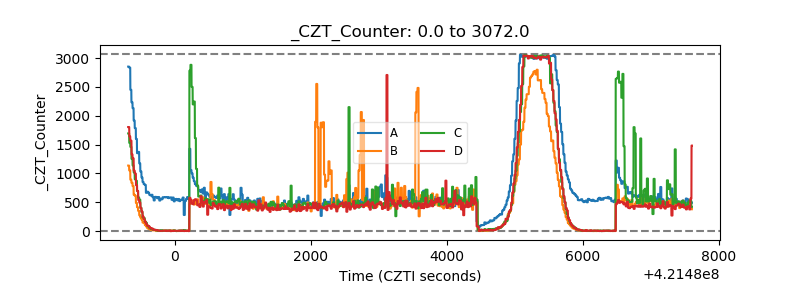 |
| +2.5 Volts monitor | 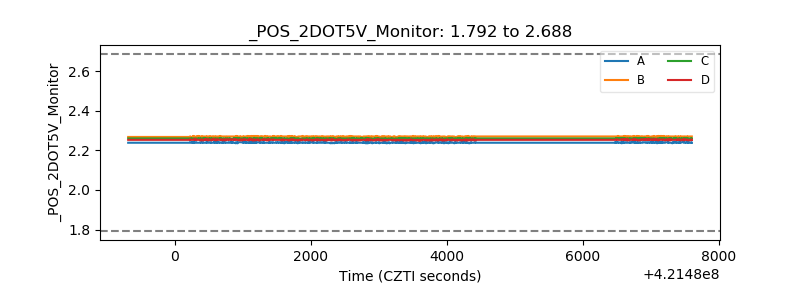 |
| +5 Volts monitor | 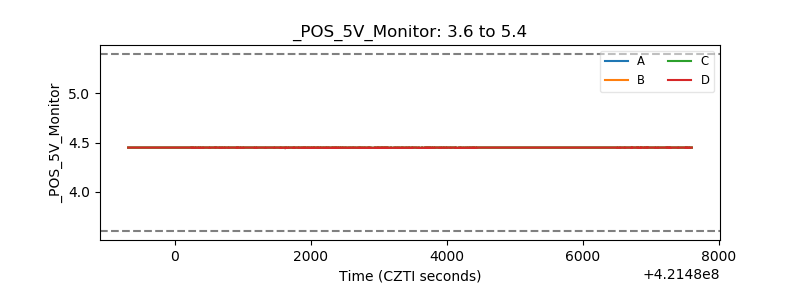 |
| _ROLL_ROT | 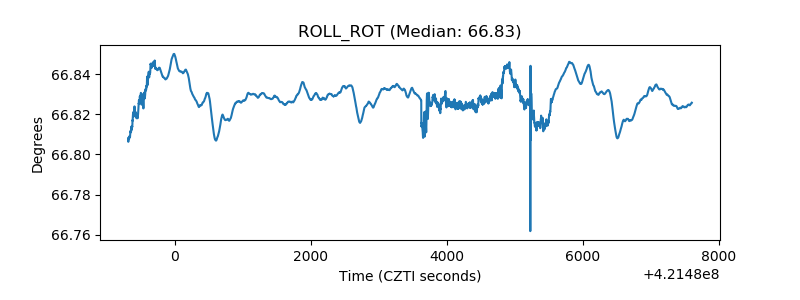 |
| _Roll_DEC | 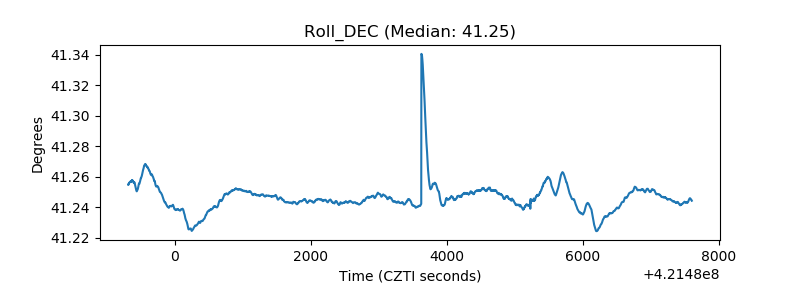 |
| _Roll_RA | 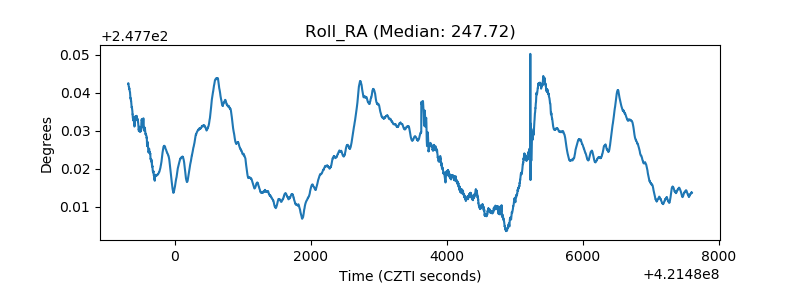 |
| Veto Counter | 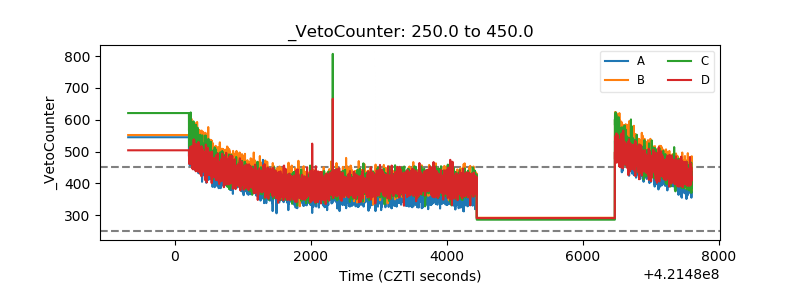 |