| Param | Original file | Final file |
|---|---|---|
| Filename | modeM0/AS1A12_101T01_9000005612_41185cztM0_level2.fits | modeM0/AS1A12_101T01_9000005612_41185cztM0_level2_quad_clean.evt |
| Size (bytes) | 327,444,480 | 93,879,360 |
| Size | 312.3 MB | 89.5 MB |
| Events in quadrant A | 2,894,759 | 650,229 |
| Events in quadrant B | 2,477,279 | 669,695 |
| Events in quadrant C | 3,311,523 | 593,083 |
| Events in quadrant D | 3,033,199 | 566,758 |
| Mode M9 | |||
|---|---|---|---|
| Quadrant | BADHDUFLAG | Total packets | Discarded packets |
| A | 0 | 26 | 0 |
| B | 0 | 26 | 0 |
| C | 0 | 26 | 0 |
| D | 0 | 27 | 0 |
| Mode M0 | |||
|---|---|---|---|
| Quadrant | BADHDUFLAG | Total packets | Discarded packets |
| A | 0 | 11552 | 3 |
| B | 0 | 10680 | 2 |
| C | 0 | 12958 | 2 |
| D | 0 | 12551 | 2 |
| Mode SS | |||
|---|---|---|---|
| Quadrant | BADHDUFLAG | Total packets | Discarded packets |
| A | 0 | 106 | 0 |
| B | 0 | 106 | 0 |
| C | 0 | 106 | 0 |
| D | 0 | 106 | 0 |
| Quadrant | Total seconds | Saturated seconds | Saturation percentage |
|---|---|---|---|
| A | 5185 | 13 | 0.250723% |
| B | 5185 | 9 | 0.173578% |
| C | 5185 | 242 | 4.667310% |
| D | 5185 | 146 | 2.815815% |
Noise dominated data is calculated using 1-second bins in cleaned event files. If a bin has >2000 counts, and if more than 50% of those come from <1% of pixels, then it is considered to be noise-dominated and hence unusable.
| Quadrant | # 1 sec bins | Bins with >0 counts | Bins with >2000 counts | High rate bins dominated by noise | Noise dominated (total time) | Noise dominated (detector-on time) | Marked lightcurve |
|---|---|---|---|---|---|---|---|
| A | 7308 | 5186 | 2 | 2 | 0.03% | 0.04% | 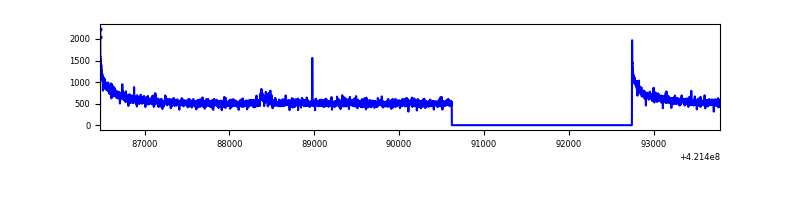 |
| B | 7308 | 5186 | 5 | 5 | 0.07% | 0.10% | 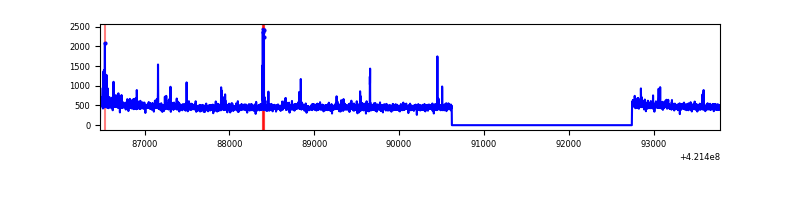 |
| C | 7308 | 5186 | 245 | 245 | 3.35% | 4.72% | 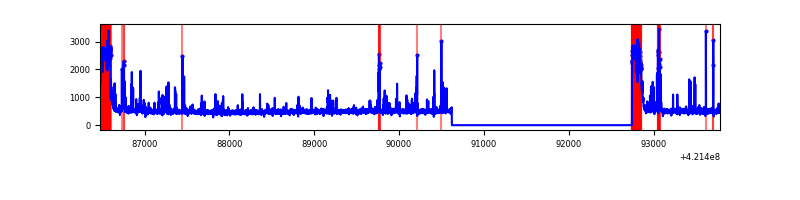 |
| D | 7308 | 5186 | 101 | 101 | 1.38% | 1.95% | 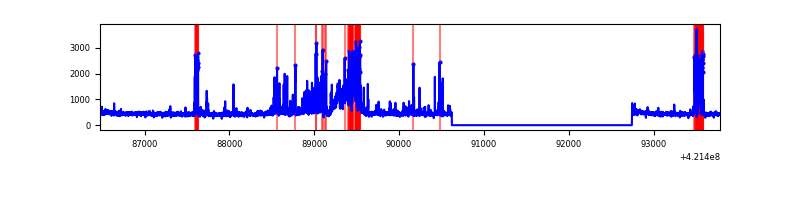 |
Top three noisy pixels from each quadrant. If the there are fewer than three noisy pixels in the level2.evt file, extra rows are filled as -1
| Pixel properties | Quadrant properties | ||||||
|---|---|---|---|---|---|---|---|
| Quadrant | DetID | PixID | Counts | Sigma | Mean | Median | Sigma |
| A | 10 | 83 | 489501 | 3971.3 | 610 | 600 | 123.1 |
| A | 12 | 189 | 31030 | 247.18 | 610 | 600 | 123.1 |
| A | 13 | 6 | 7987 | 60.0 | 610 | 600 | 123.1 |
| B | 0 | 190 | 51135 | 442.36 | 601 | 585 | 114.3 |
| B | 5 | 255 | 40804 | 351.95 | 601 | 585 | 114.3 |
| B | 0 | 229 | 30573 | 262.42 | 601 | 585 | 114.3 |
| C | 0 | 10 | 503737 | 3887.45 | 567 | 572 | 129.4 |
| C | 9 | 54 | 308698 | 2380.58 | 567 | 572 | 129.4 |
| C | 15 | 214 | 222725 | 1716.35 | 567 | 572 | 129.4 |
| D | 13 | 249 | 561977 | 4036.71 | 580 | 563 | 139.1 |
| D | 2 | 249 | 197948 | 1419.25 | 580 | 563 | 139.1 |
| D | 2 | 120 | 41979 | 297.79 | 580 | 563 | 139.1 |
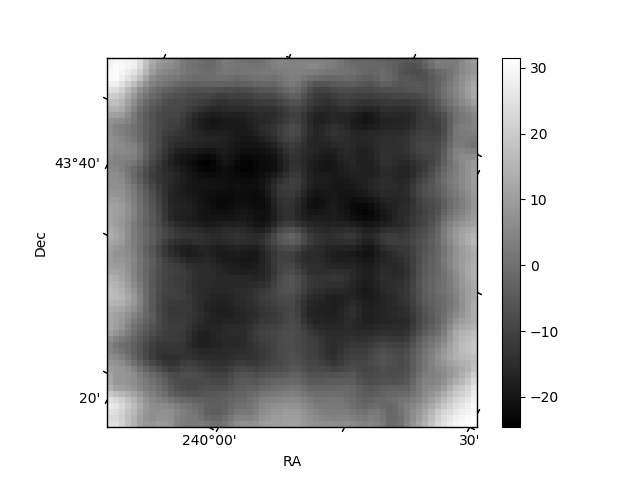
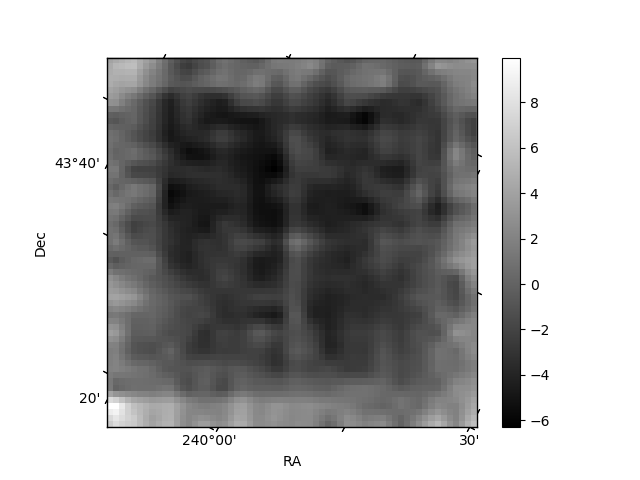
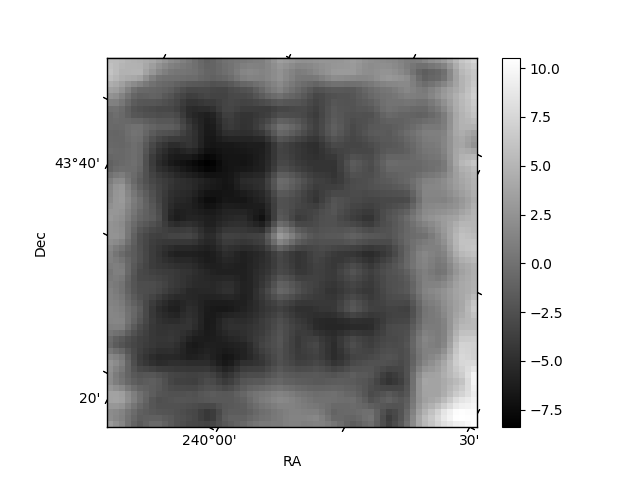
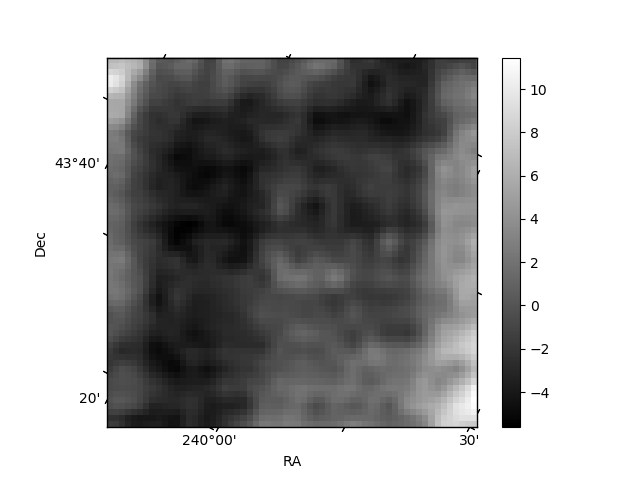
Histogram calculated using DETX and DETY for each event in the final _common_clean file
| Quadrant A | 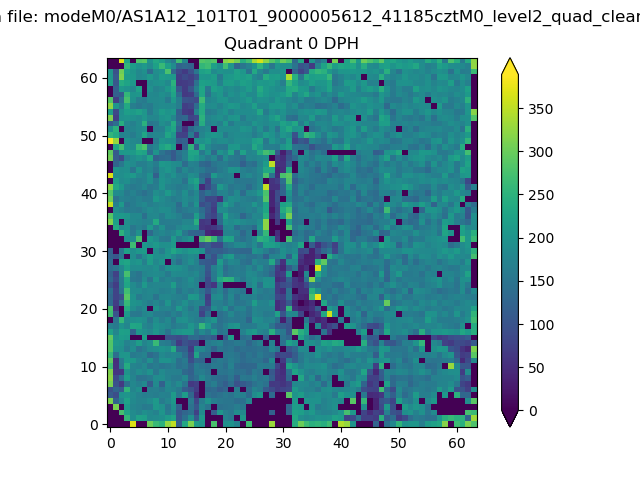 |
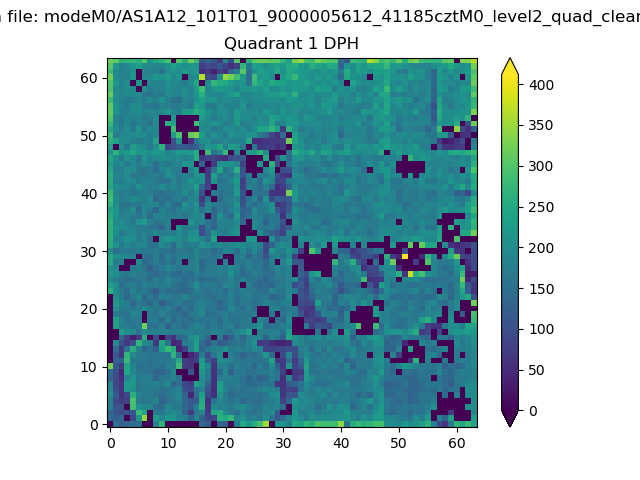 |
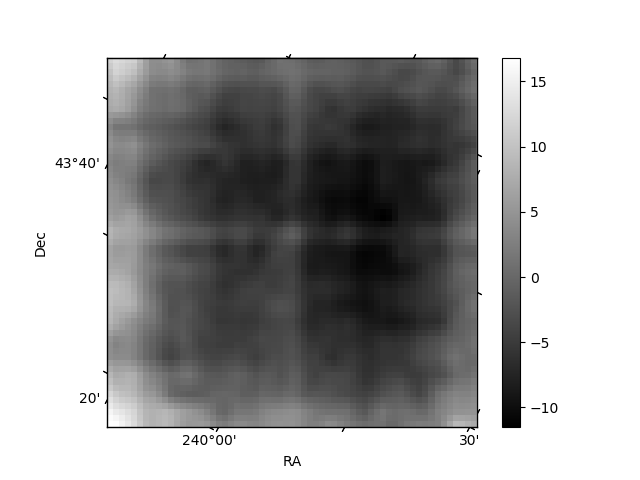
Quadrant B |
|---|---|---|---|
| Quadrant D | 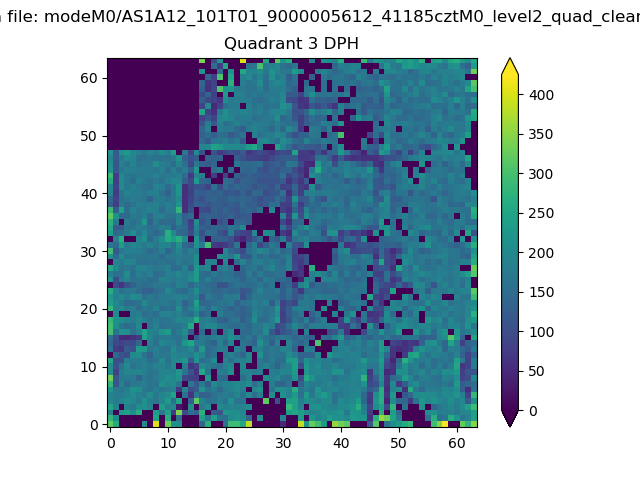 |
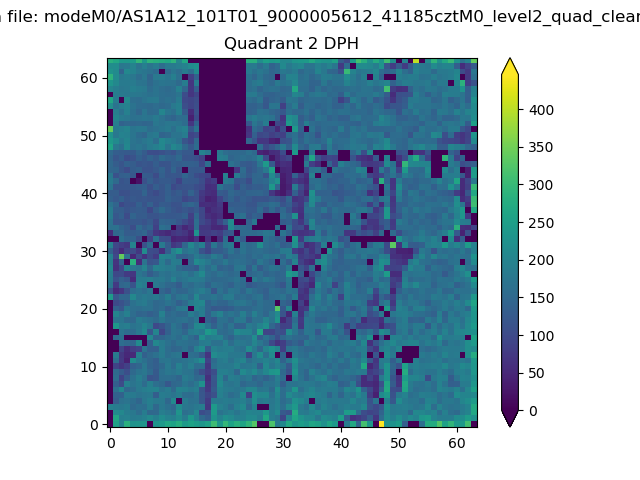 |
Quadrant C |
| Plot type | Count rate plots | Images |
|---|---|---|
| Comparison with Poisson distribution Blue bars denote a histogram of data divided into 1 sec bins. Red curve is a Poisson curve with rate = median count rate of data. |
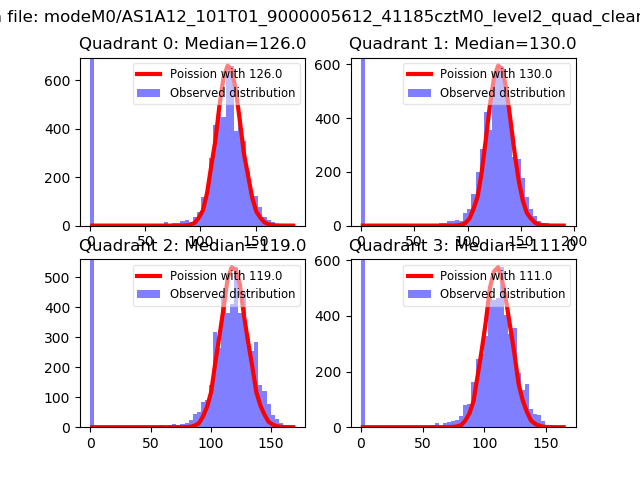 |
 |
| Quadrant-wise count rates Data is divided into 100 sec bins |
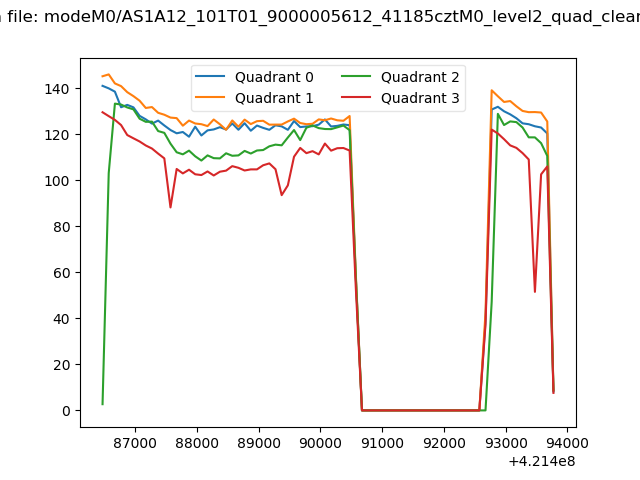 |
|
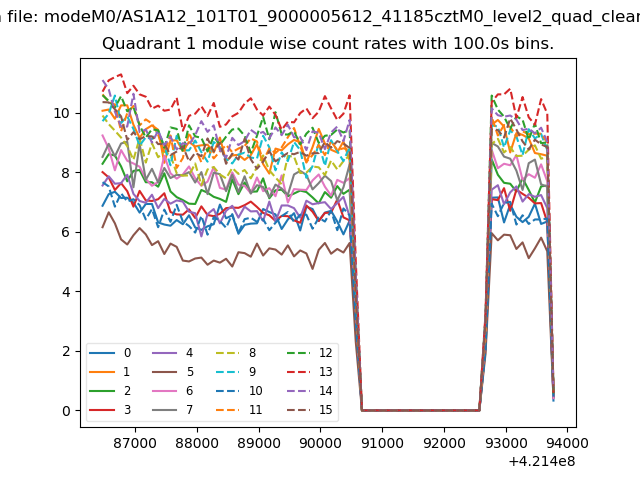
| Module-wise count rates for Quadrant A Data is divided into 100 sec bins |
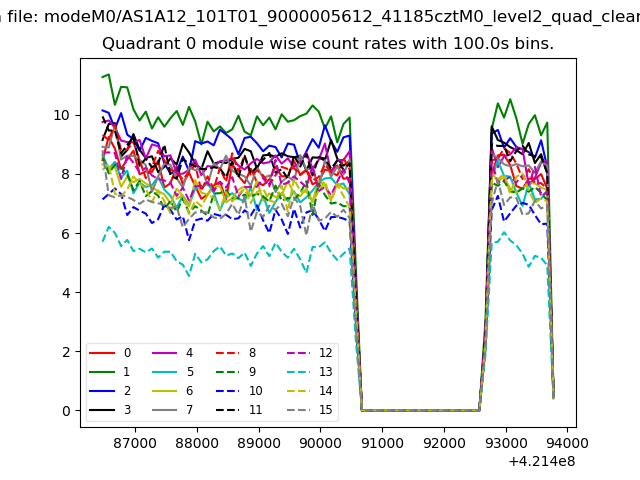 |
 |
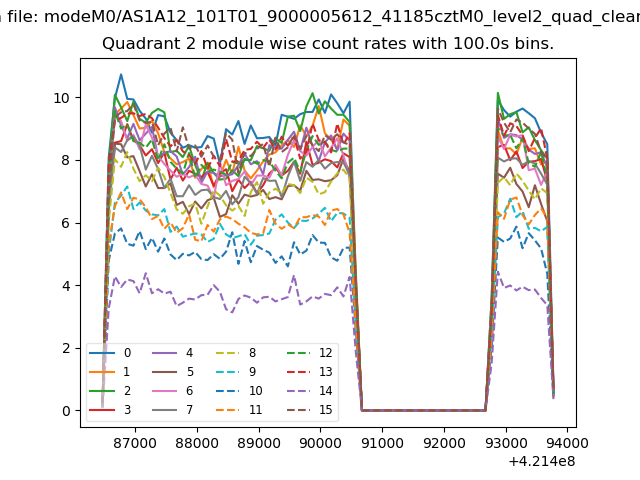
| Module-wise count rates for Quadrant B Data is divided into 100 sec bins |
 |
 |
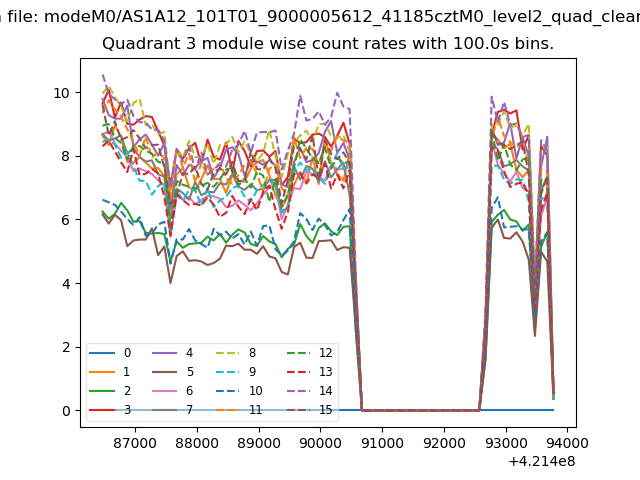
| Module-wise count rates for Quadrant C Data is divided into 100 sec bins |
 |
 |
| Module-wise count rates for Quadrant D Data is divided into 100 sec bins |
 |
 |
| Parameter | Plot |
|---|---|
| CZT HV Monitor | 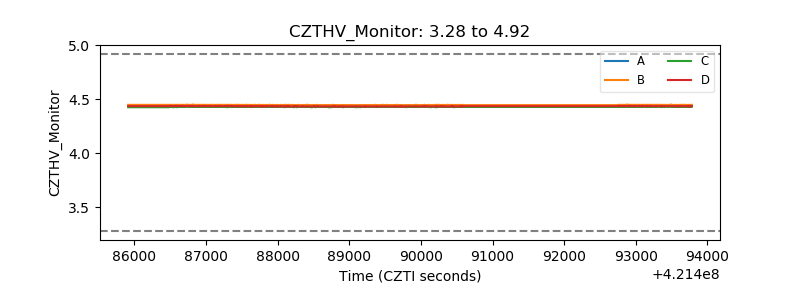 |
| D_VDD | 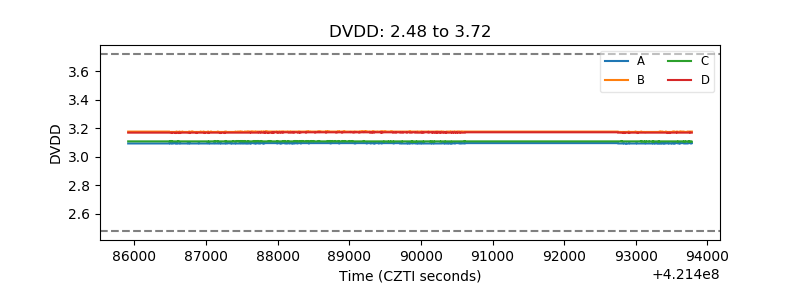 |
| Temperature 1 | 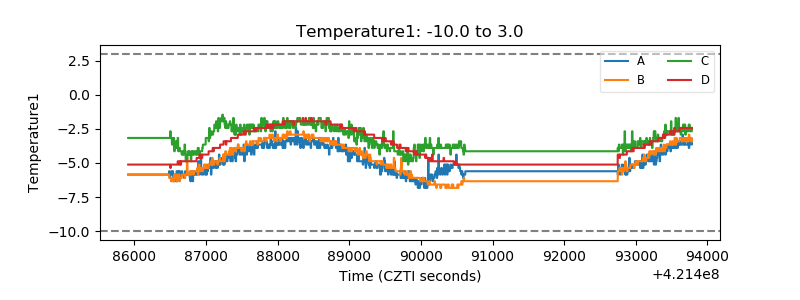 |
| Veto HV Monitor | 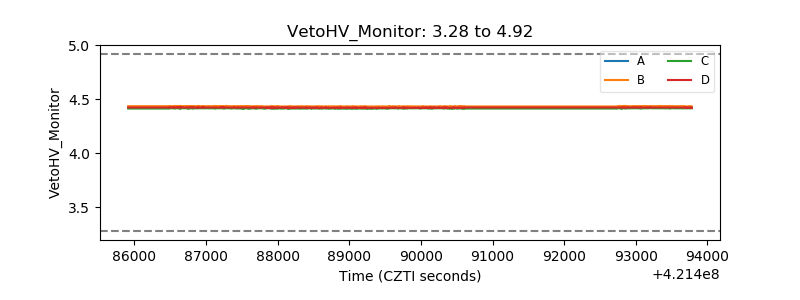 |
| Veto LLD | 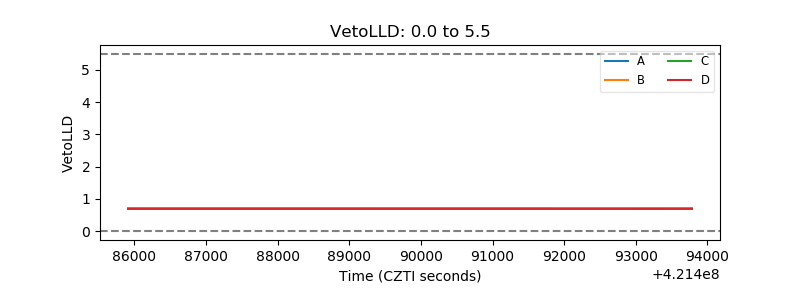 |
| Alpha Counter | 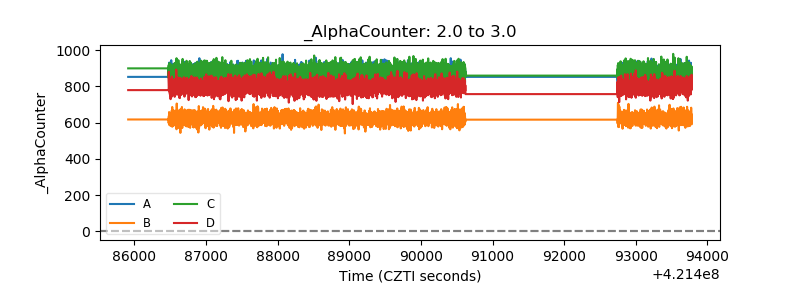 |
| _CPM_Rate | 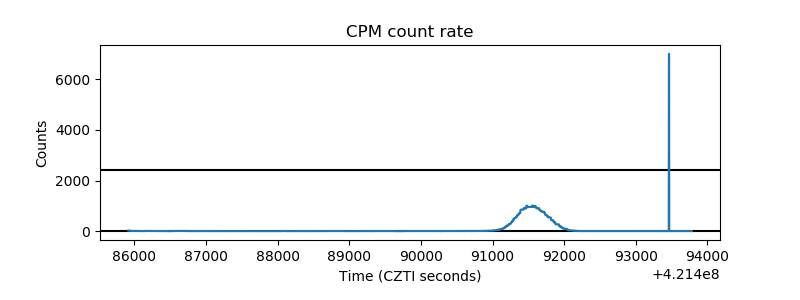 |
| CZT Counter | 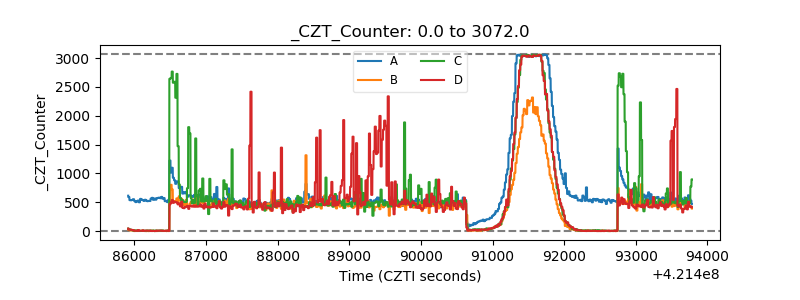 |
| +2.5 Volts monitor | 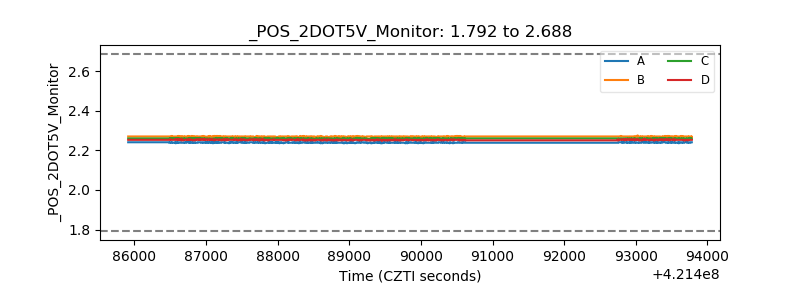 |
| +5 Volts monitor | 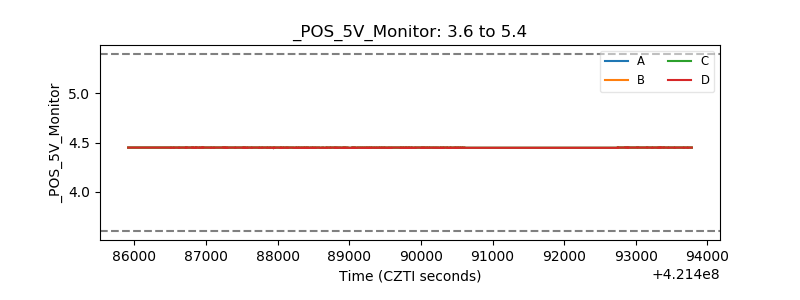 |
| _ROLL_ROT | 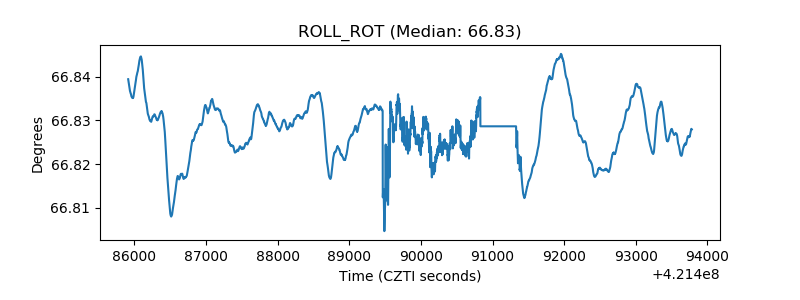 |
| _Roll_DEC | 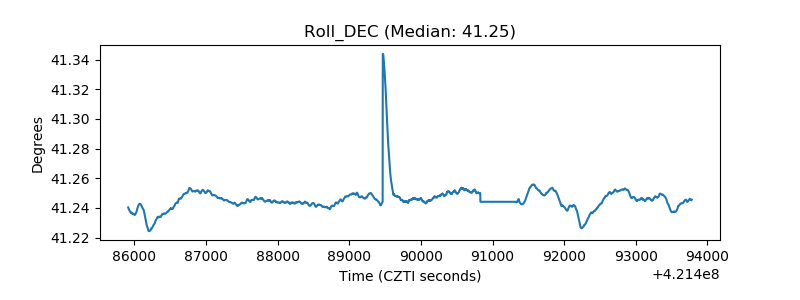 |
| _Roll_RA | 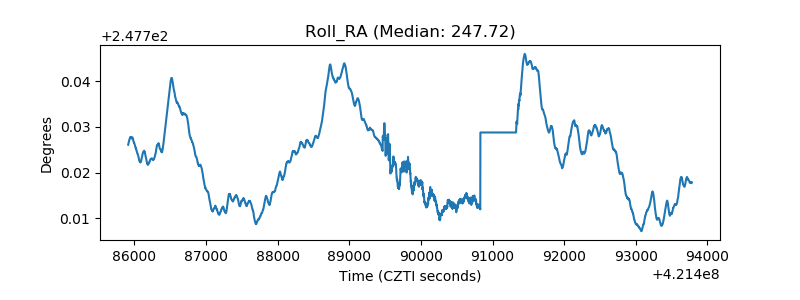 |
| Veto Counter | 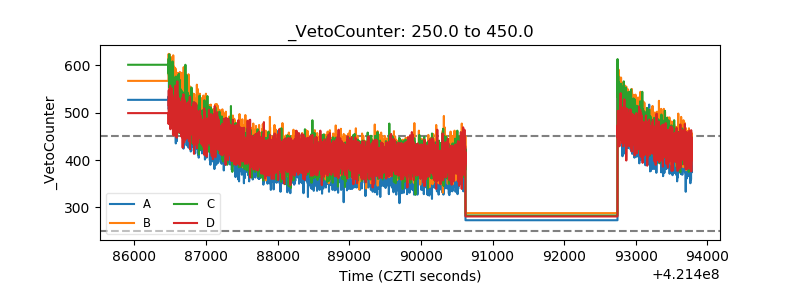 |