| Param | Original file | Final file |
|---|---|---|
| Filename | modeM0/AS1A12_101T01_9000005612_41186cztM0_level2.fits | modeM0/AS1A12_101T01_9000005612_41186cztM0_level2_quad_clean.evt |
| Size (bytes) | 246,173,760 | 45,915,840 |
| Size | 234.8 MB | 43.8 MB |
| Events in quadrant A | 1,612,171 | 352,775 |
| Events in quadrant B | 3,791,682 | 218,130 |
| Events in quadrant C | 2,019,479 | 315,489 |
| Events in quadrant D | 1,465,251 | 300,832 |
| Mode M9 | |||
|---|---|---|---|
| Quadrant | BADHDUFLAG | Total packets | Discarded packets |
| A | 0 | 13 | 0 |
| B | 0 | 13 | 0 |
| C | 0 | 13 | 0 |
| D | 0 | 14 | 0 |
| Mode M0 | |||
|---|---|---|---|
| Quadrant | BADHDUFLAG | Total packets | Discarded packets |
| A | 0 | 6458 | 1 |
| B | 0 | 13094 | 1 |
| C | 0 | 7764 | 1 |
| D | 0 | 6348 | 1 |
| Mode SS | |||
|---|---|---|---|
| Quadrant | BADHDUFLAG | Total packets | Discarded packets |
| A | 0 | 56 | 0 |
| B | 0 | 56 | 0 |
| C | 0 | 56 | 0 |
| D | 0 | 56 | 0 |
| Quadrant | Total seconds | Saturated seconds | Saturation percentage |
|---|---|---|---|
| A | 2851 | 6 | 0.210452% |
| B | 2851 | 1165 | 40.862855% |
| C | 2851 | 163 | 5.717292% |
| D | 2851 | 88 | 3.086636% |
Noise dominated data is calculated using 1-second bins in cleaned event files. If a bin has >2000 counts, and if more than 50% of those come from <1% of pixels, then it is considered to be noise-dominated and hence unusable.
| Quadrant | # 1 sec bins | Bins with >0 counts | Bins with >2000 counts | High rate bins dominated by noise | Noise dominated (total time) | Noise dominated (detector-on time) | Marked lightcurve |
|---|---|---|---|---|---|---|---|
| A | 2851 | 2851 | 0 | 0 | 0.00% | 0.00% | 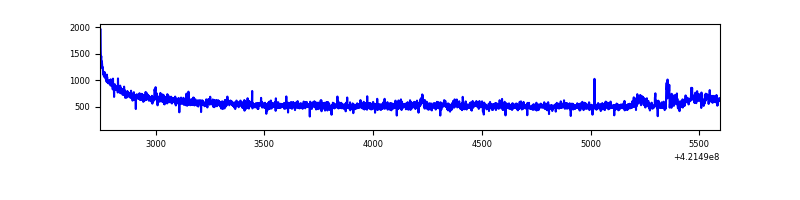 |
| B | 2851 | 2851 | 1145 | 1145 | 40.16% | 40.16% | 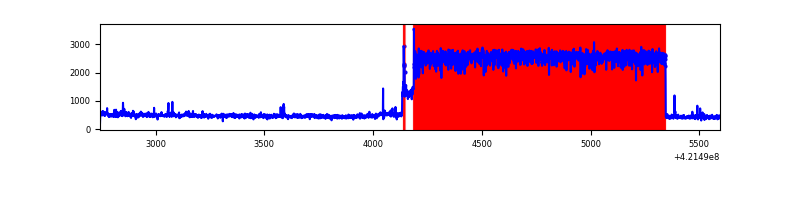 |
| C | 2851 | 2851 | 153 | 153 | 5.37% | 5.37% |  |
| D | 2851 | 2851 | 63 | 63 | 2.21% | 2.21% | 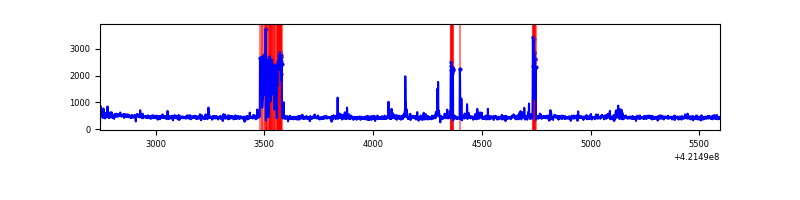 |
Top three noisy pixels from each quadrant. If the there are fewer than three noisy pixels in the level2.evt file, extra rows are filled as -1
| Pixel properties | Quadrant properties | ||||||
|---|---|---|---|---|---|---|---|
| Quadrant | DetID | PixID | Counts | Sigma | Mean | Median | Sigma |
| A | 10 | 83 | 261755 | 3844.28 | 331 | 326 | 68.0 |
| A | 12 | 189 | 61584 | 900.79 | 331 | 326 | 68.0 |
| A | 13 | 254 | 5061 | 69.63 | 331 | 326 | 68.0 |
| B | 7 | 202 | 2706445 | 52006.1 | 263 | 257 | 52.0 |
| B | 5 | 255 | 34490 | 657.87 | 263 | 257 | 52.0 |
| B | 0 | 190 | 8771 | 163.62 | 263 | 257 | 52.0 |
| C | 9 | 54 | 354513 | 4944.4 | 306 | 308 | 71.6 |
| C | 0 | 10 | 265742 | 3705.23 | 306 | 308 | 71.6 |
| C | 15 | 214 | 121765 | 1695.44 | 306 | 308 | 71.6 |
| D | 13 | 249 | 160981 | 2101.02 | 314 | 306 | 76.5 |
| D | 2 | 249 | 73464 | 956.63 | 314 | 306 | 76.5 |
| D | 2 | 120 | 17826 | 229.1 | 314 | 306 | 76.5 |
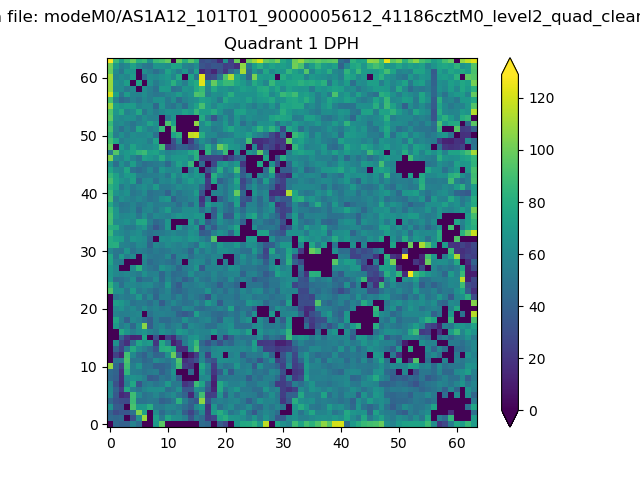
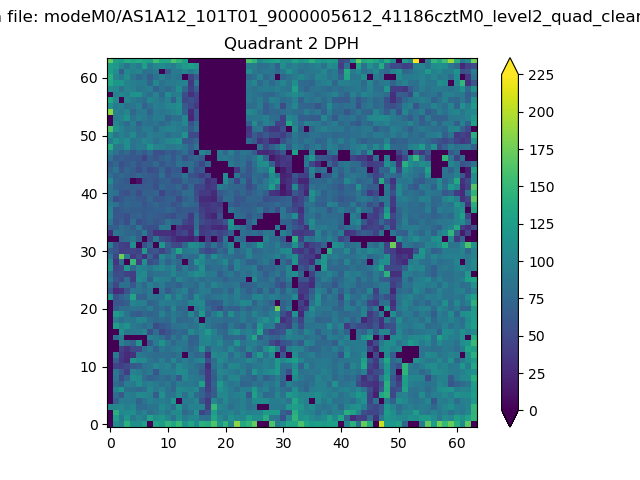
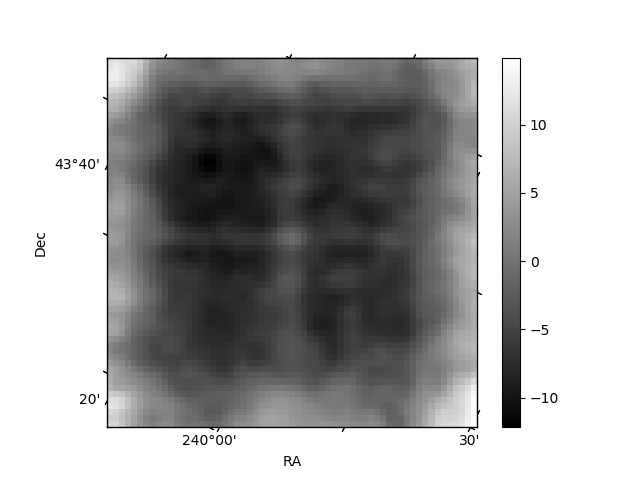
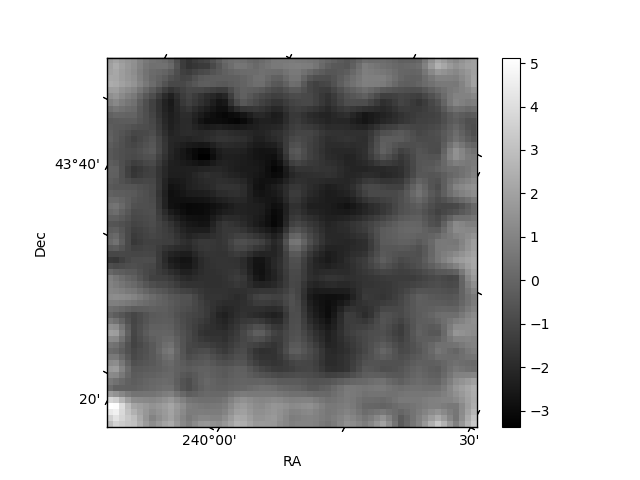
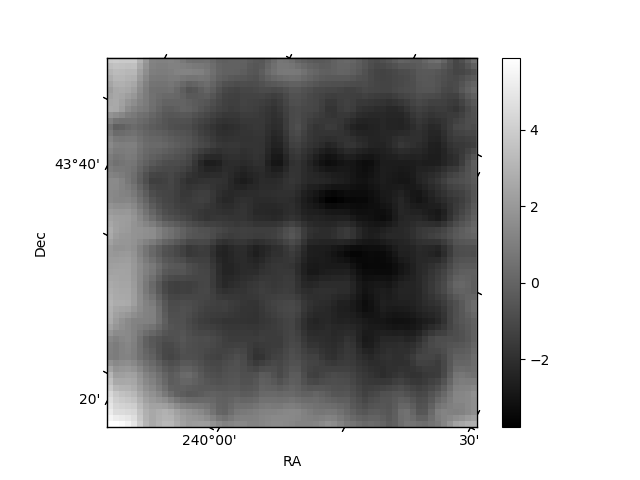
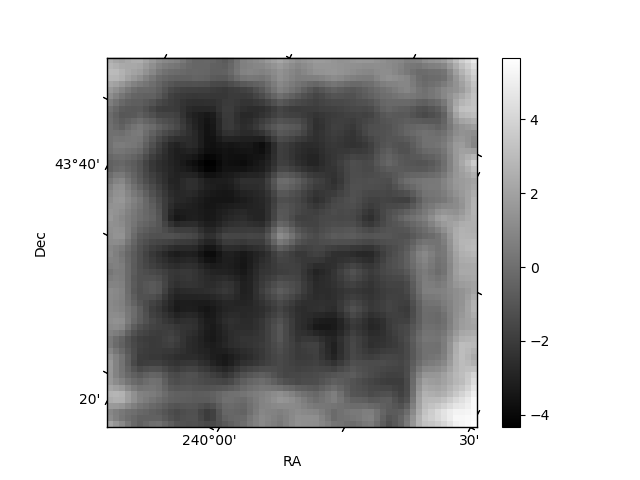
Histogram calculated using DETX and DETY for each event in the final _common_clean file
| Quadrant A | 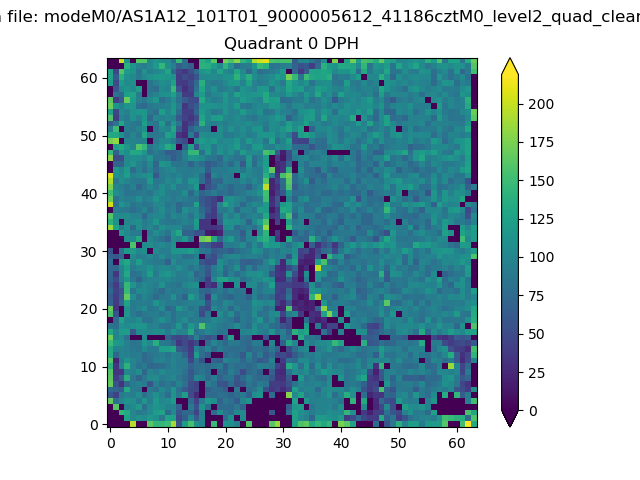 |
 |
Quadrant B |
|---|---|---|---|
| Quadrant D | 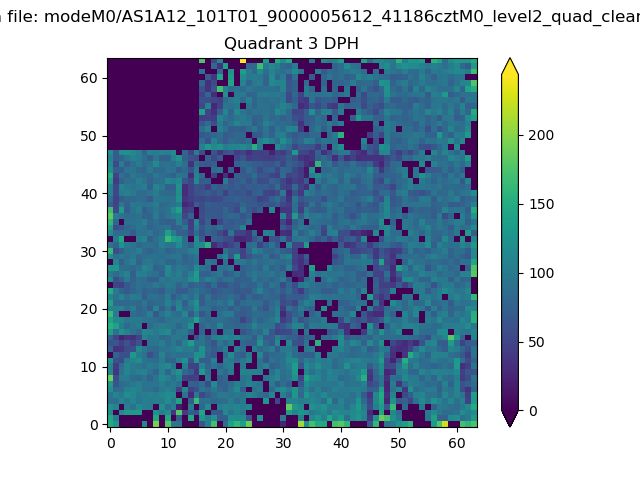 |
 |
Quadrant C |
| Plot type | Count rate plots | Images |
|---|---|---|
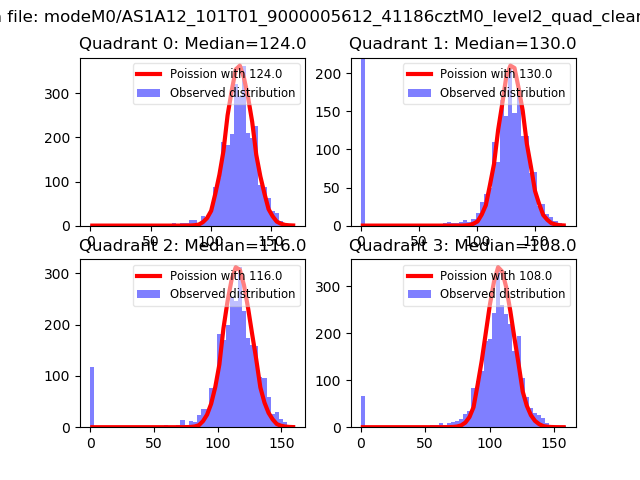
| Comparison with Poisson distribution Blue bars denote a histogram of data divided into 1 sec bins. Red curve is a Poisson curve with rate = median count rate of data. |
 |
 |
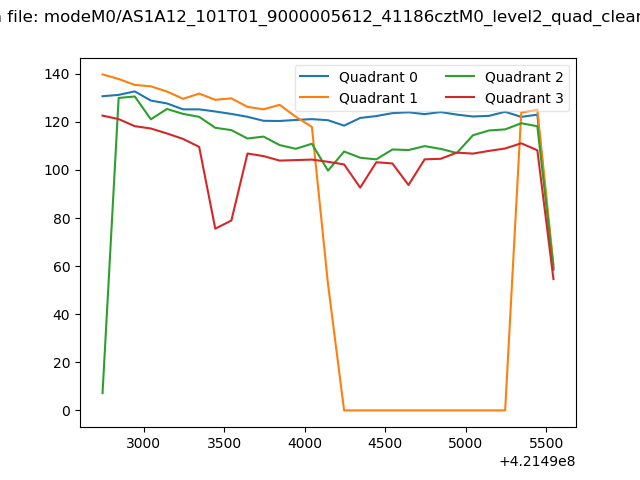
| Quadrant-wise count rates Data is divided into 100 sec bins |
 |
|
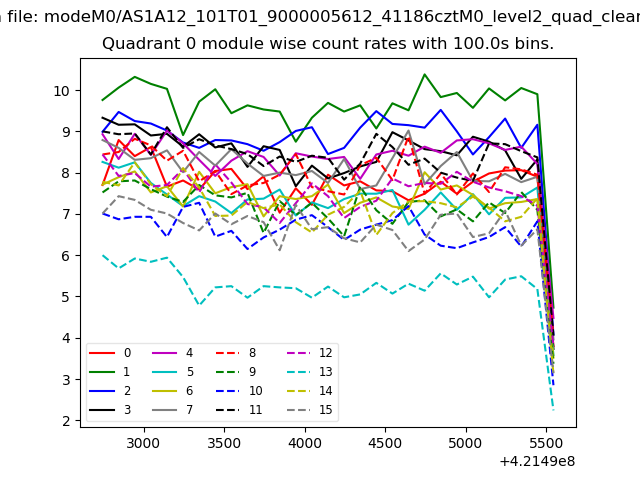
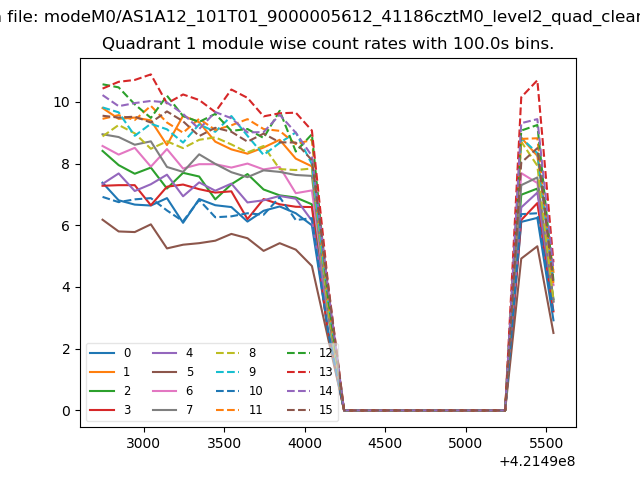
| Module-wise count rates for Quadrant A Data is divided into 100 sec bins |
 |
 |
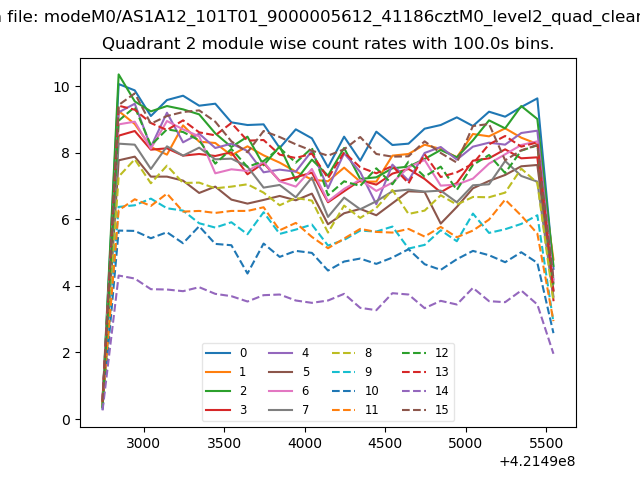
| Module-wise count rates for Quadrant B Data is divided into 100 sec bins |
 |
 |
| Module-wise count rates for Quadrant C Data is divided into 100 sec bins |
 |
 |
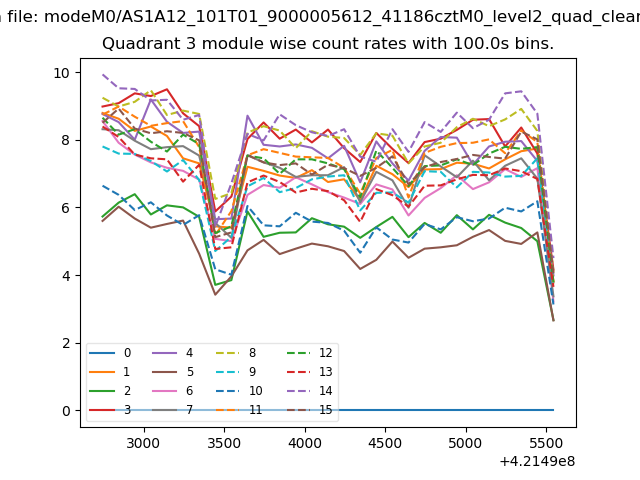
| Module-wise count rates for Quadrant D Data is divided into 100 sec bins |
 |
 |
| Parameter | Plot |
|---|---|
| CZT HV Monitor | 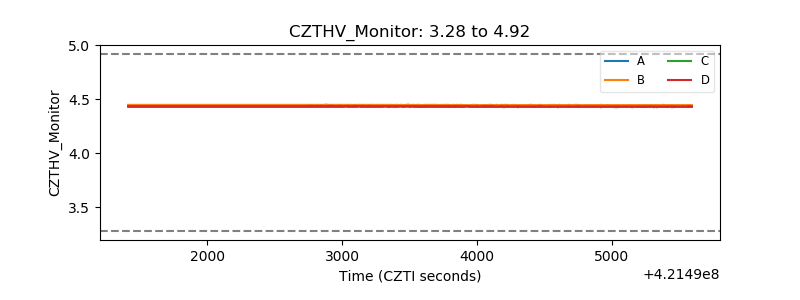 |
| D_VDD | 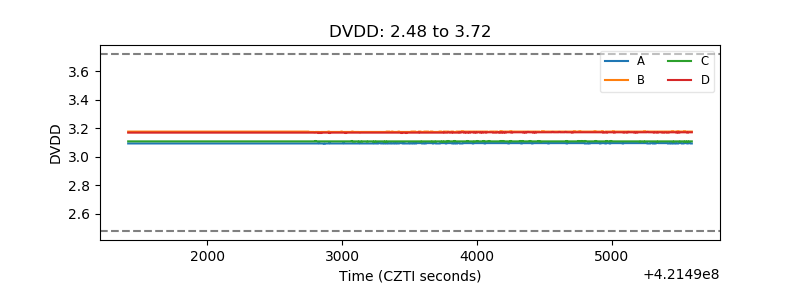 |
| Temperature 1 | 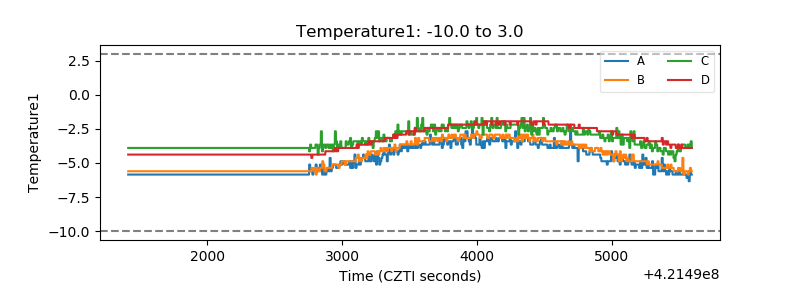 |
| Veto HV Monitor | 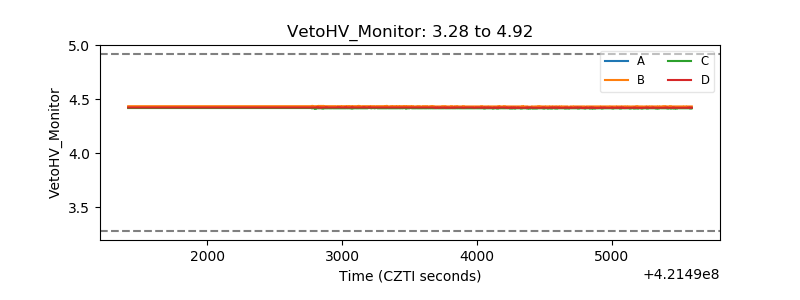 |
| Veto LLD | 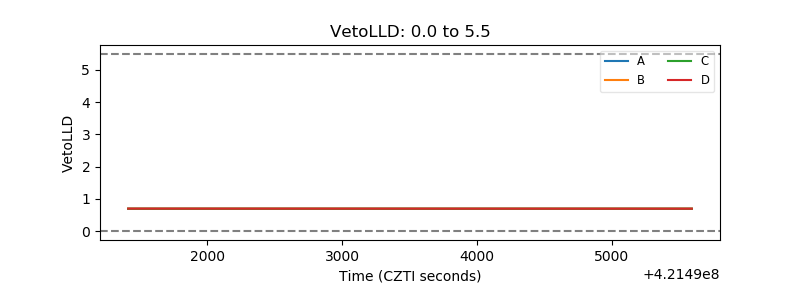 |
| Alpha Counter | 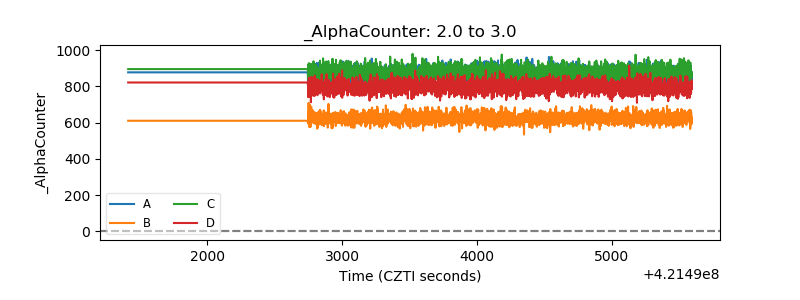 |
| _CPM_Rate | 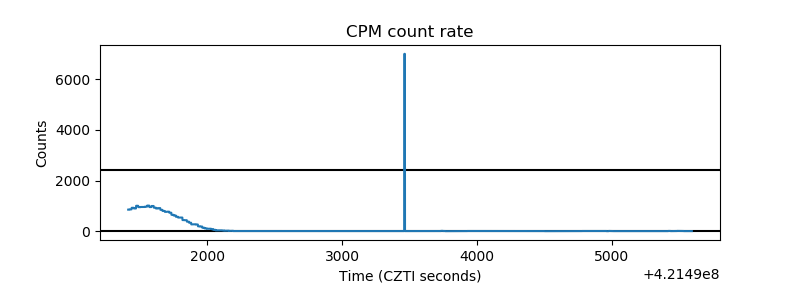 |
| CZT Counter | 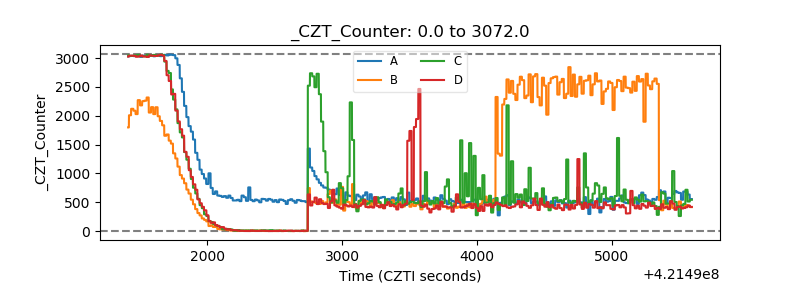 |
| +2.5 Volts monitor | 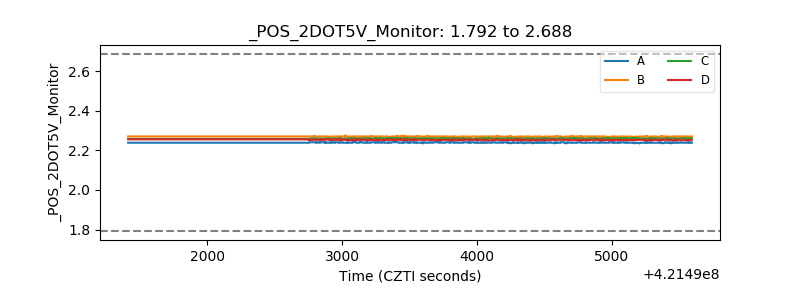 |
| +5 Volts monitor | 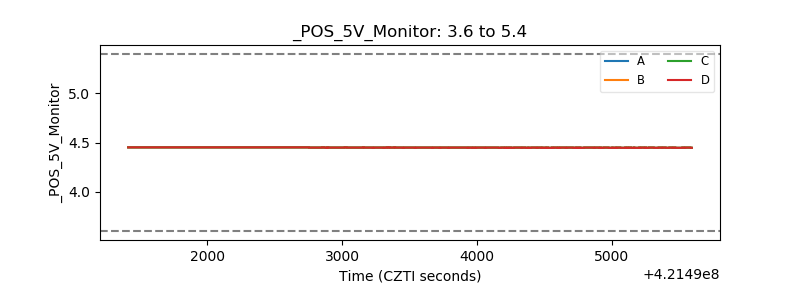 |
| _ROLL_ROT | 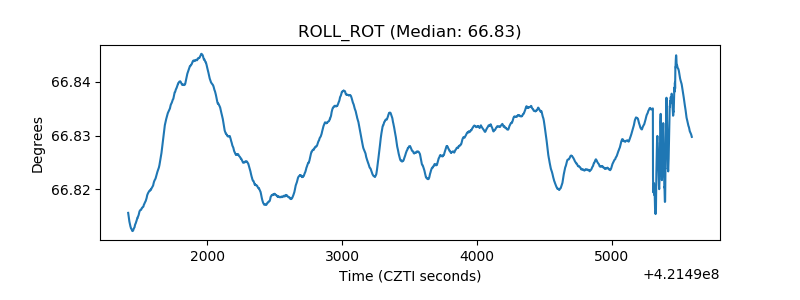 |
| _Roll_DEC | 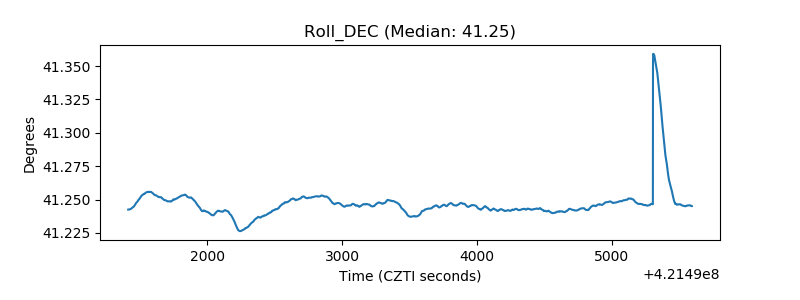 |
| _Roll_RA | 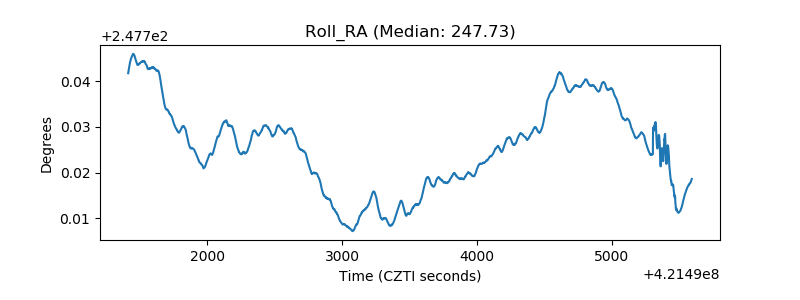 |
| Veto Counter | 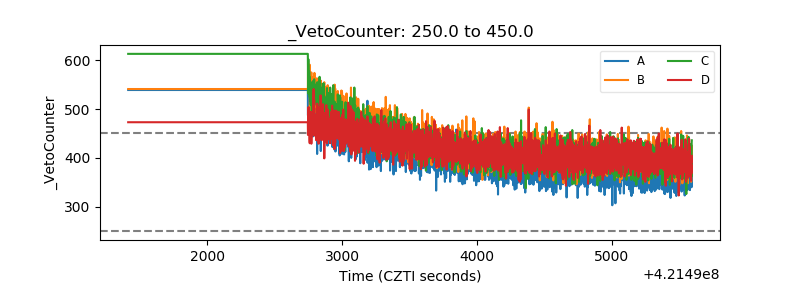 |