| Param | Original file | Final file |
|---|---|---|
| Filename | modeM0/AS1A12_101T04_9000005610_41165cztM0_level2.fits | modeM0/AS1A12_101T04_9000005610_41165cztM0_level2_quad_clean.evt |
| Size (bytes) | 279,866,880 | 52,957,440 |
| Size | 266.9 MB | 50.5 MB |
| Events in quadrant A | 1,815,832 | 382,727 |
| Events in quadrant B | 1,903,073 | 380,637 |
| Events in quadrant C | 4,320,771 | 255,872 |
| Events in quadrant D | 2,051,042 | 340,725 |
| Mode M0 | |||
|---|---|---|---|
| Quadrant | BADHDUFLAG | Total packets | Discarded packets |
| A | 0 | 7492 | 2 |
| B | 0 | 8065 | 1 |
| C | 0 | 15037 | 1 |
| D | 0 | 8418 | 1 |
| Mode SS | |||
|---|---|---|---|
| Quadrant | BADHDUFLAG | Total packets | Discarded packets |
| A | 0 | 70 | 0 |
| B | 0 | 70 | 0 |
| C | 0 | 70 | 0 |
| D | 0 | 70 | 0 |
| Mode M9 | |||
|---|---|---|---|
| Quadrant | BADHDUFLAG | Total packets | Discarded packets |
| A | 0 | 16 | 0 |
| B | 0 | 16 | 0 |
| C | 0 | 16 | 0 |
| D | 0 | 16 | 0 |
| Quadrant | Total seconds | Saturated seconds | Saturation percentage |
|---|---|---|---|
| A | 3438 | 7 | 0.203607% |
| B | 3438 | 125 | 3.635835% |
| C | 3438 | 1105 | 32.140780% |
| D | 3438 | 37 | 1.076207% |
Noise dominated data is calculated using 1-second bins in cleaned event files. If a bin has >2000 counts, and if more than 50% of those come from <1% of pixels, then it is considered to be noise-dominated and hence unusable.
| Quadrant | # 1 sec bins | Bins with >0 counts | Bins with >2000 counts | High rate bins dominated by noise | Noise dominated (total time) | Noise dominated (detector-on time) | Marked lightcurve |
|---|---|---|---|---|---|---|---|
| A | 5021 | 3439 | 1 | 1 | 0.02% | 0.03% | 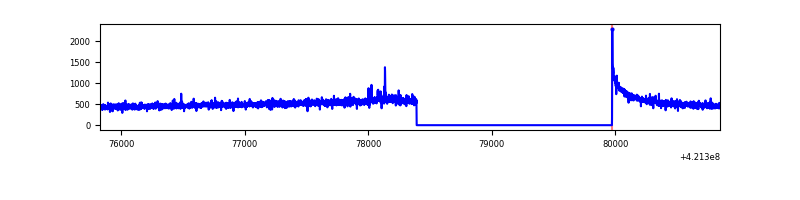 |
| B | 5021 | 3439 | 77 | 77 | 1.53% | 2.24% | 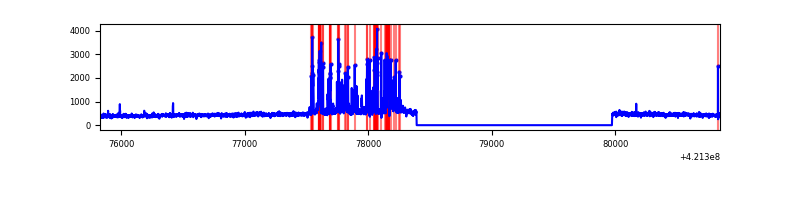 |
| C | 5021 | 3439 | 977 | 977 | 19.46% | 28.41% | 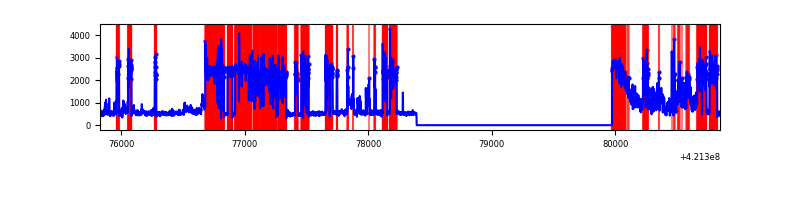 |
| D | 5021 | 3439 | 26 | 26 | 0.52% | 0.76% | 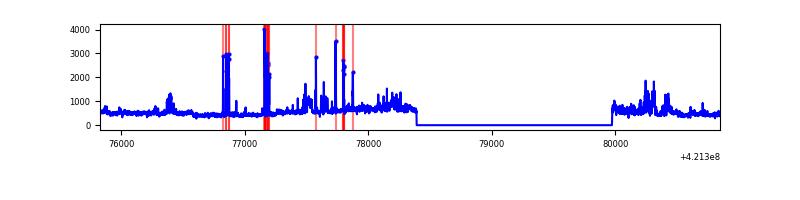 |
Top three noisy pixels from each quadrant. If the there are fewer than three noisy pixels in the level2.evt file, extra rows are filled as -1
| Pixel properties | Quadrant properties | ||||||
|---|---|---|---|---|---|---|---|
| Quadrant | DetID | PixID | Counts | Sigma | Mean | Median | Sigma |
| A | 10 | 83 | 300622 | 3711.35 | 386 | 376 | 80.9 |
| A | 7 | 3 | 10979 | 131.06 | 386 | 376 | 80.9 |
| A | 12 | 189 | 10043 | 119.49 | 386 | 376 | 80.9 |
| B | 0 | 245 | 333015 | 4446.87 | 375 | 365 | 74.8 |
| B | 5 | 255 | 54766 | 727.23 | 375 | 365 | 74.8 |
| B | 7 | 202 | 38603 | 511.17 | 375 | 365 | 74.8 |
| C | 9 | 54 | 2772894 | 38002.16 | 307 | 309 | 73.0 |
| C | 0 | 10 | 226324 | 3097.85 | 307 | 309 | 73.0 |
| C | 15 | 214 | 123323 | 1686.08 | 307 | 309 | 73.0 |
| D | 2 | 16 | 390079 | 4261.69 | 372 | 361 | 91.4 |
| D | 13 | 249 | 121111 | 1320.44 | 372 | 361 | 91.4 |
| D | 12 | 217 | 63447 | 689.87 | 372 | 361 | 91.4 |
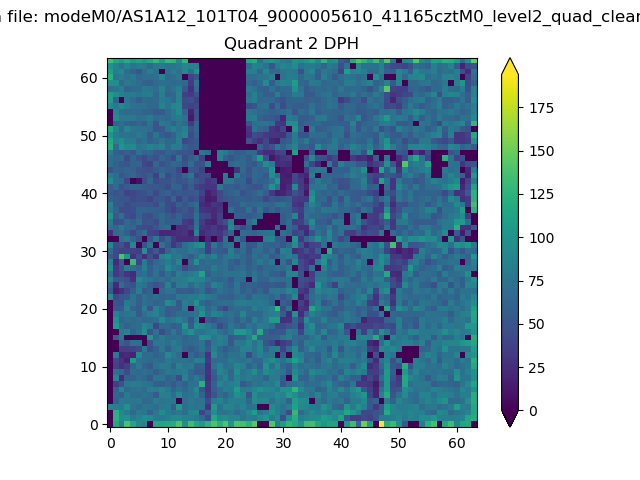
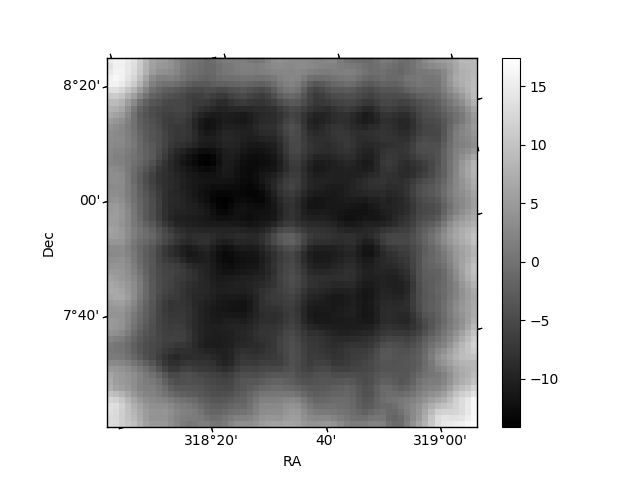
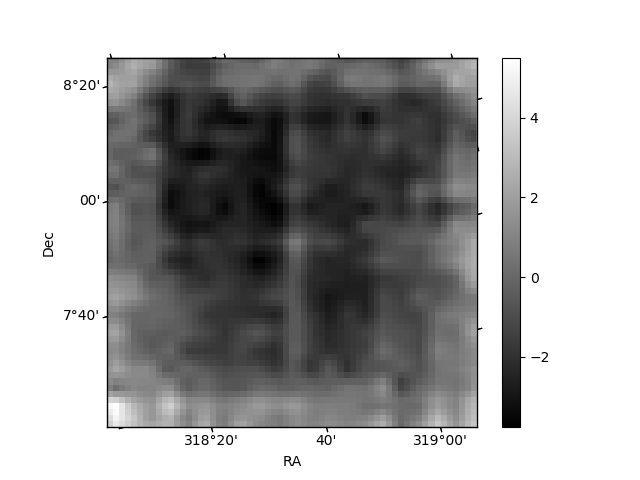
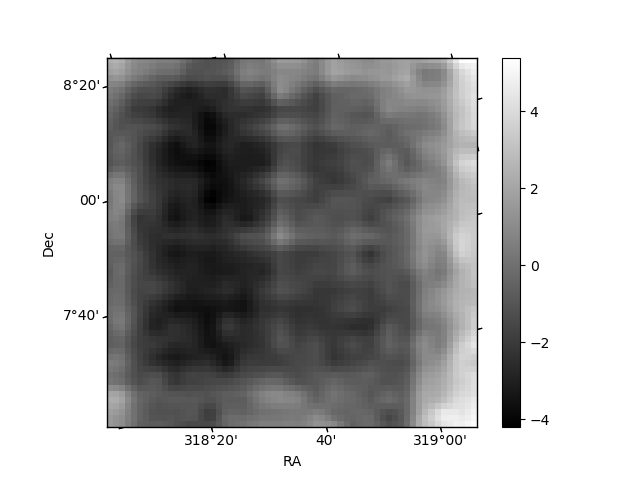
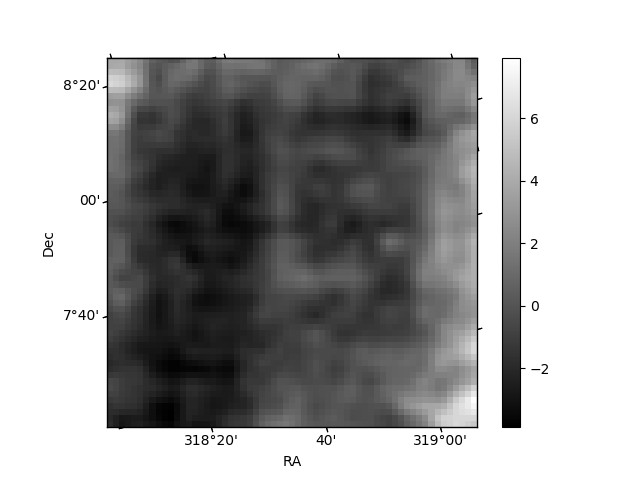
Histogram calculated using DETX and DETY for each event in the final _common_clean file
| Quadrant A | 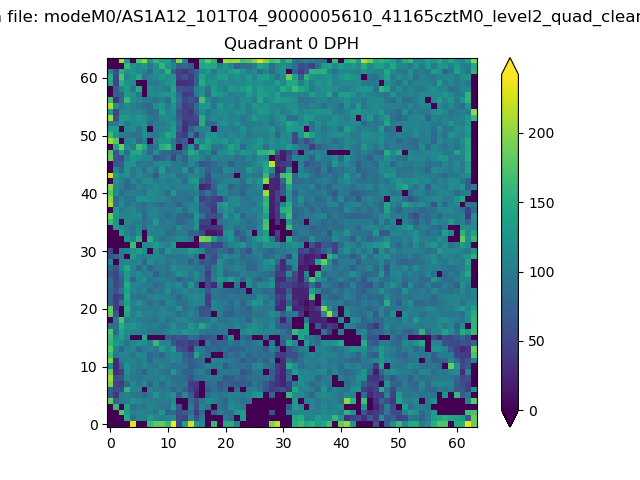 |
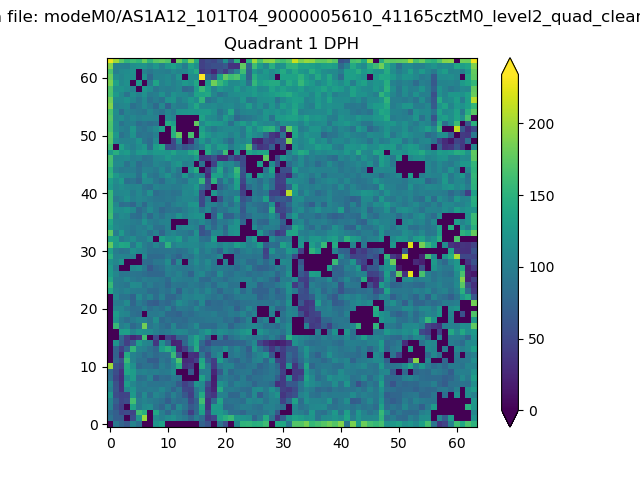 |
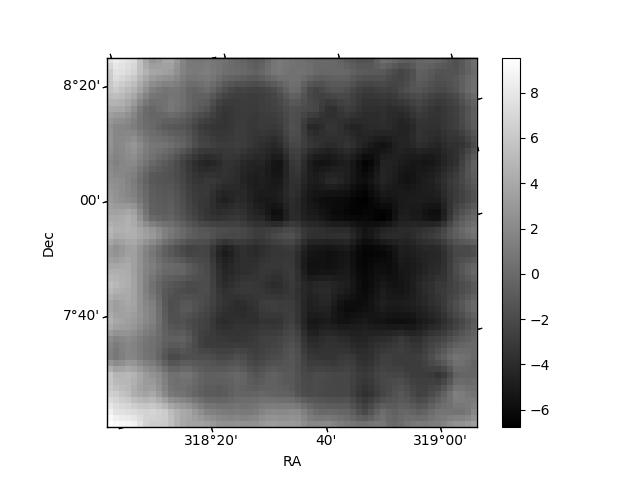
Quadrant B |
|---|---|---|---|
| Quadrant D | 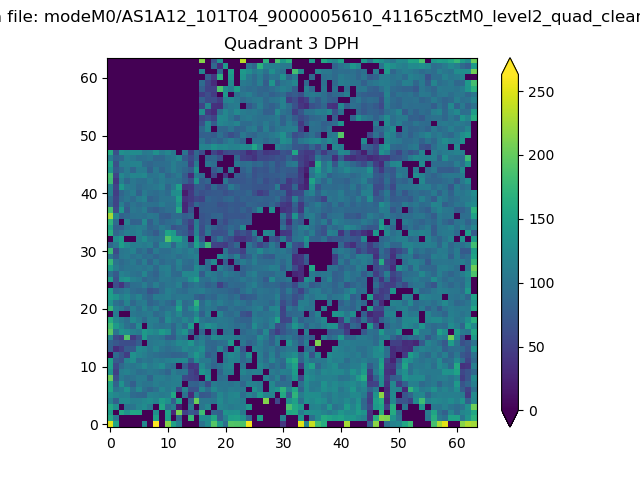 |
 |
Quadrant C |
| Plot type | Count rate plots | Images |
|---|---|---|
| Comparison with Poisson distribution Blue bars denote a histogram of data divided into 1 sec bins. Red curve is a Poisson curve with rate = median count rate of data. |
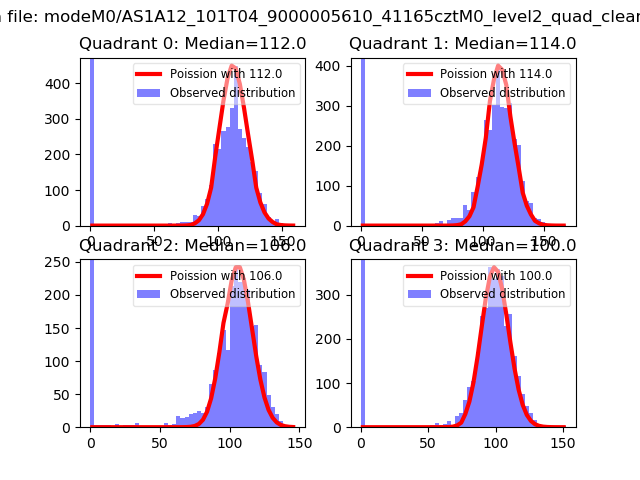 |
 |
| Quadrant-wise count rates Data is divided into 100 sec bins |
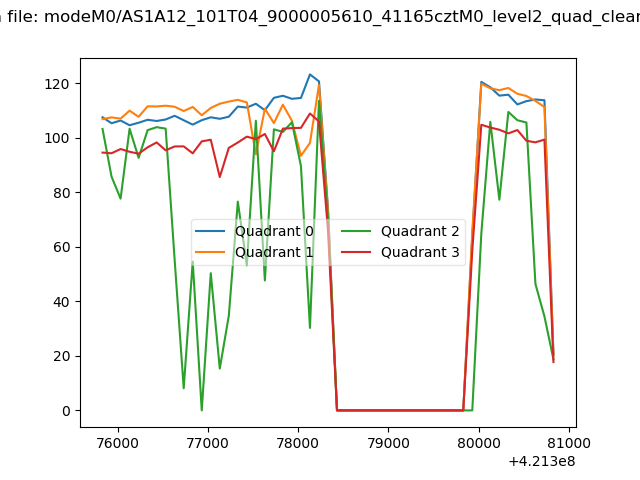 |
|
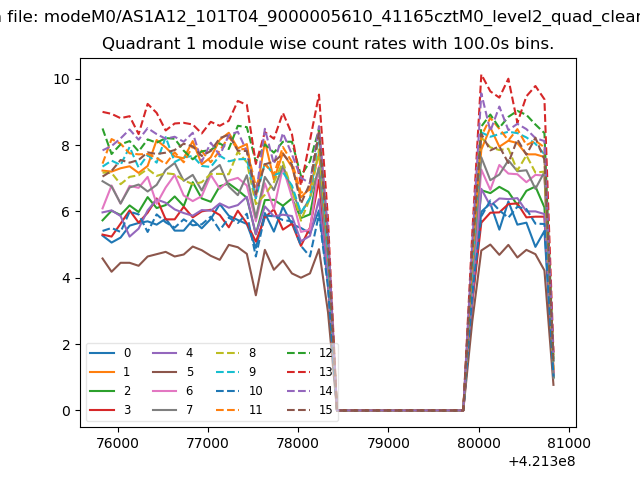
| Module-wise count rates for Quadrant A Data is divided into 100 sec bins |
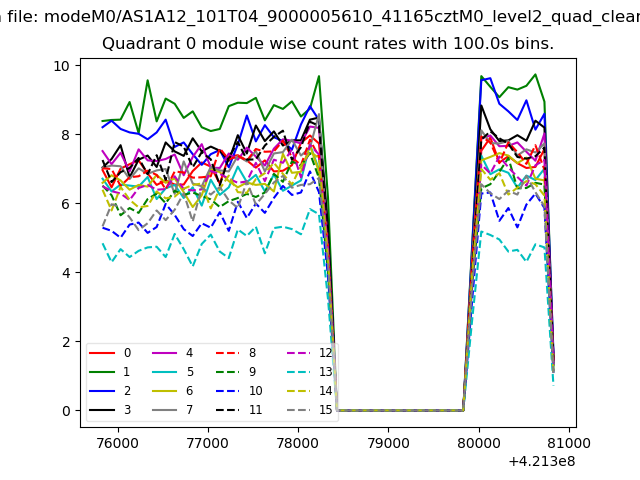 |
 |
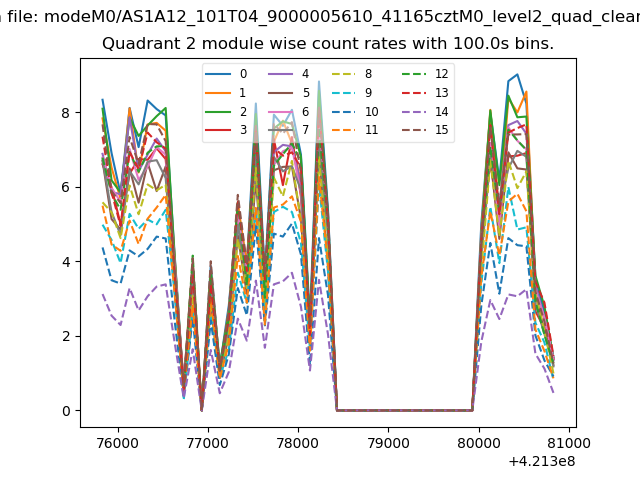
| Module-wise count rates for Quadrant B Data is divided into 100 sec bins |
 |
 |
| Module-wise count rates for Quadrant C Data is divided into 100 sec bins |
 |
 |
| Module-wise count rates for Quadrant D Data is divided into 100 sec bins |
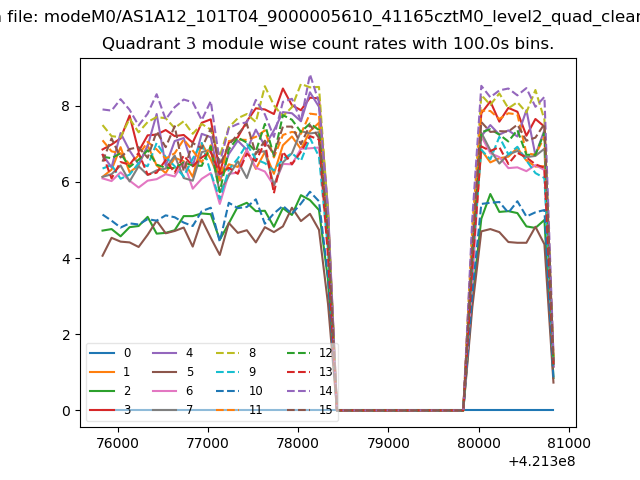 |
 |
| Parameter | Plot |
|---|---|
| CZT HV Monitor | 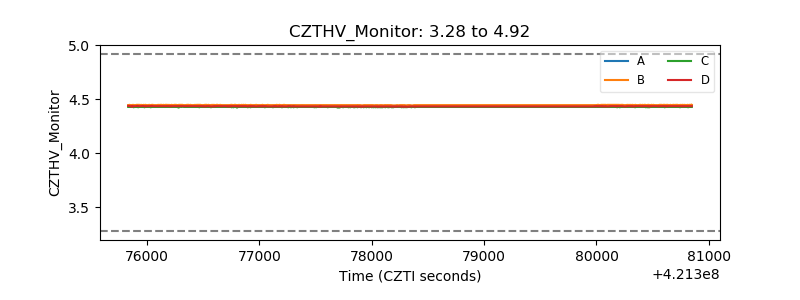 |
| D_VDD | 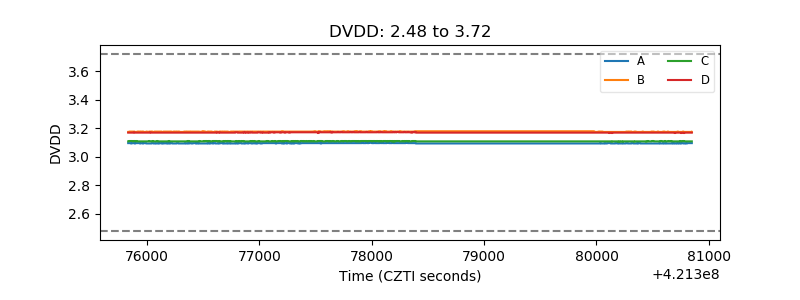 |
| Temperature 1 | 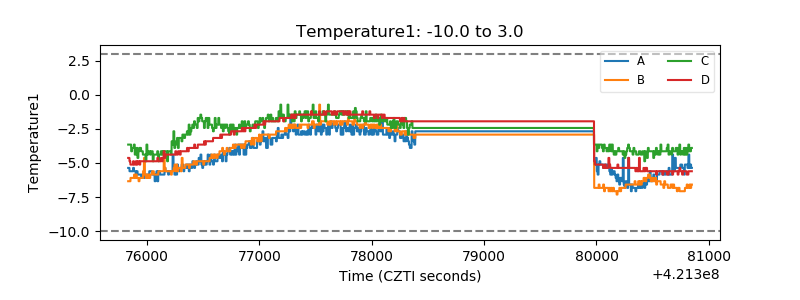 |
| Veto HV Monitor | 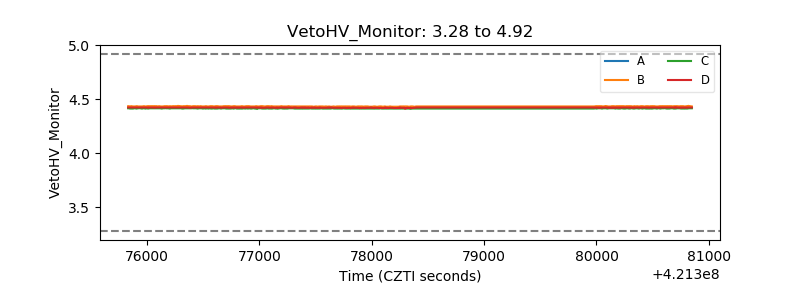 |
| Veto LLD | 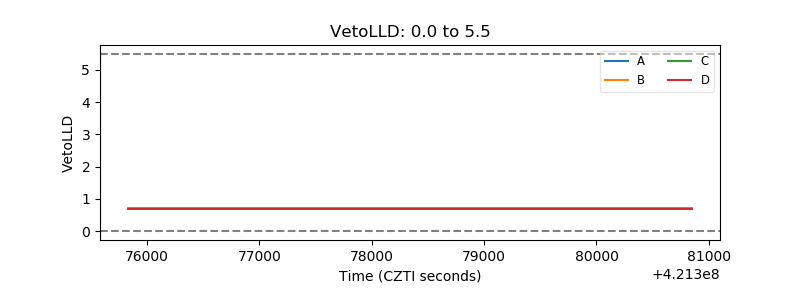 |
| Alpha Counter | 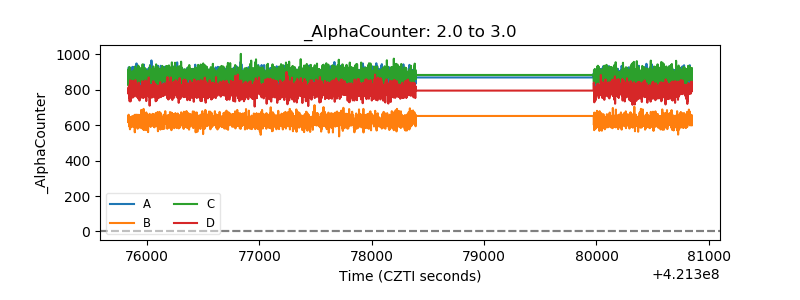 |
| _CPM_Rate | 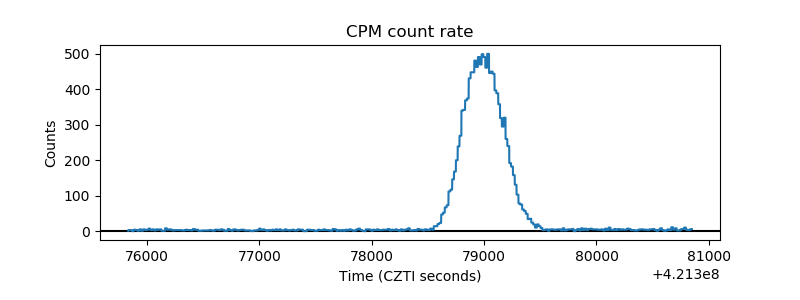 |
| CZT Counter | 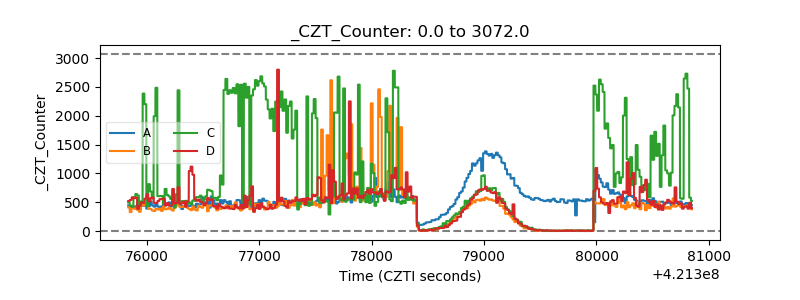 |
| +2.5 Volts monitor | 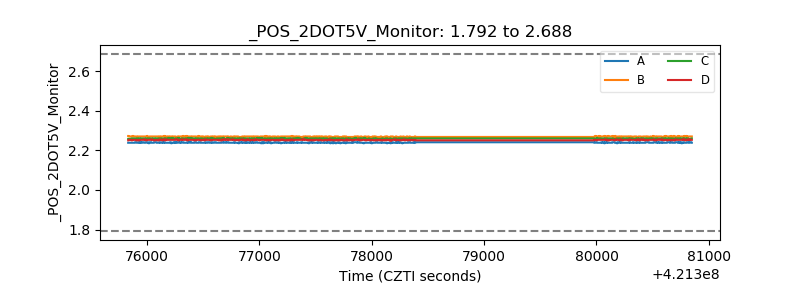 |
| +5 Volts monitor | 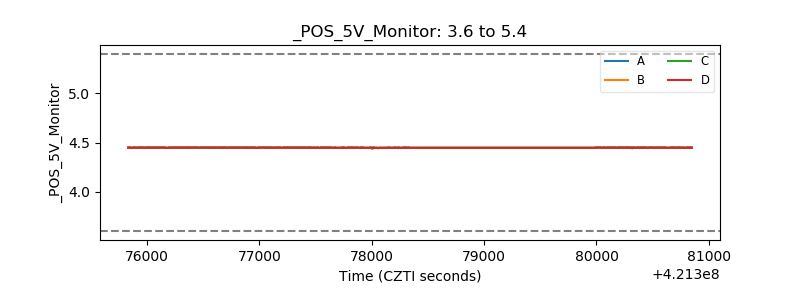 |
| _ROLL_ROT | 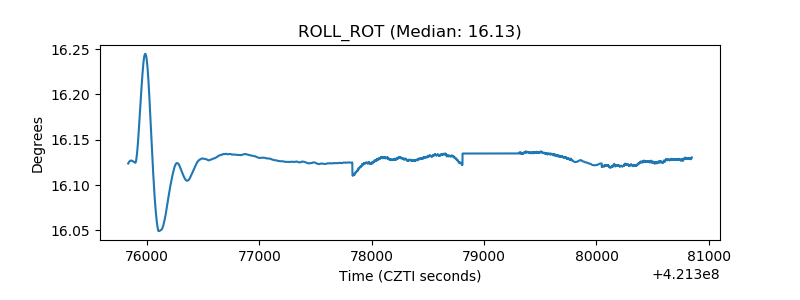 |
| _Roll_DEC | 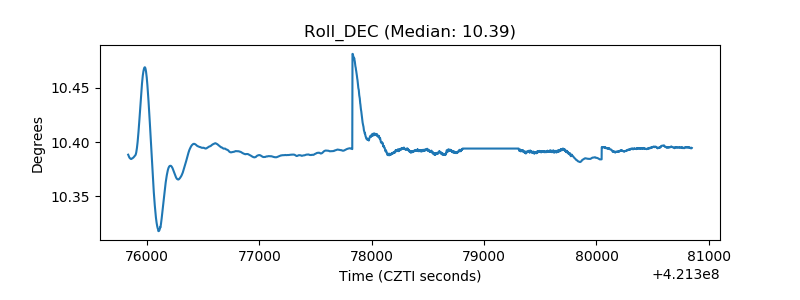 |
| _Roll_RA | 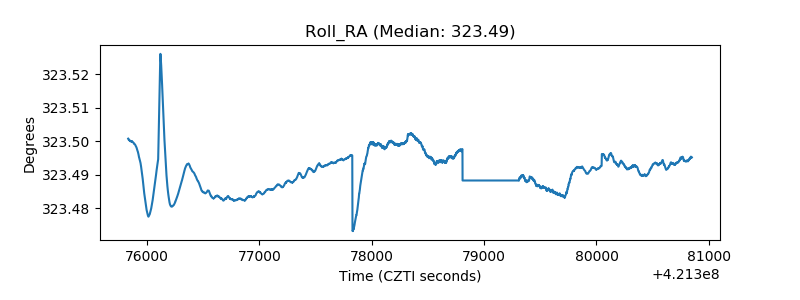 |
| Veto Counter | 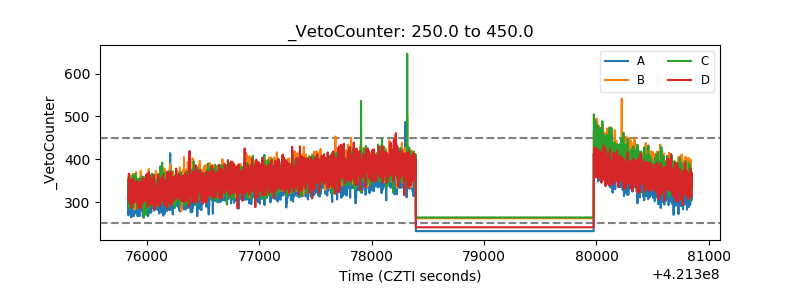 |