| Param | Original file | Final file |
|---|---|---|
| Filename | modeM0/AS1A12_101T04_9000005610_41167cztM0_level2.fits | modeM0/AS1A12_101T04_9000005610_41167cztM0_level2_quad_clean.evt |
| Size (bytes) | 471,101,760 | 80,988,480 |
| Size | 449.3 MB | 77.2 MB |
| Events in quadrant A | 2,800,564 | 601,632 |
| Events in quadrant B | 3,284,803 | 582,741 |
| Events in quadrant C | 7,906,267 | 359,554 |
| Events in quadrant D | 3,028,568 | 531,986 |
| Mode M0 | |||
|---|---|---|---|
| Quadrant | BADHDUFLAG | Total packets | Discarded packets |
| A | 0 | 11641 | 3 |
| B | 0 | 13558 | 2 |
| C | 0 | 27129 | 2 |
| D | 0 | 12760 | 2 |
| Mode SS | |||
|---|---|---|---|
| Quadrant | BADHDUFLAG | Total packets | Discarded packets |
| A | 0 | 110 | 0 |
| B | 0 | 110 | 0 |
| C | 0 | 110 | 0 |
| D | 0 | 110 | 0 |
| Mode M9 | |||
|---|---|---|---|
| Quadrant | BADHDUFLAG | Total packets | Discarded packets |
| A | 0 | 26 | 0 |
| B | 0 | 26 | 0 |
| C | 0 | 26 | 0 |
| D | 0 | 27 | 0 |
| Quadrant | Total seconds | Saturated seconds | Saturation percentage |
|---|---|---|---|
| A | 5373 | 8 | 0.148893% |
| B | 5373 | 331 | 6.160432% |
| C | 5373 | 2190 | 40.759352% |
| D | 5373 | 42 | 0.781686% |
Noise dominated data is calculated using 1-second bins in cleaned event files. If a bin has >2000 counts, and if more than 50% of those come from <1% of pixels, then it is considered to be noise-dominated and hence unusable.
| Quadrant | # 1 sec bins | Bins with >0 counts | Bins with >2000 counts | High rate bins dominated by noise | Noise dominated (total time) | Noise dominated (detector-on time) | Marked lightcurve |
|---|---|---|---|---|---|---|---|
| A | 7105 | 5374 | 2 | 2 | 0.03% | 0.04% | 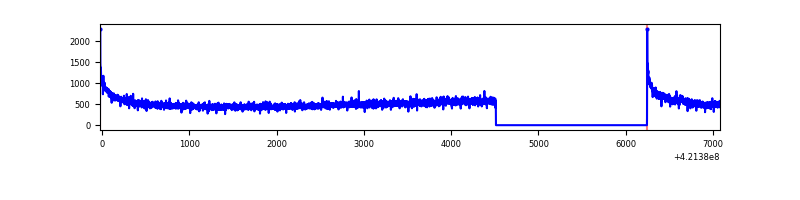 |
| B | 7105 | 5374 | 248 | 248 | 3.49% | 4.61% | 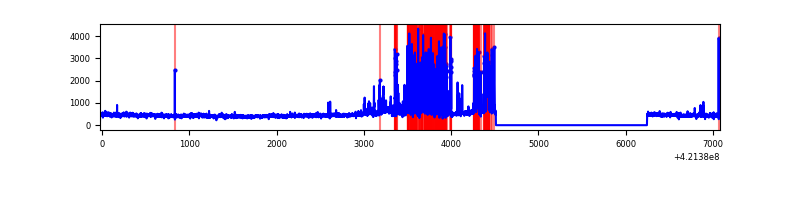 |
| C | 7105 | 5373 | 1811 | 1811 | 25.49% | 33.71% | 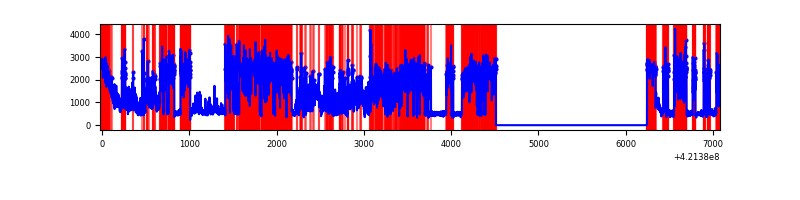 |
| D | 7105 | 5374 | 35 | 35 | 0.49% | 0.65% | 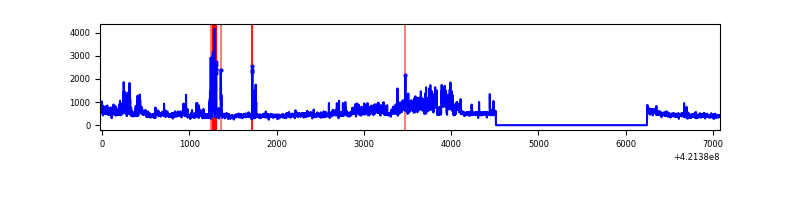 |
Top three noisy pixels from each quadrant. If the there are fewer than three noisy pixels in the level2.evt file, extra rows are filled as -1
| Pixel properties | Quadrant properties | ||||||
|---|---|---|---|---|---|---|---|
| Quadrant | DetID | PixID | Counts | Sigma | Mean | Median | Sigma |
| A | 10 | 83 | 514383 | 4286.58 | 584 | 572 | 119.9 |
| A | 12 | 189 | 23996 | 195.42 | 584 | 572 | 119.9 |
| A | 13 | 254 | 9748 | 76.55 | 584 | 572 | 119.9 |
| B | 0 | 245 | 926834 | 8385.35 | 562 | 546 | 110.5 |
| B | 7 | 202 | 139866 | 1261.21 | 562 | 546 | 110.5 |
| B | 5 | 255 | 13912 | 120.99 | 562 | 546 | 110.5 |
| C | 9 | 54 | 5449474 | 49990.36 | 468 | 470 | 109.0 |
| C | 0 | 10 | 363392 | 3329.53 | 468 | 470 | 109.0 |
| C | 15 | 214 | 195712 | 1791.19 | 468 | 470 | 109.0 |
| D | 2 | 16 | 465955 | 3401.36 | 561 | 545 | 136.8 |
| D | 13 | 249 | 153713 | 1119.4 | 561 | 545 | 136.8 |
| D | 2 | 120 | 127091 | 924.84 | 561 | 545 | 136.8 |
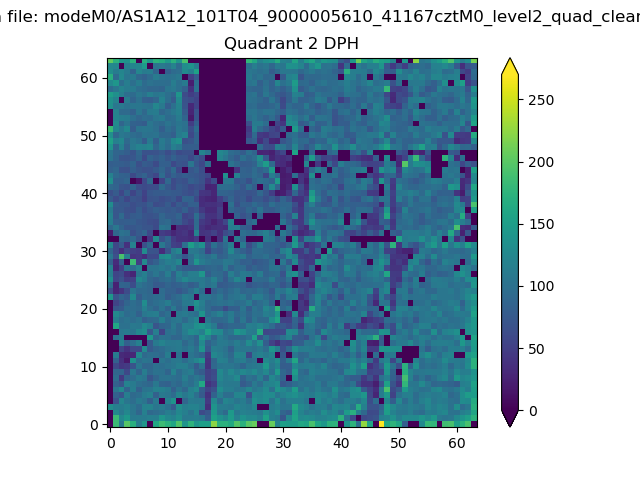
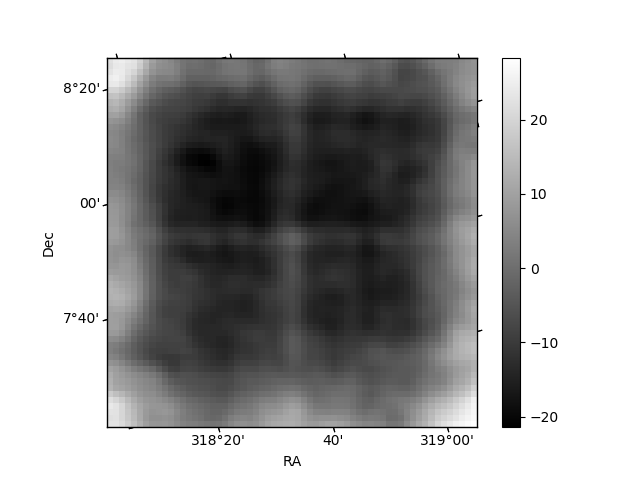
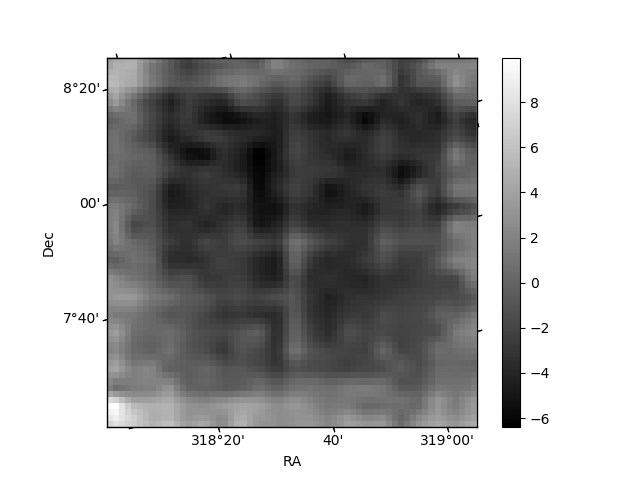
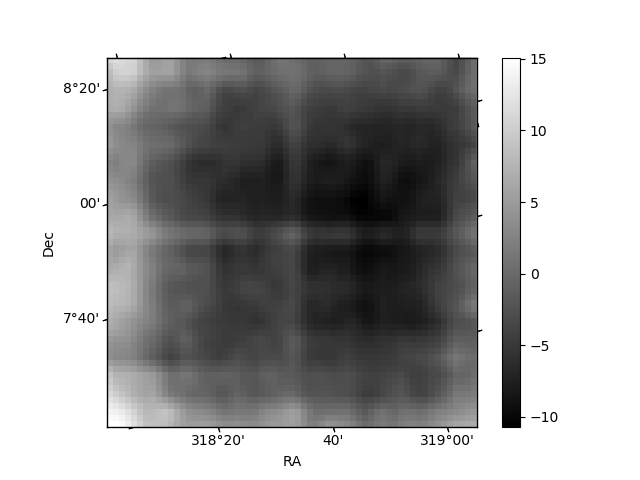
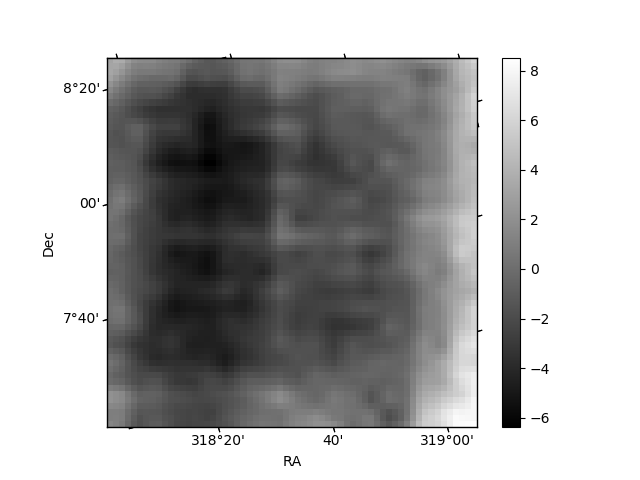
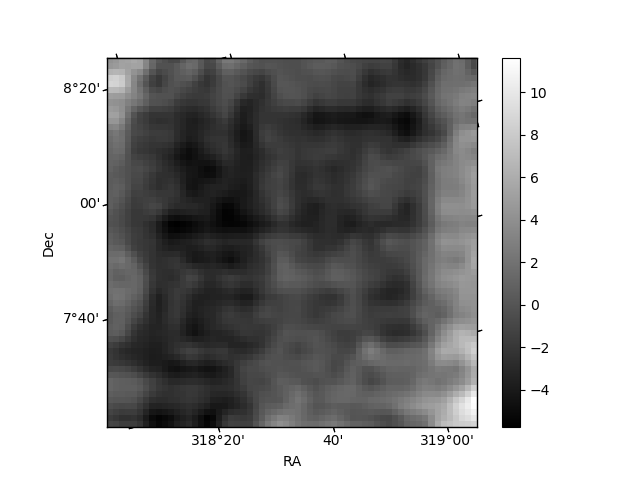
Histogram calculated using DETX and DETY for each event in the final _common_clean file
| Quadrant A | 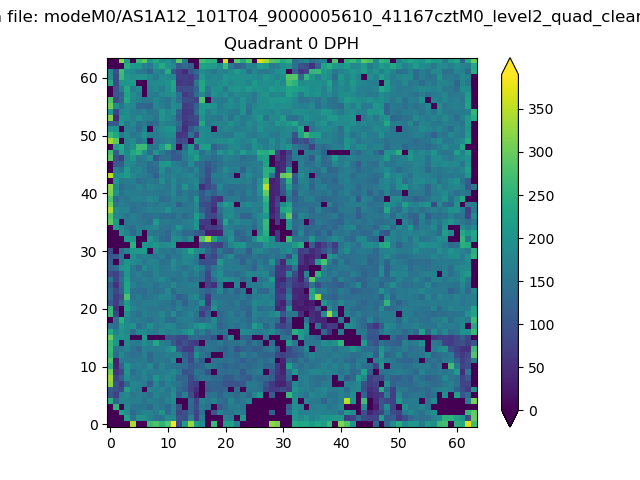 |
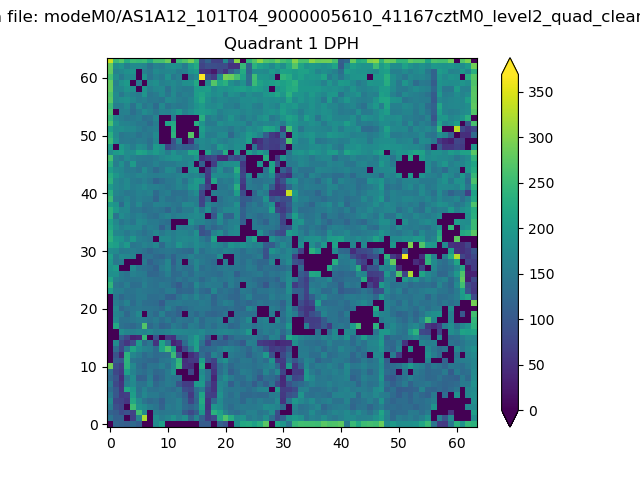 |
Quadrant B |
|---|---|---|---|
| Quadrant D | 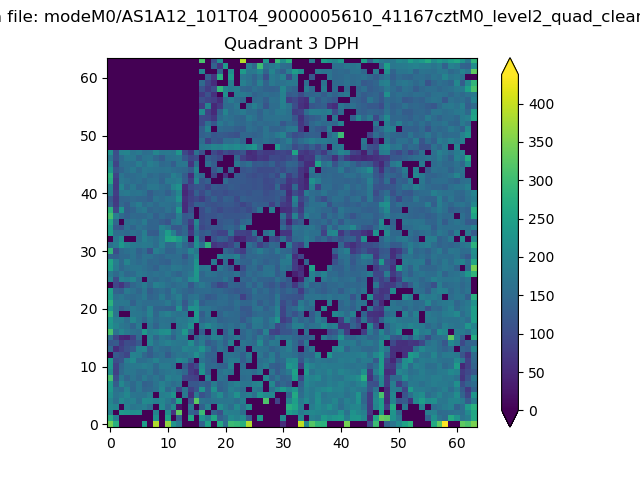 |
 |
Quadrant C |
| Plot type | Count rate plots | Images |
|---|---|---|
| Comparison with Poisson distribution Blue bars denote a histogram of data divided into 1 sec bins. Red curve is a Poisson curve with rate = median count rate of data. |
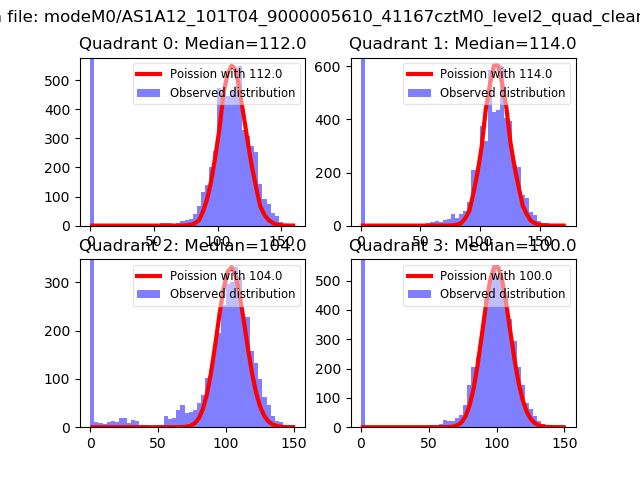 |
 |
| Quadrant-wise count rates Data is divided into 100 sec bins |
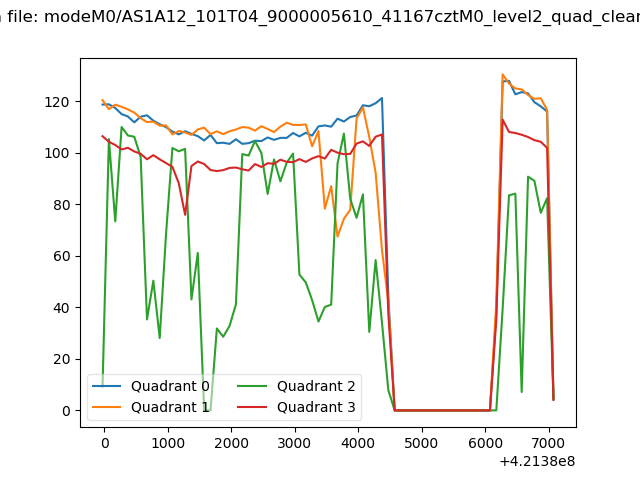 |
|
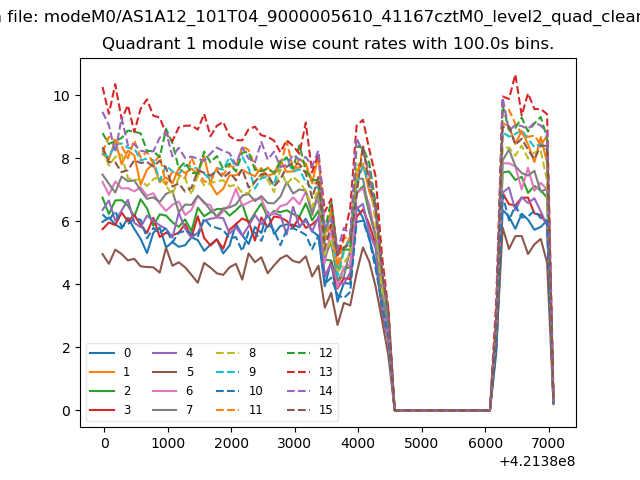
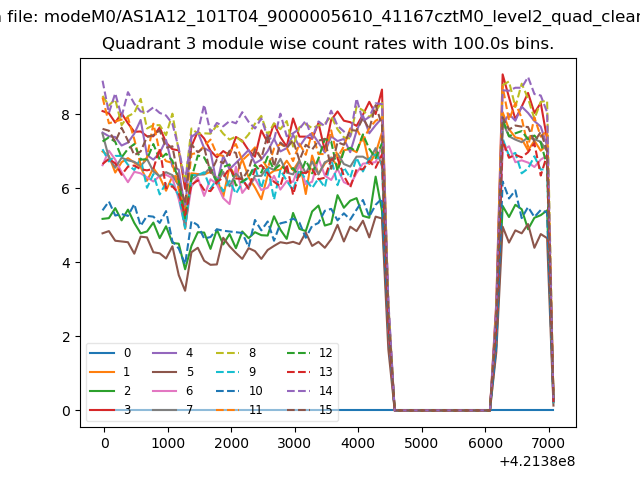
| Module-wise count rates for Quadrant A Data is divided into 100 sec bins |
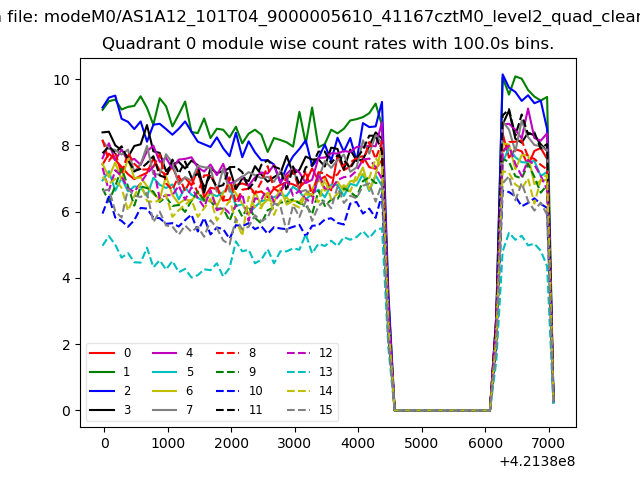 |
 |
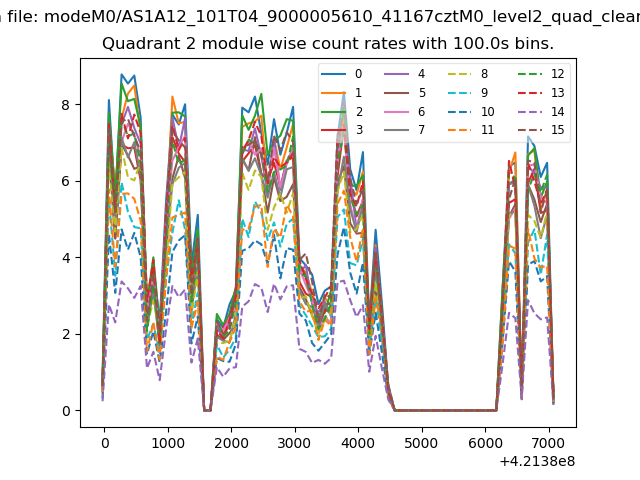
| Module-wise count rates for Quadrant B Data is divided into 100 sec bins |
 |
 |
| Module-wise count rates for Quadrant C Data is divided into 100 sec bins |
 |
 |
| Module-wise count rates for Quadrant D Data is divided into 100 sec bins |
 |
 |
| Parameter | Plot |
|---|---|
| CZT HV Monitor | 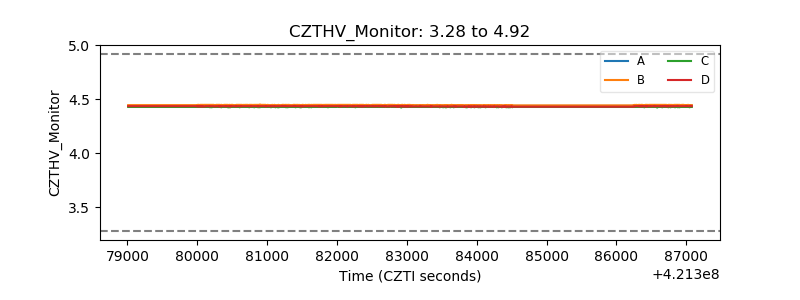 |
| D_VDD | 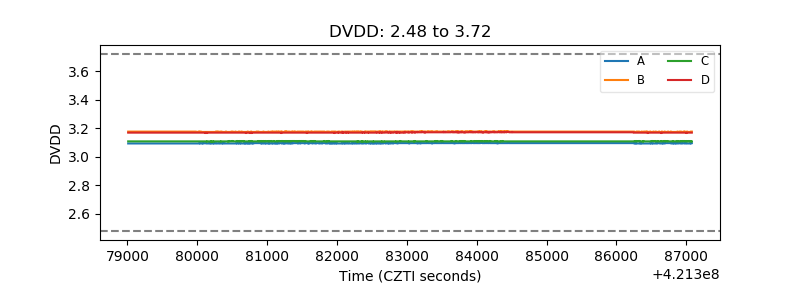 |
| Temperature 1 | 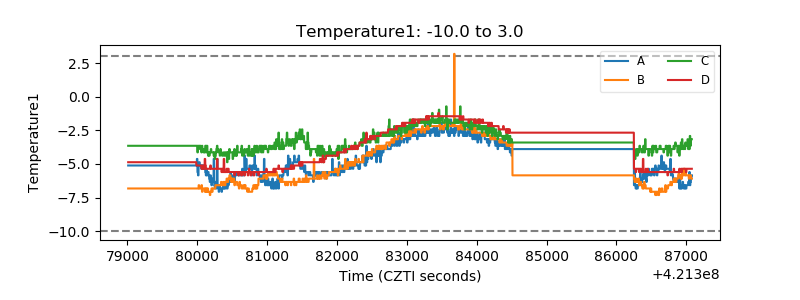 |
| Veto HV Monitor | 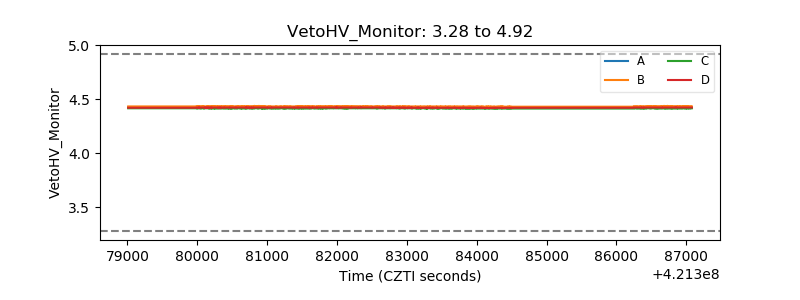 |
| Veto LLD | 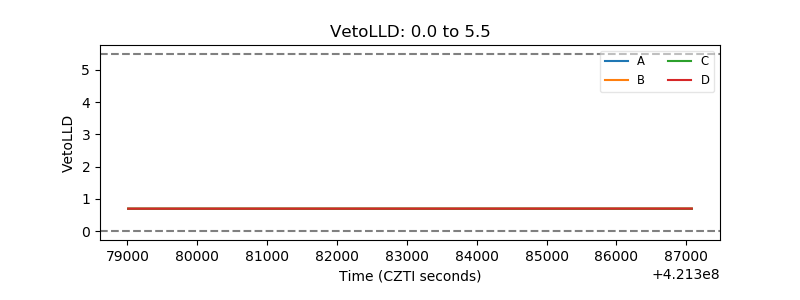 |
| Alpha Counter | 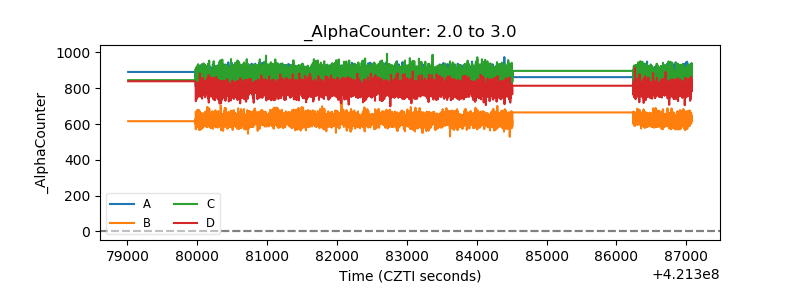 |
| _CPM_Rate | 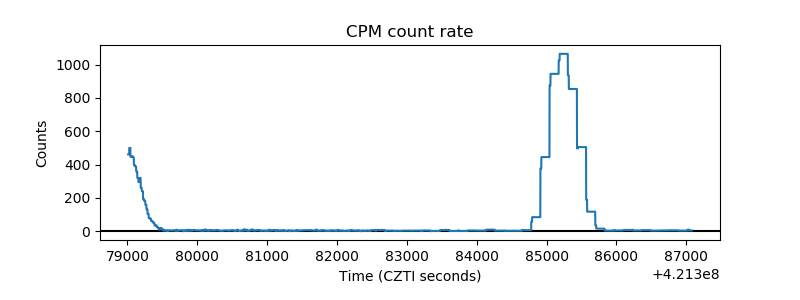 |
| CZT Counter | 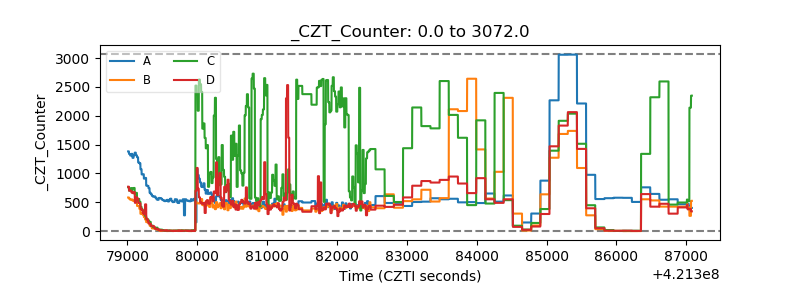 |
| +2.5 Volts monitor | 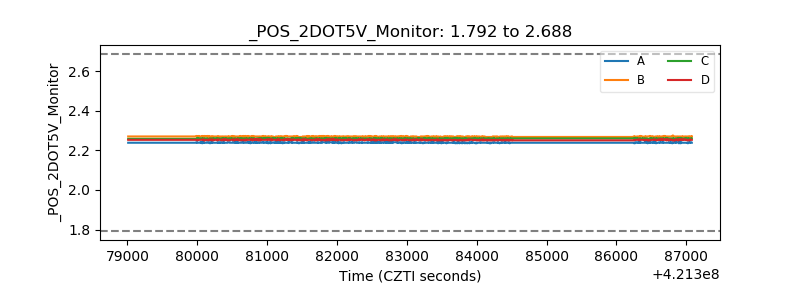 |
| +5 Volts monitor | 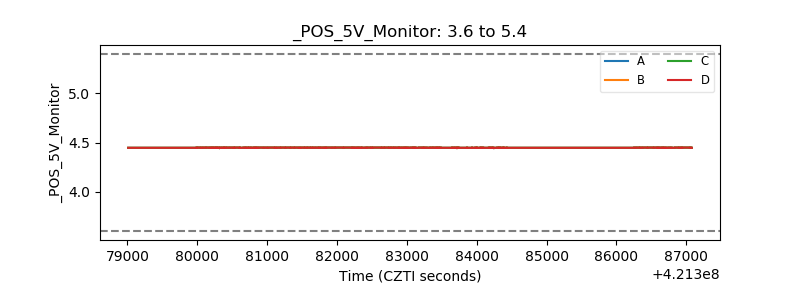 |
| _ROLL_ROT | 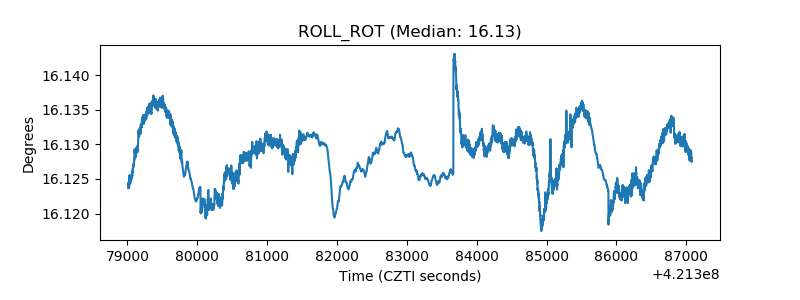 |
| _Roll_DEC | 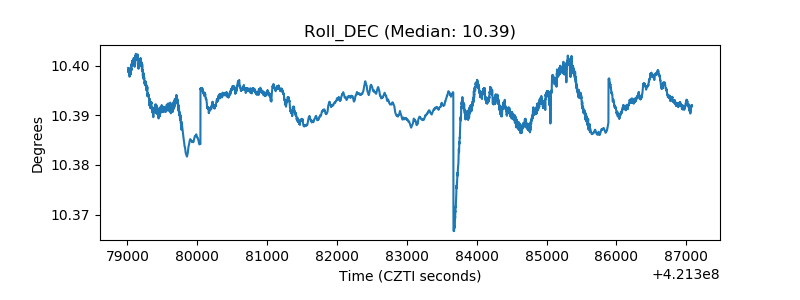 |
| _Roll_RA | 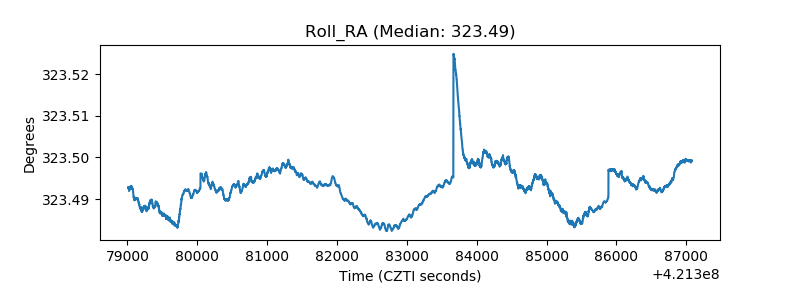 |
| Veto Counter | 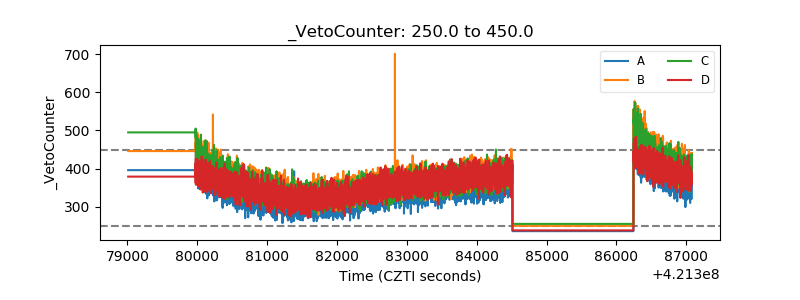 |