| Param | Original file | Final file |
|---|---|---|
| Filename | modeM0/AS1A12_101T04_9000005610_41168cztM0_level2.fits | modeM0/AS1A12_101T04_9000005610_41168cztM0_level2_quad_clean.evt |
| Size (bytes) | 445,763,520 | 91,661,760 |
| Size | 425.1 MB | 87.4 MB |
| Events in quadrant A | 3,040,842 | 668,104 |
| Events in quadrant B | 3,425,826 | 663,663 |
| Events in quadrant C | 6,756,142 | 463,920 |
| Events in quadrant D | 2,833,325 | 580,600 |
| Mode M0 | |||
|---|---|---|---|
| Quadrant | BADHDUFLAG | Total packets | Discarded packets |
| A | 0 | 12426 | 3 |
| B | 0 | 14122 | 2 |
| C | 0 | 23830 | 2 |
| D | 0 | 12615 | 2 |
| Mode SS | |||
|---|---|---|---|
| Quadrant | BADHDUFLAG | Total packets | Discarded packets |
| A | 0 | 118 | 0 |
| B | 0 | 118 | 0 |
| C | 0 | 118 | 0 |
| D | 0 | 118 | 0 |
| Mode M9 | |||
|---|---|---|---|
| Quadrant | BADHDUFLAG | Total packets | Discarded packets |
| A | 0 | 36 | 0 |
| B | 0 | 36 | 0 |
| C | 0 | 36 | 0 |
| D | 0 | 36 | 0 |
| Quadrant | Total seconds | Saturated seconds | Saturation percentage |
|---|---|---|---|
| A | 5710 | 8 | 0.140105% |
| B | 5710 | 224 | 3.922942% |
| C | 5710 | 1676 | 29.352014% |
| D | 5710 | 108 | 1.891419% |
Noise dominated data is calculated using 1-second bins in cleaned event files. If a bin has >2000 counts, and if more than 50% of those come from <1% of pixels, then it is considered to be noise-dominated and hence unusable.
| Quadrant | # 1 sec bins | Bins with >0 counts | Bins with >2000 counts | High rate bins dominated by noise | Noise dominated (total time) | Noise dominated (detector-on time) | Marked lightcurve |
|---|---|---|---|---|---|---|---|
| A | 9295 | 5712 | 3 | 3 | 0.03% | 0.05% | 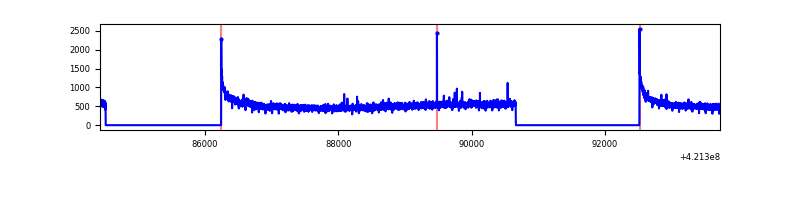 |
| B | 9295 | 5712 | 189 | 189 | 2.03% | 3.31% | 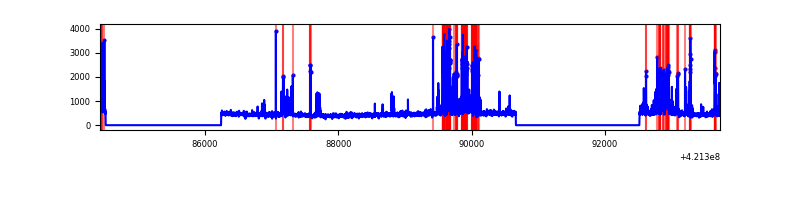 |
| C | 9295 | 5711 | 1439 | 1439 | 15.48% | 25.20% | 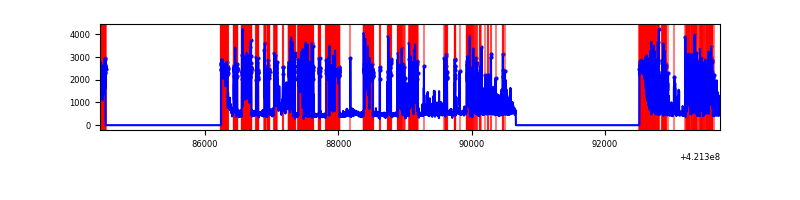 |
| D | 9295 | 5712 | 85 | 85 | 0.91% | 1.49% | 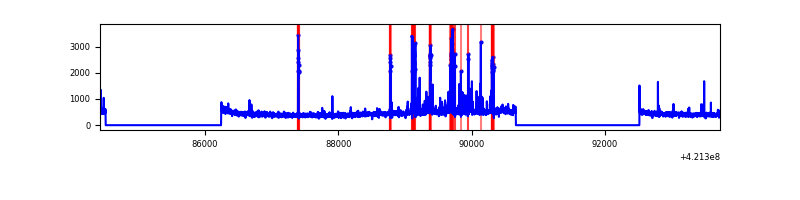 |
Top three noisy pixels from each quadrant. If the there are fewer than three noisy pixels in the level2.evt file, extra rows are filled as -1
| Pixel properties | Quadrant properties | ||||||
|---|---|---|---|---|---|---|---|
| Quadrant | DetID | PixID | Counts | Sigma | Mean | Median | Sigma |
| A | 10 | 83 | 548457 | 4236.15 | 636 | 625 | 129.3 |
| A | 12 | 189 | 24999 | 188.47 | 636 | 625 | 129.3 |
| A | 13 | 254 | 9987 | 72.39 | 636 | 625 | 129.3 |
| B | 0 | 245 | 903723 | 7563.33 | 618 | 602 | 119.4 |
| B | 7 | 202 | 41883 | 345.71 | 618 | 602 | 119.4 |
| B | 5 | 255 | 40320 | 332.62 | 618 | 602 | 119.4 |
| C | 9 | 54 | 4107722 | 33996.25 | 521 | 523 | 120.8 |
| C | 0 | 10 | 397542 | 3286.22 | 521 | 523 | 120.8 |
| C | 15 | 214 | 209837 | 1732.54 | 521 | 523 | 120.8 |
| D | 13 | 249 | 320284 | 2177.75 | 606 | 591 | 146.8 |
| D | 2 | 16 | 88022 | 595.58 | 606 | 591 | 146.8 |
| D | 2 | 153 | 38051 | 255.18 | 606 | 591 | 146.8 |
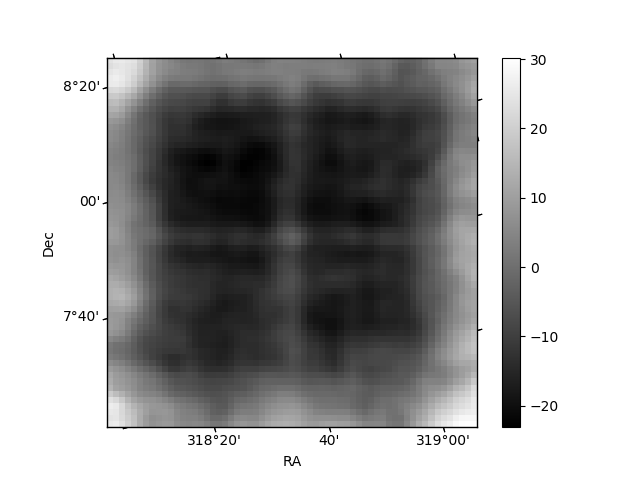
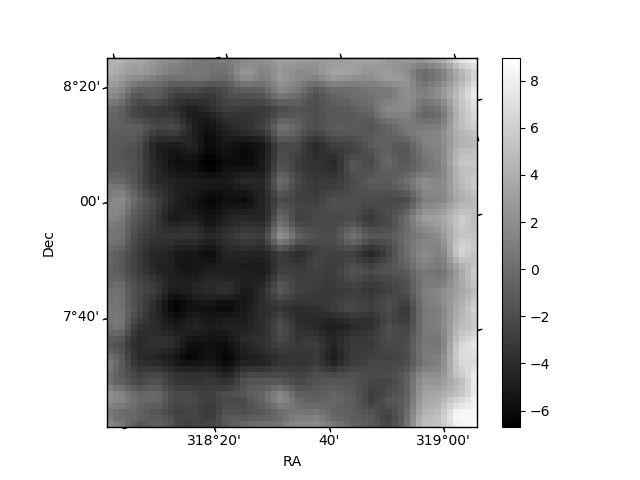
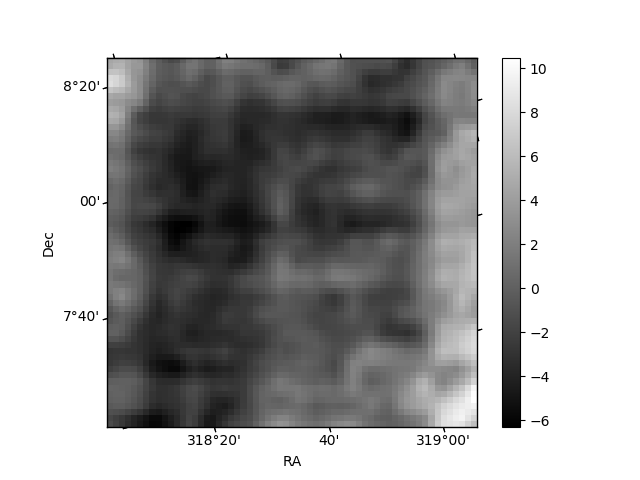
Histogram calculated using DETX and DETY for each event in the final _common_clean file
| Quadrant A | 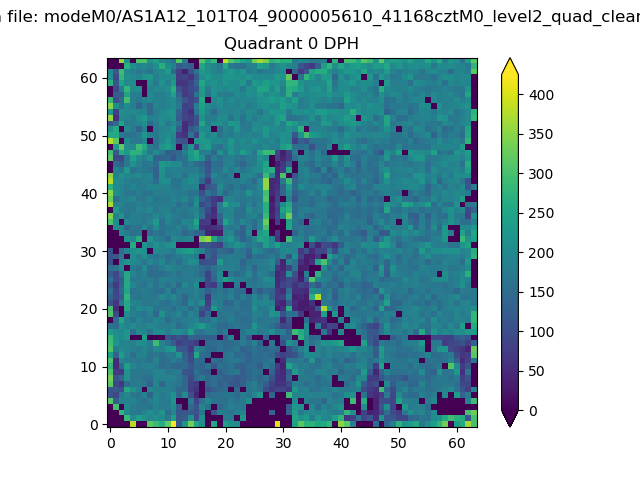 |
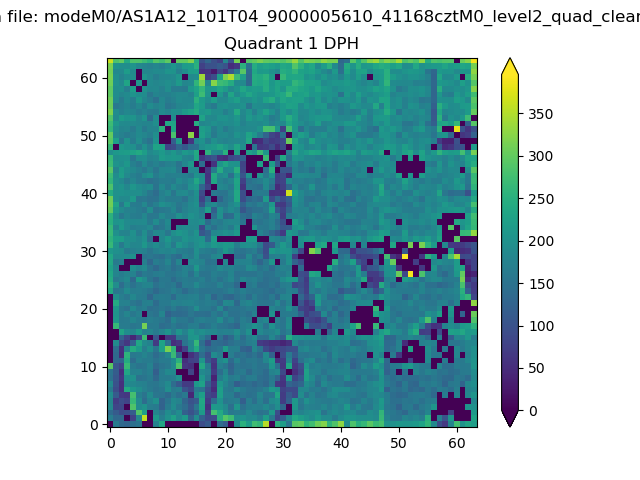 |
Quadrant B |
|---|---|---|---|
| Quadrant D | 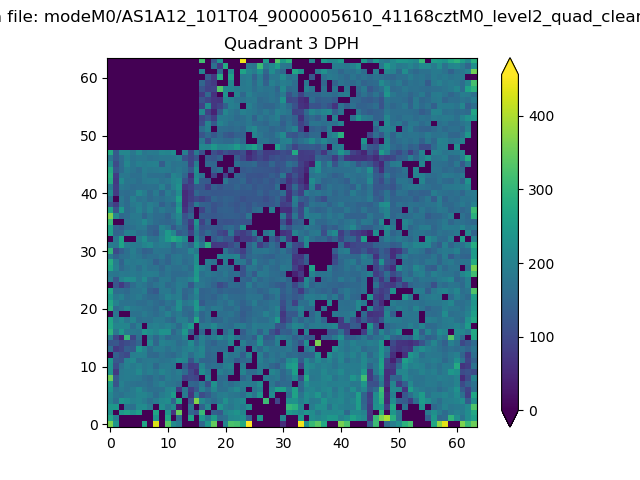 |
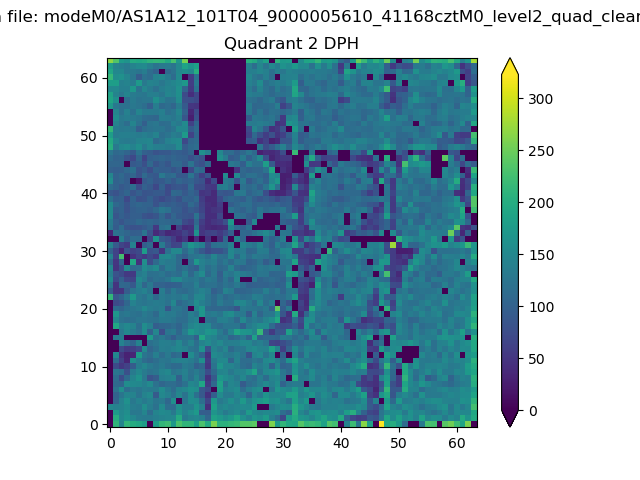 |
Quadrant C |
| Plot type | Count rate plots | Images |
|---|---|---|
| Comparison with Poisson distribution Blue bars denote a histogram of data divided into 1 sec bins. Red curve is a Poisson curve with rate = median count rate of data. |
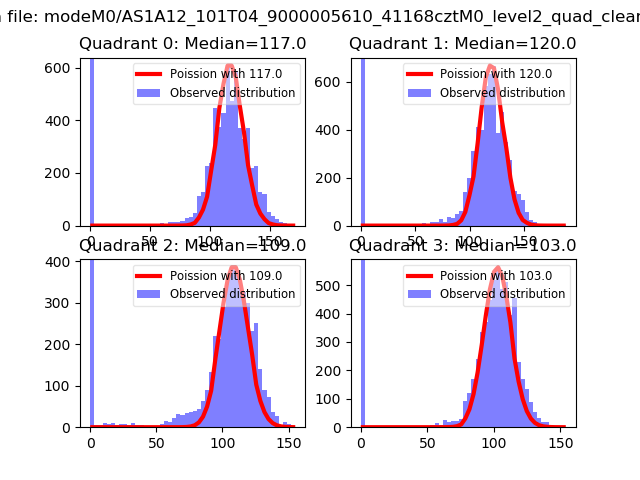 |
 |
| Quadrant-wise count rates Data is divided into 100 sec bins |
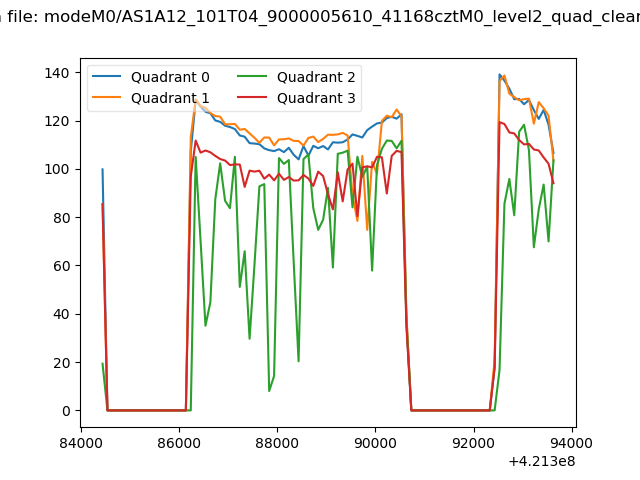 |
|
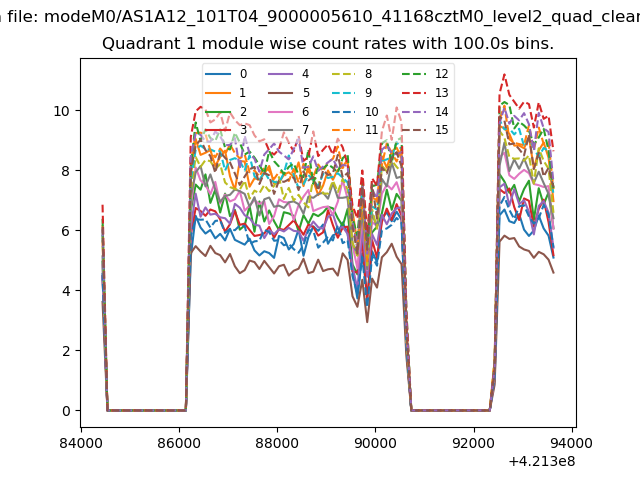
| Module-wise count rates for Quadrant A Data is divided into 100 sec bins |
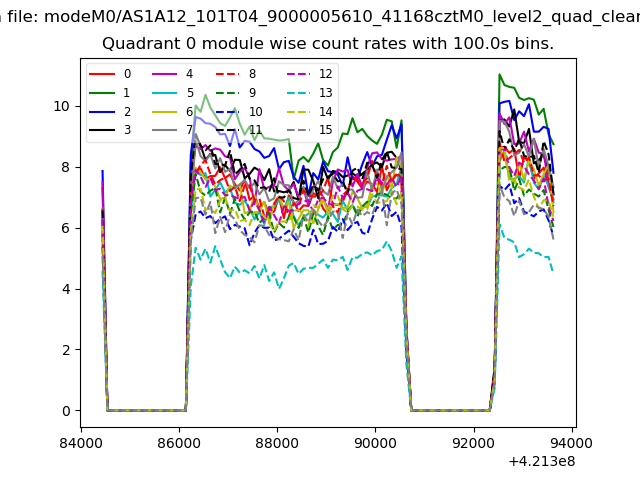 |
 |
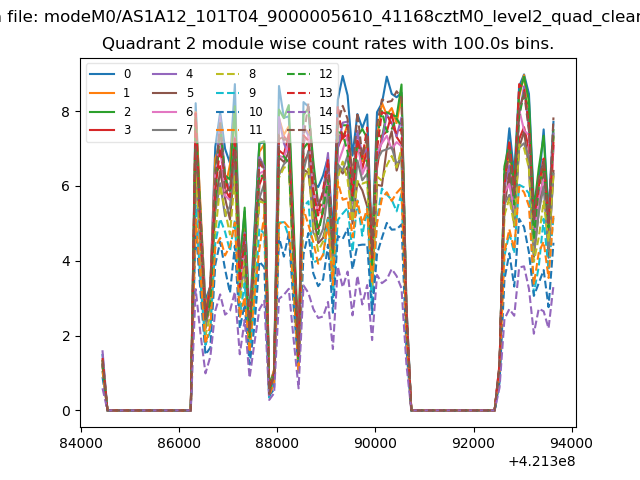
| Module-wise count rates for Quadrant B Data is divided into 100 sec bins |
 |
 |
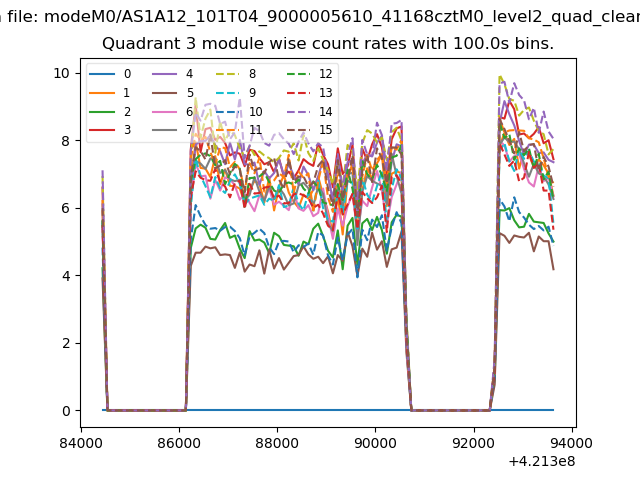
| Module-wise count rates for Quadrant C Data is divided into 100 sec bins |
 |
 |
| Module-wise count rates for Quadrant D Data is divided into 100 sec bins |
 |
 |
| Parameter | Plot |
|---|---|
| CZT HV Monitor | 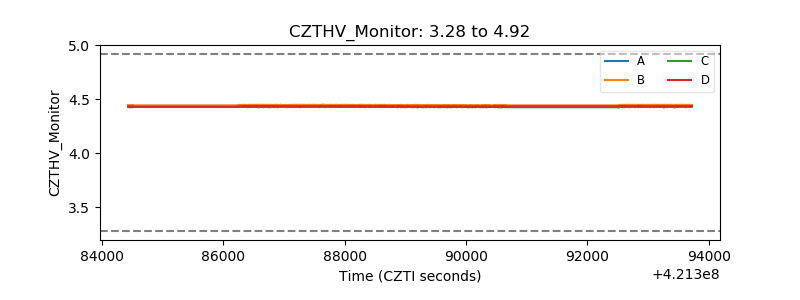 |
| D_VDD | 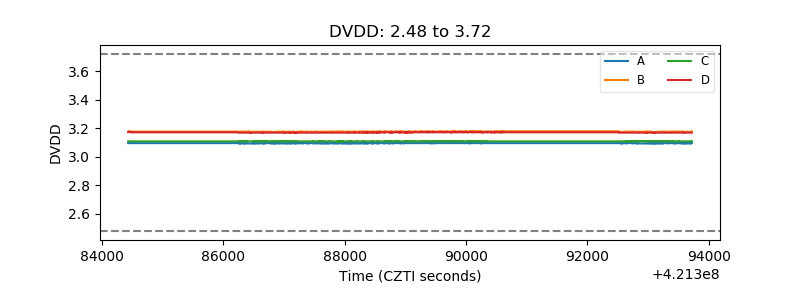 |
| Temperature 1 | 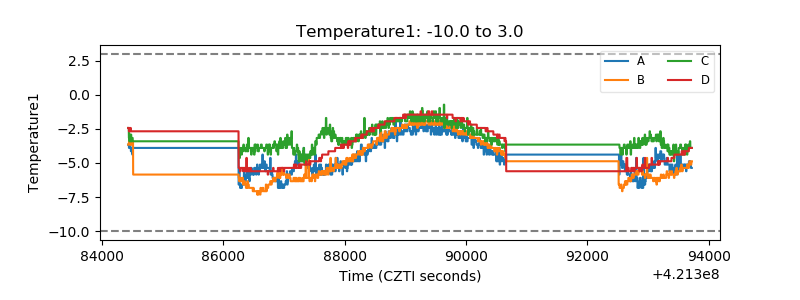 |
| Veto HV Monitor | 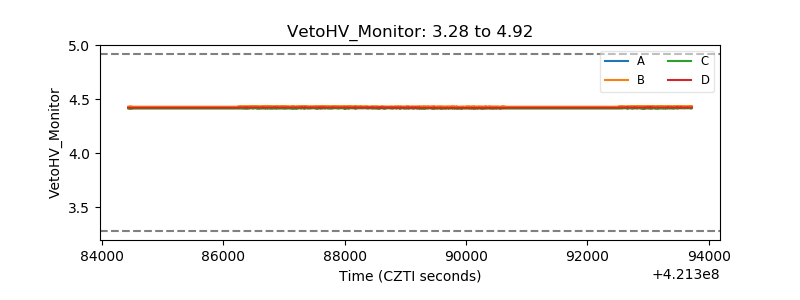 |
| Veto LLD | 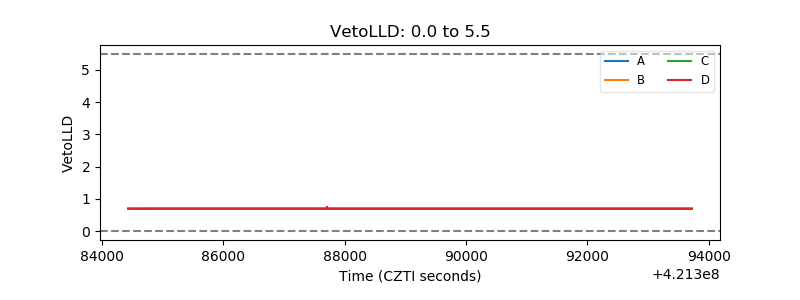 |
| Alpha Counter | 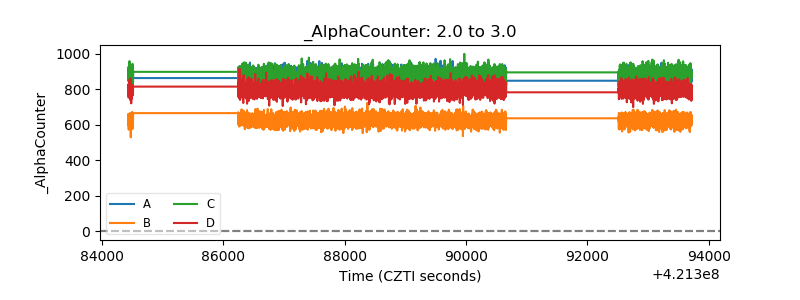 |
| _CPM_Rate | 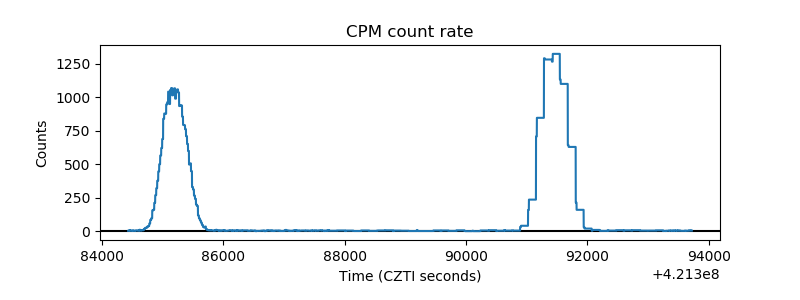 |
| CZT Counter | 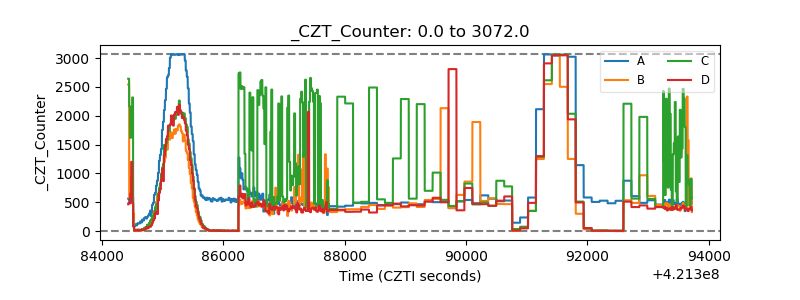 |
| +2.5 Volts monitor | 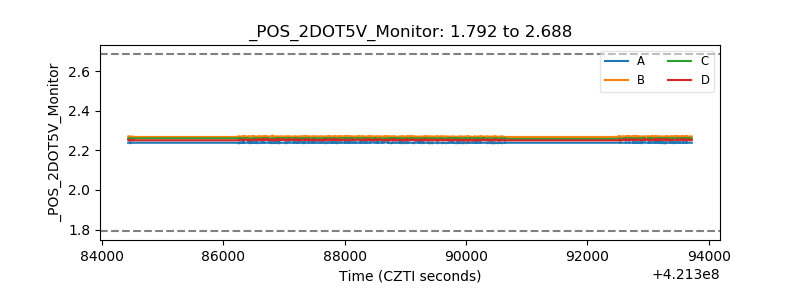 |
| +5 Volts monitor | 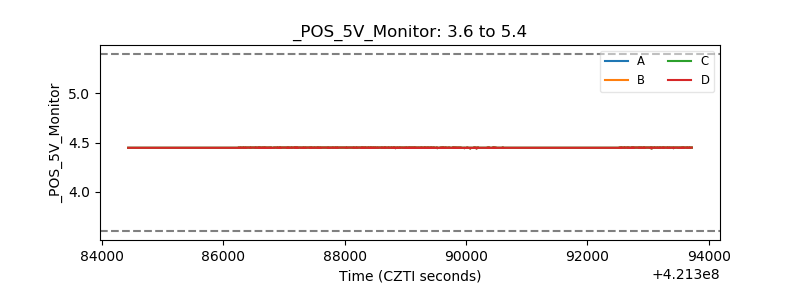 |
| _ROLL_ROT | 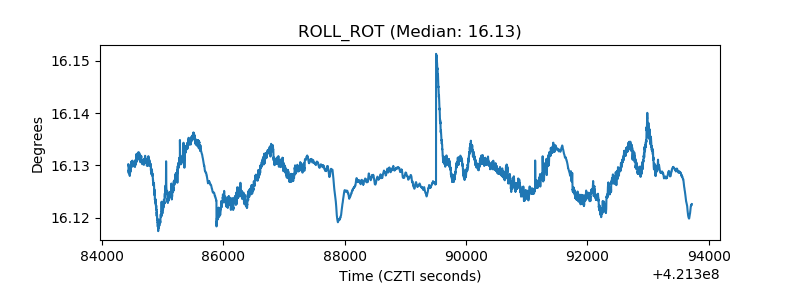 |
| _Roll_DEC | 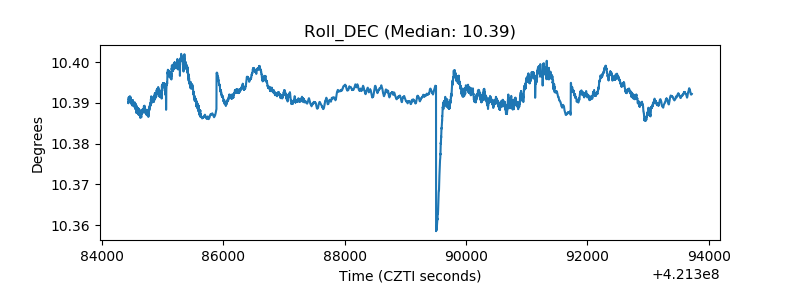 |
| _Roll_RA | 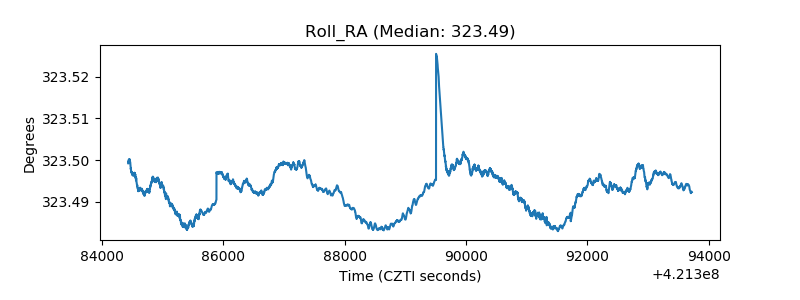 |
| Veto Counter | 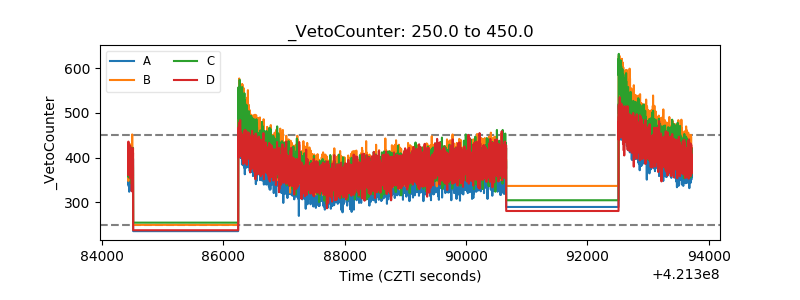 |