| Param | Original file | Final file |
|---|---|---|
| Filename | modeM0/AS1A12_101T04_9000005610_41170cztM0_level2.fits | modeM0/AS1A12_101T04_9000005610_41170cztM0_level2_quad_clean.evt |
| Size (bytes) | 469,186,560 | 88,655,040 |
| Size | 447.5 MB | 84.5 MB |
| Events in quadrant A | 3,048,322 | 667,431 |
| Events in quadrant B | 3,475,260 | 656,815 |
| Events in quadrant C | 6,372,729 | 448,582 |
| Events in quadrant D | 4,056,369 | 538,469 |
| Mode M0 | |||
|---|---|---|---|
| Quadrant | BADHDUFLAG | Total packets | Discarded packets |
| A | 0 | 12131 | 3 |
| B | 0 | 13795 | 2 |
| C | 0 | 22486 | 2 |
| D | 0 | 15647 | 2 |
| Mode SS | |||
|---|---|---|---|
| Quadrant | BADHDUFLAG | Total packets | Discarded packets |
| A | 0 | 108 | 0 |
| B | 0 | 108 | 0 |
| C | 0 | 108 | 0 |
| D | 0 | 108 | 0 |
| Mode M9 | |||
|---|---|---|---|
| Quadrant | BADHDUFLAG | Total packets | Discarded packets |
| A | 0 | 24 | 0 |
| B | 0 | 24 | 0 |
| C | 0 | 24 | 0 |
| D | 0 | 25 | 0 |
| Quadrant | Total seconds | Saturated seconds | Saturation percentage |
|---|---|---|---|
| A | 5332 | 11 | 0.206302% |
| B | 5332 | 273 | 5.120030% |
| C | 5332 | 1658 | 31.095274% |
| D | 5332 | 532 | 9.977494% |
Noise dominated data is calculated using 1-second bins in cleaned event files. If a bin has >2000 counts, and if more than 50% of those come from <1% of pixels, then it is considered to be noise-dominated and hence unusable.
| Quadrant | # 1 sec bins | Bins with >0 counts | Bins with >2000 counts | High rate bins dominated by noise | Noise dominated (total time) | Noise dominated (detector-on time) | Marked lightcurve |
|---|---|---|---|---|---|---|---|
| A | 7424 | 5333 | 4 | 4 | 0.05% | 0.08% |  |
| B | 7424 | 5333 | 223 | 223 | 3.00% | 4.18% | 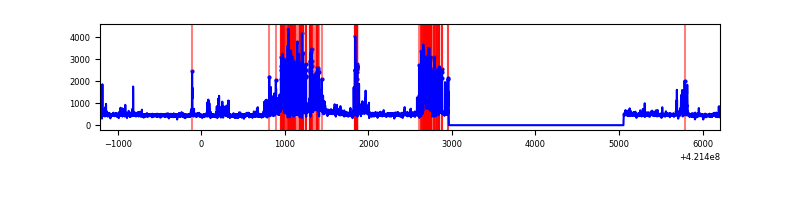 |
| C | 7424 | 5332 | 1390 | 1390 | 18.72% | 26.07% | 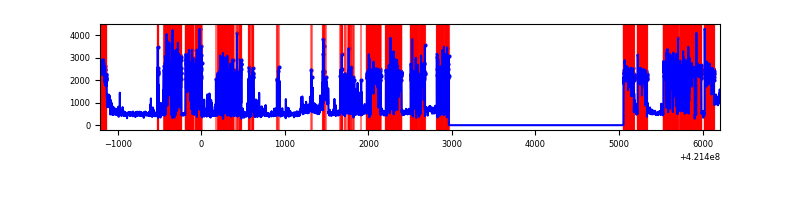 |
| D | 7424 | 5333 | 476 | 476 | 6.41% | 8.93% | 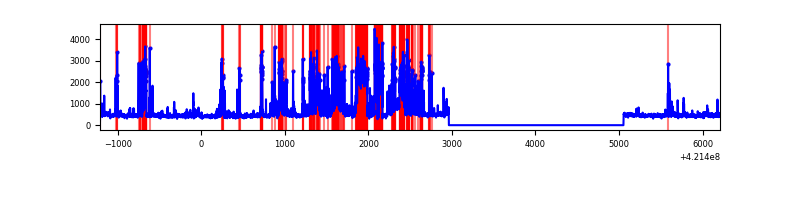 |
Top three noisy pixels from each quadrant. If the there are fewer than three noisy pixels in the level2.evt file, extra rows are filled as -1
| Pixel properties | Quadrant properties | ||||||
|---|---|---|---|---|---|---|---|
| Quadrant | DetID | PixID | Counts | Sigma | Mean | Median | Sigma |
| A | 10 | 83 | 531057 | 4106.31 | 634 | 623 | 129.2 |
| A | 12 | 189 | 50921 | 389.38 | 634 | 623 | 129.2 |
| A | 13 | 254 | 8483 | 60.85 | 634 | 623 | 129.2 |
| B | 0 | 245 | 737646 | 6304.05 | 608 | 593 | 116.9 |
| B | 0 | 186 | 150735 | 1284.17 | 608 | 593 | 116.9 |
| B | 5 | 255 | 100926 | 858.15 | 608 | 593 | 116.9 |
| C | 9 | 54 | 3948818 | 34499.6 | 492 | 496 | 114.4 |
| C | 0 | 10 | 307109 | 2679.12 | 492 | 496 | 114.4 |
| C | 15 | 214 | 190872 | 1663.47 | 492 | 496 | 114.4 |
| D | 13 | 249 | 1222536 | 8497.62 | 582 | 568 | 143.8 |
| D | 2 | 249 | 259777 | 1802.55 | 582 | 568 | 143.8 |
| D | 7 | 39 | 232089 | 1610.01 | 582 | 568 | 143.8 |
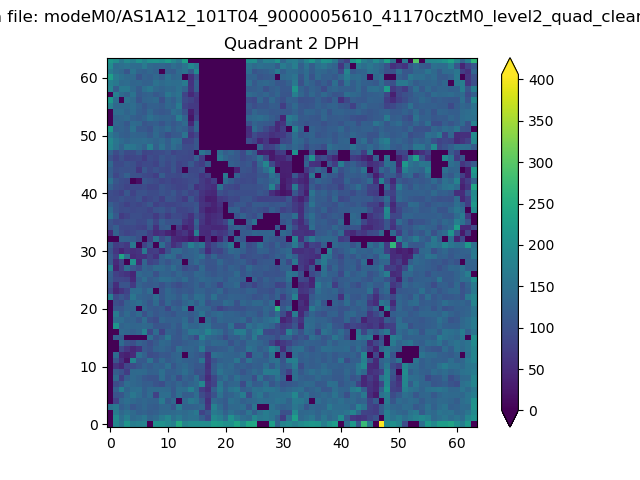
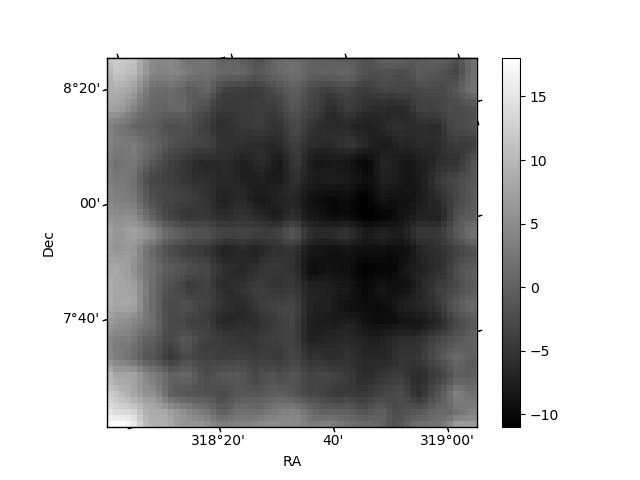
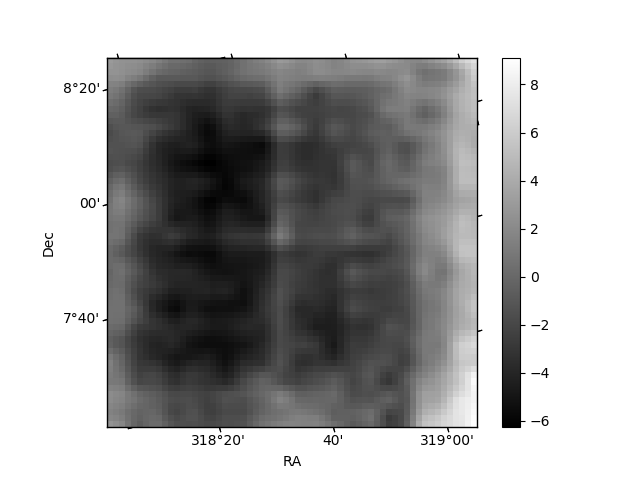
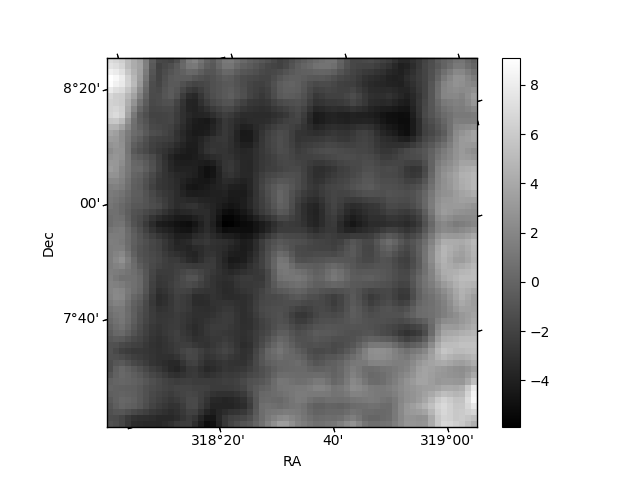
Histogram calculated using DETX and DETY for each event in the final _common_clean file
| Quadrant A | 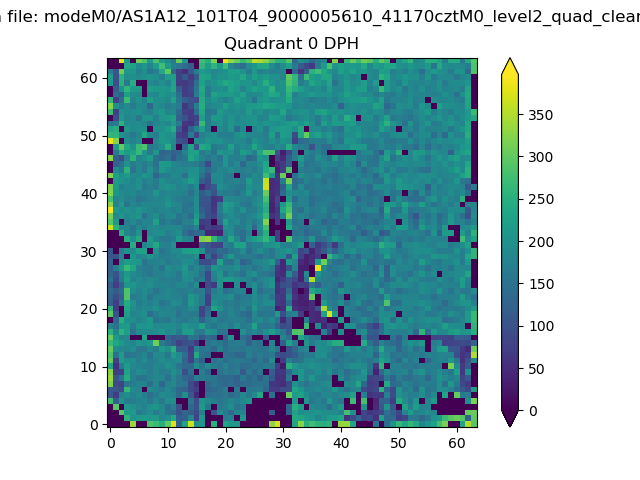 |
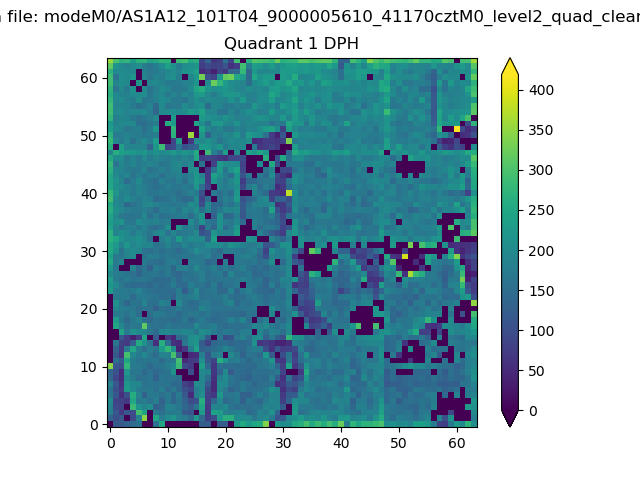 |
Quadrant B |
|---|---|---|---|
| Quadrant D |  |
 |
Quadrant C |
| Plot type | Count rate plots | Images |
|---|---|---|
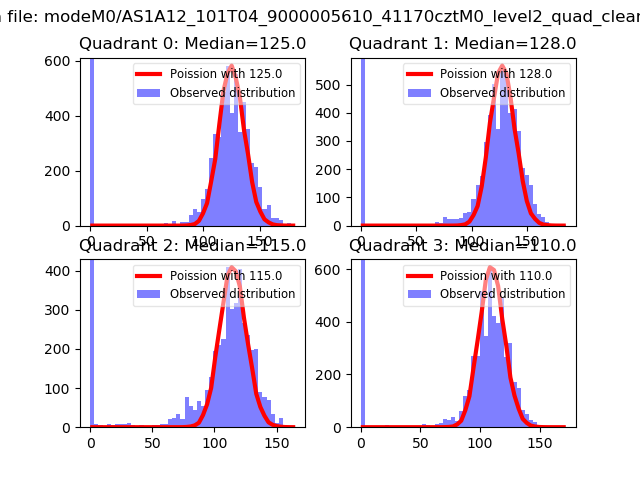
| Comparison with Poisson distribution Blue bars denote a histogram of data divided into 1 sec bins. Red curve is a Poisson curve with rate = median count rate of data. |
 |
 |
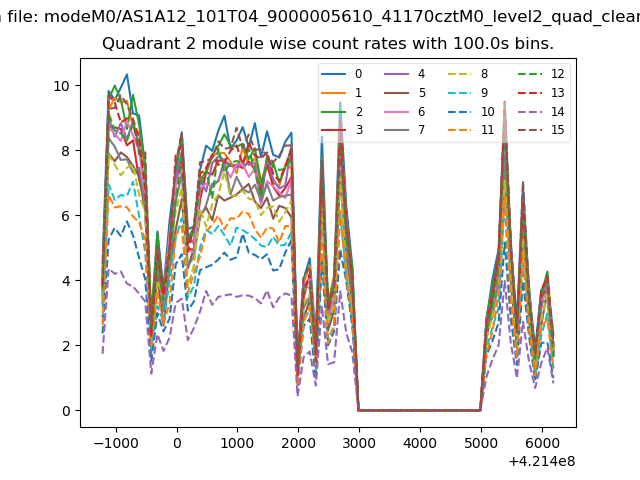
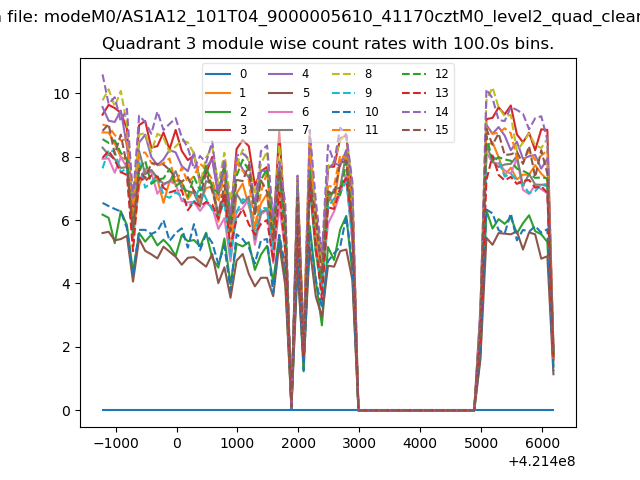
| Quadrant-wise count rates Data is divided into 100 sec bins |
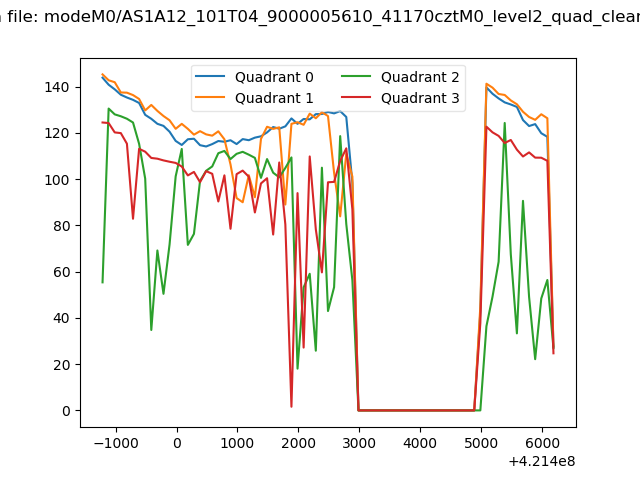 |
|
| Module-wise count rates for Quadrant A Data is divided into 100 sec bins |
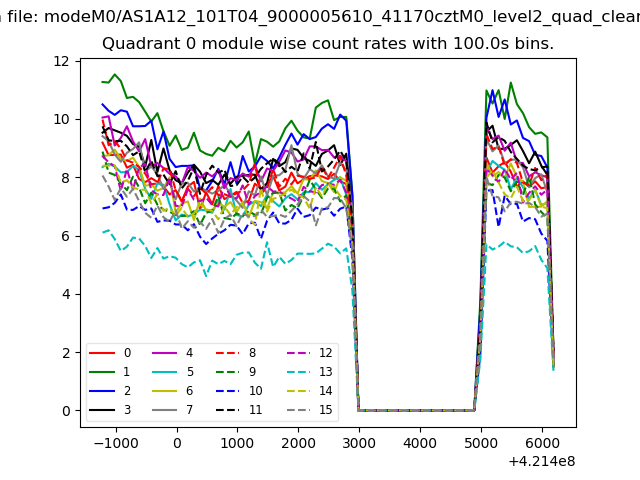 |
 |
| Module-wise count rates for Quadrant B Data is divided into 100 sec bins |
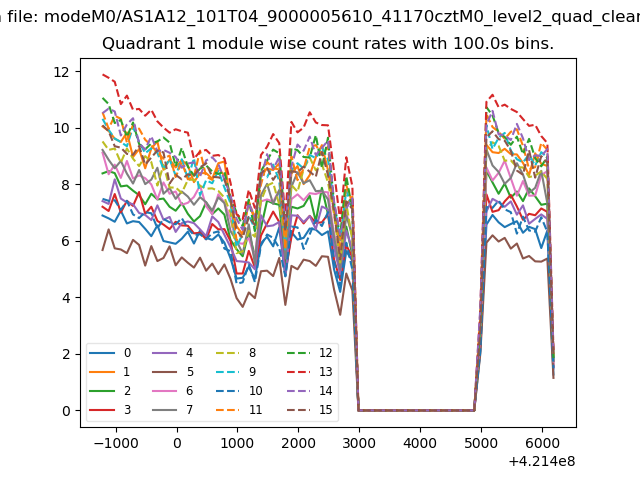 |
 |
| Module-wise count rates for Quadrant C Data is divided into 100 sec bins |
 |
 |
| Module-wise count rates for Quadrant D Data is divided into 100 sec bins |
 |
 |
| Parameter | Plot |
|---|---|
| CZT HV Monitor | 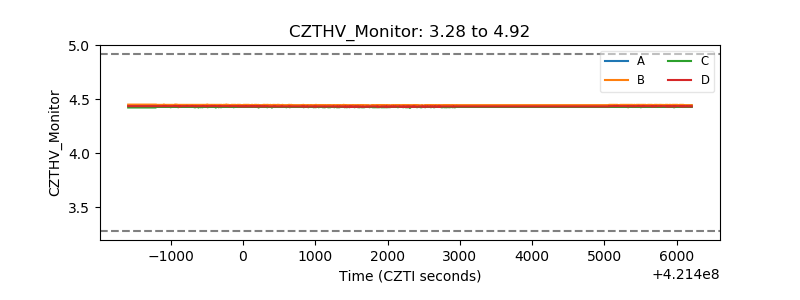 |
| D_VDD | 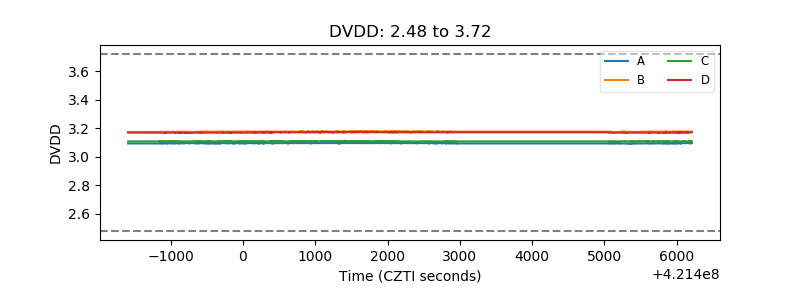 |
| Temperature 1 | 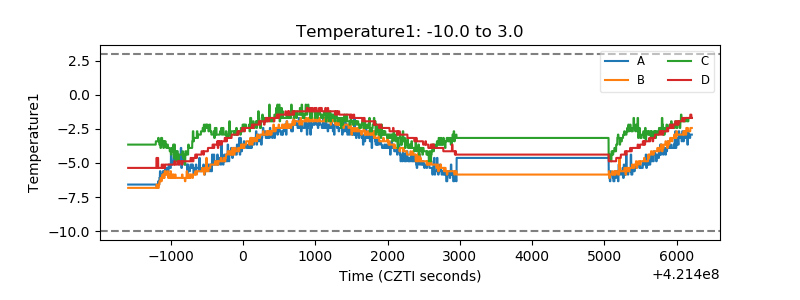 |
| Veto HV Monitor | 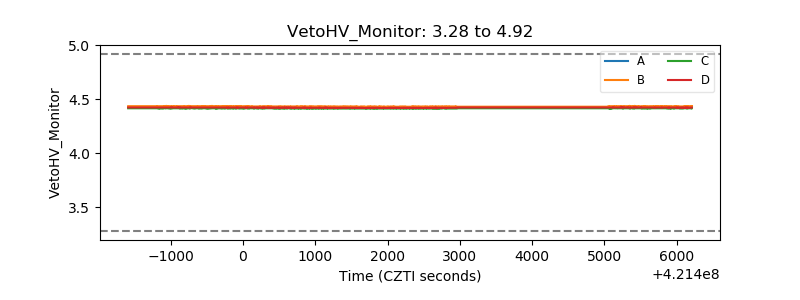 |
| Veto LLD | 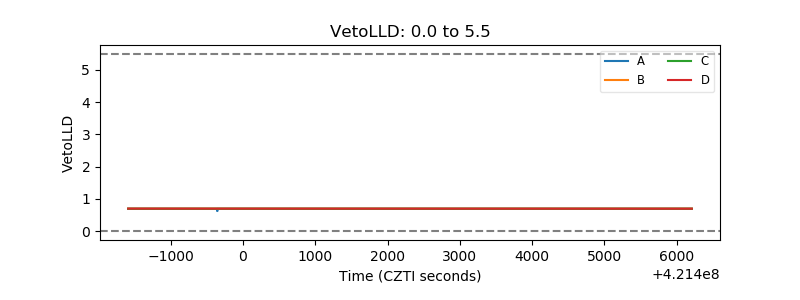 |
| Alpha Counter | 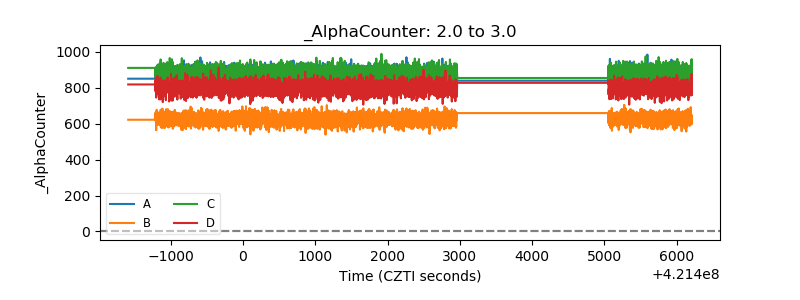 |
| _CPM_Rate | 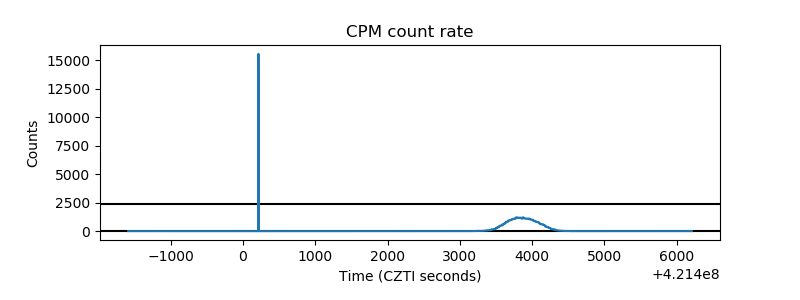 |
| CZT Counter | 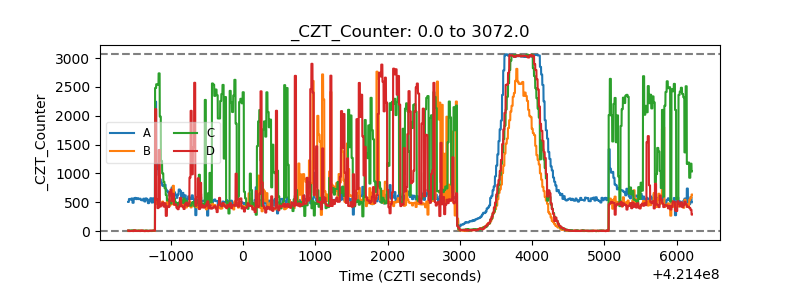 |
| +2.5 Volts monitor | 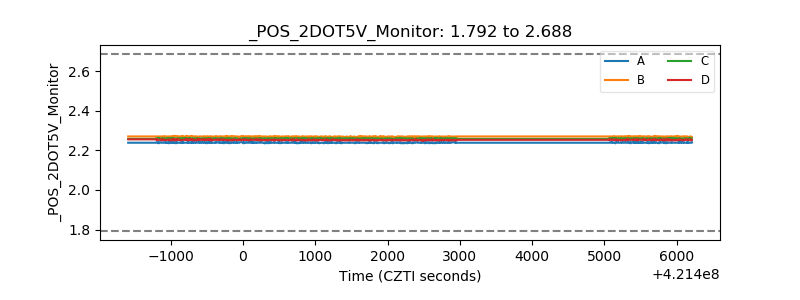 |
| +5 Volts monitor | 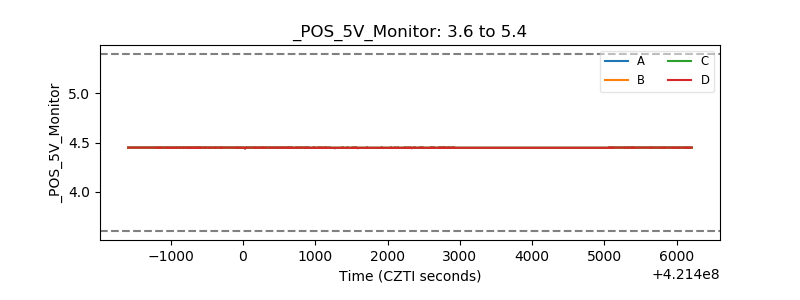 |
| _ROLL_ROT | 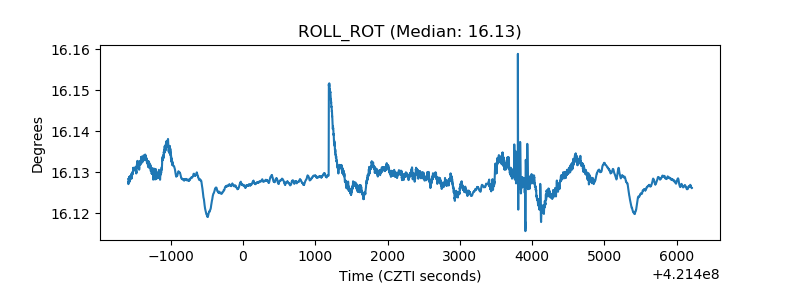 |
| _Roll_DEC | 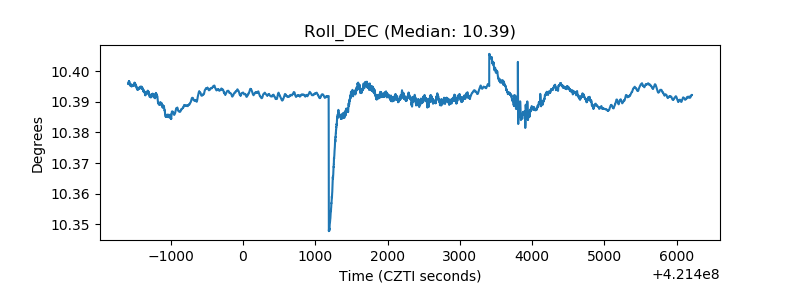 |
| _Roll_RA | 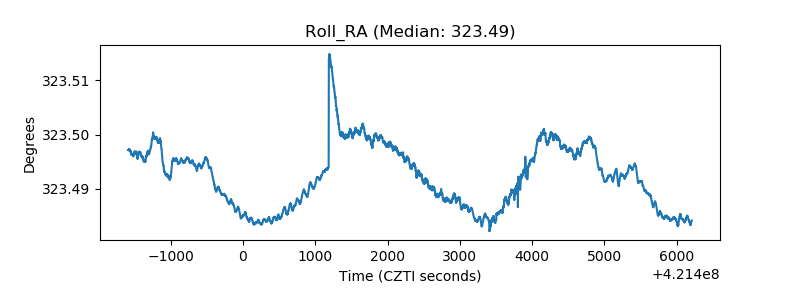 |
| Veto Counter | 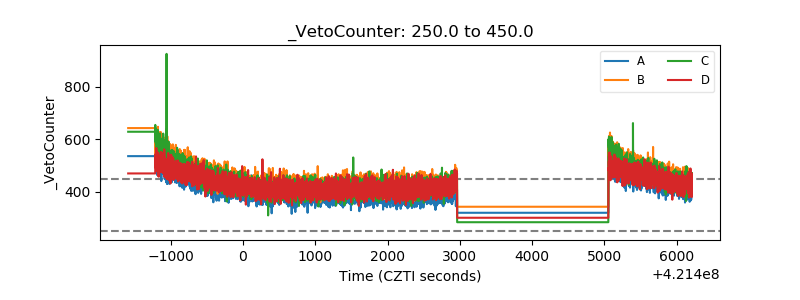 |