| Param | Original file | Final file |
|---|---|---|
| Filename | modeM0/AS1A12_101T04_9000005610_41171cztM0_level2.fits | modeM0/AS1A12_101T04_9000005610_41171cztM0_level2_quad_clean.evt |
| Size (bytes) | 451,935,360 | 76,032,000 |
| Size | 431.0 MB | 72.5 MB |
| Events in quadrant A | 2,634,155 | 577,729 |
| Events in quadrant B | 3,311,095 | 565,461 |
| Events in quadrant C | 6,953,393 | 350,737 |
| Events in quadrant D | 3,466,857 | 480,429 |
| Mode M0 | |||
|---|---|---|---|
| Quadrant | BADHDUFLAG | Total packets | Discarded packets |
| A | 0 | 10437 | 2 |
| B | 0 | 12813 | 1 |
| C | 0 | 23861 | 1 |
| D | 0 | 13380 | 1 |
| Mode SS | |||
|---|---|---|---|
| Quadrant | BADHDUFLAG | Total packets | Discarded packets |
| A | 0 | 94 | 0 |
| B | 0 | 94 | 0 |
| C | 0 | 94 | 0 |
| D | 0 | 94 | 0 |
| Mode M9 | |||
|---|---|---|---|
| Quadrant | BADHDUFLAG | Total packets | Discarded packets |
| A | 0 | 22 | 0 |
| B | 0 | 22 | 0 |
| C | 0 | 22 | 0 |
| D | 0 | 22 | 0 |
| Quadrant | Total seconds | Saturated seconds | Saturation percentage |
|---|---|---|---|
| A | 4673 | 6 | 0.128397% |
| B | 4673 | 242 | 5.178686% |
| C | 4673 | 1889 | 40.423711% |
| D | 4673 | 315 | 6.740852% |
Noise dominated data is calculated using 1-second bins in cleaned event files. If a bin has >2000 counts, and if more than 50% of those come from <1% of pixels, then it is considered to be noise-dominated and hence unusable.
| Quadrant | # 1 sec bins | Bins with >0 counts | Bins with >2000 counts | High rate bins dominated by noise | Noise dominated (total time) | Noise dominated (detector-on time) | Marked lightcurve |
|---|---|---|---|---|---|---|---|
| A | 6826 | 4674 | 2 | 2 | 0.03% | 0.04% | 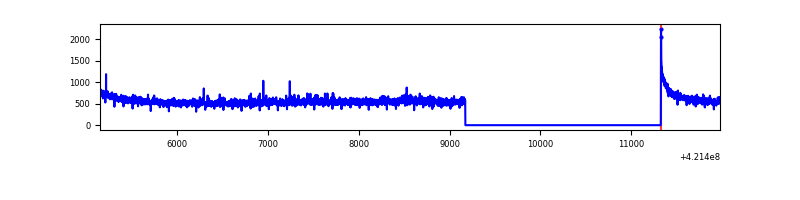 |
| B | 6826 | 4674 | 183 | 183 | 2.68% | 3.92% | 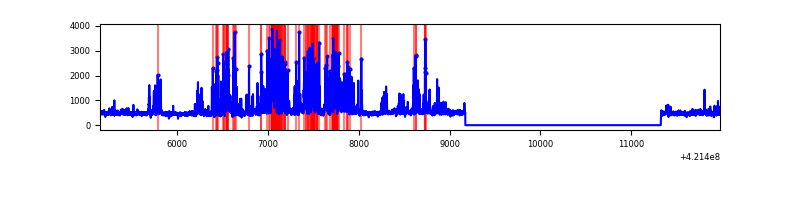 |
| C | 6826 | 4674 | 1555 | 1555 | 22.78% | 33.27% | 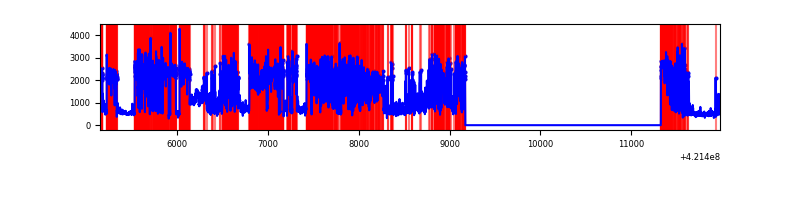 |
| D | 6826 | 4674 | 287 | 287 | 4.20% | 6.14% | 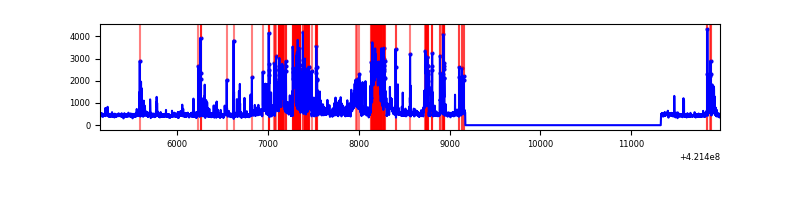 |
Top three noisy pixels from each quadrant. If the there are fewer than three noisy pixels in the level2.evt file, extra rows are filled as -1
| Pixel properties | Quadrant properties | ||||||
|---|---|---|---|---|---|---|---|
| Quadrant | DetID | PixID | Counts | Sigma | Mean | Median | Sigma |
| A | 10 | 83 | 442948 | 3909.08 | 554 | 544 | 113.2 |
| A | 12 | 189 | 24554 | 212.15 | 554 | 544 | 113.2 |
| A | 6 | 10 | 21009 | 180.83 | 554 | 544 | 113.2 |
| B | 0 | 186 | 518791 | 4988.37 | 534 | 521 | 103.9 |
| B | 0 | 245 | 475559 | 4572.26 | 534 | 521 | 103.9 |
| B | 5 | 252 | 75548 | 722.14 | 534 | 521 | 103.9 |
| C | 9 | 54 | 4890954 | 48845.86 | 430 | 433 | 100.1 |
| C | 0 | 10 | 209244 | 2085.58 | 430 | 433 | 100.1 |
| C | 15 | 214 | 168719 | 1680.82 | 430 | 433 | 100.1 |
| D | 13 | 249 | 1104815 | 8543.8 | 518 | 505 | 129.3 |
| D | 2 | 249 | 180921 | 1395.84 | 518 | 505 | 129.3 |
| D | 2 | 16 | 132505 | 1021.25 | 518 | 505 | 129.3 |
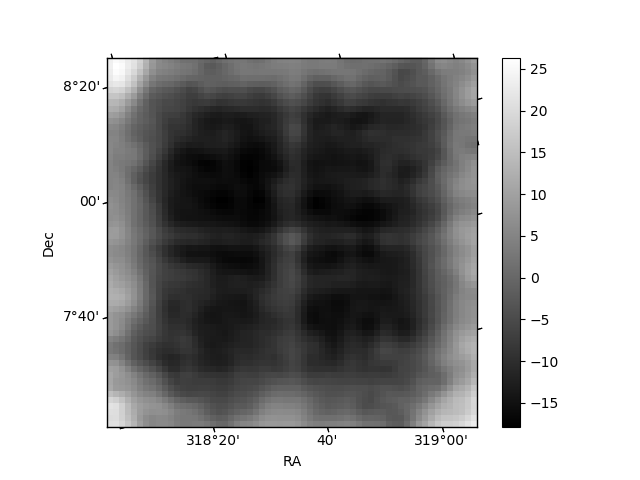
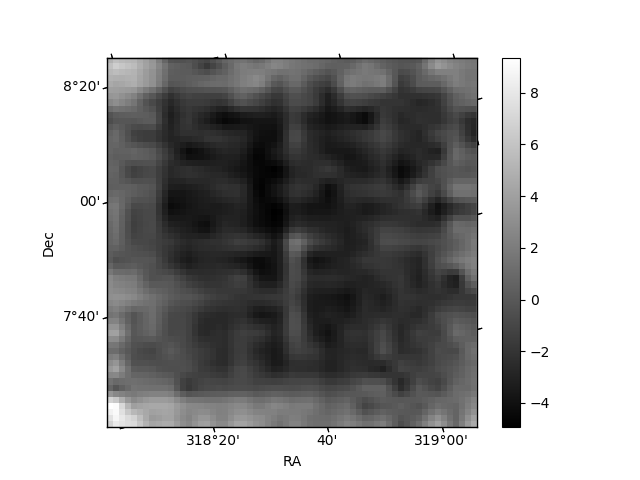
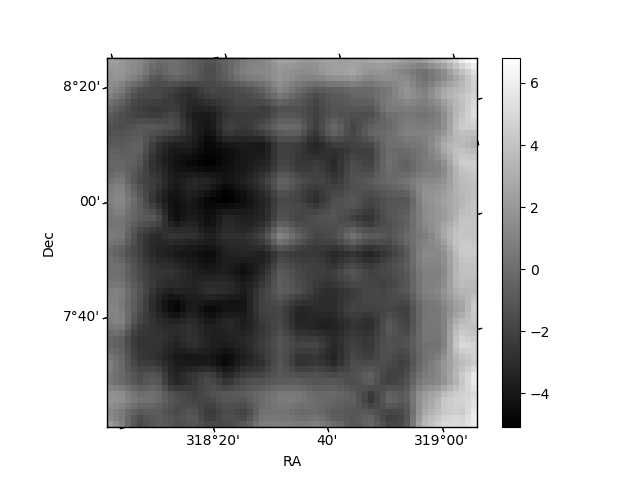
Histogram calculated using DETX and DETY for each event in the final _common_clean file
| Quadrant A | 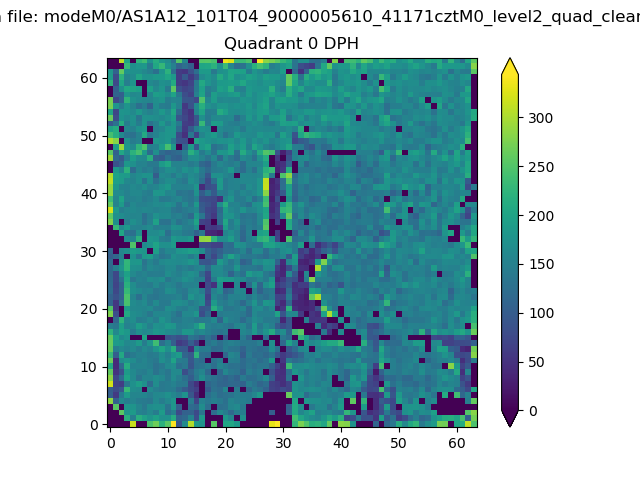 |
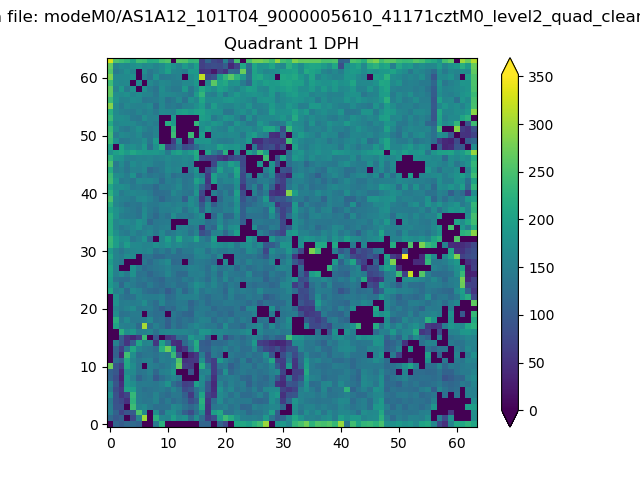 |
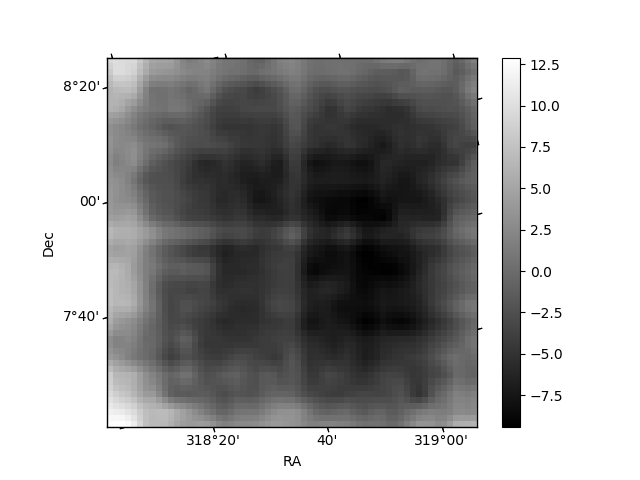
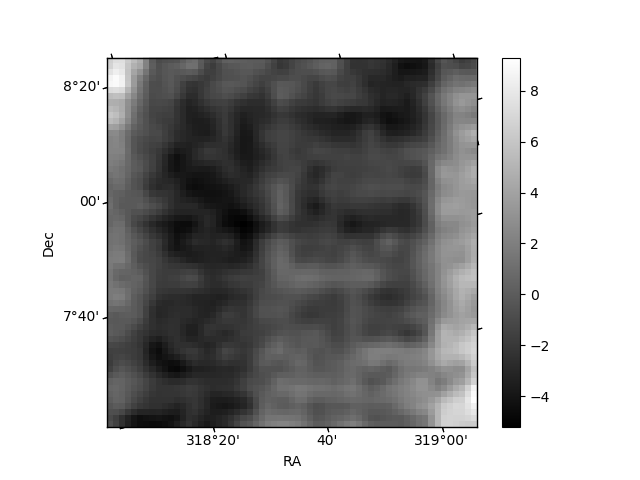
Quadrant B |
|---|---|---|---|
| Quadrant D | 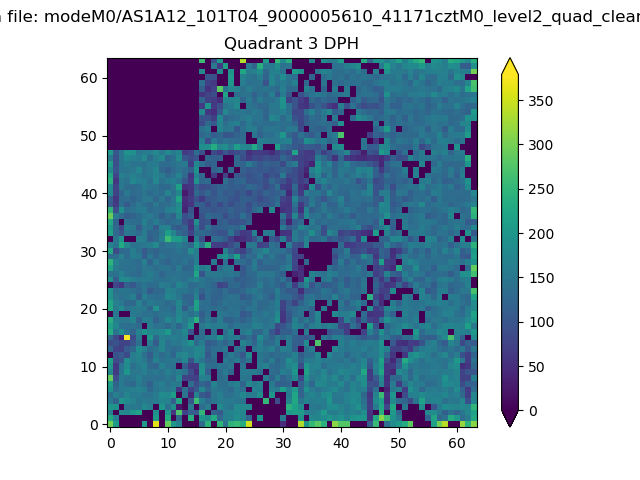 |
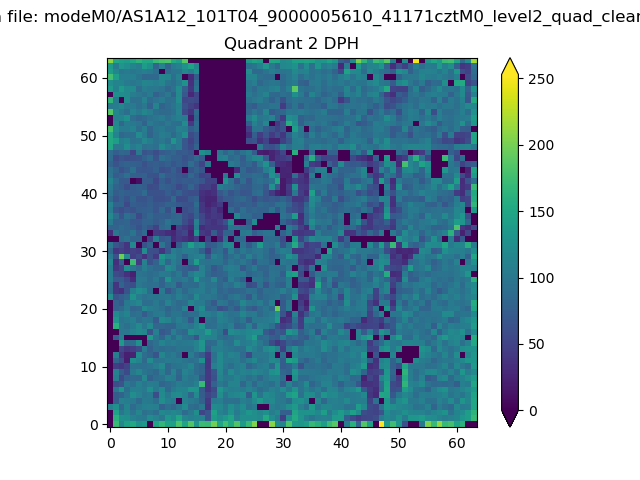 |
Quadrant C |
| Plot type | Count rate plots | Images |
|---|---|---|
| Comparison with Poisson distribution Blue bars denote a histogram of data divided into 1 sec bins. Red curve is a Poisson curve with rate = median count rate of data. |
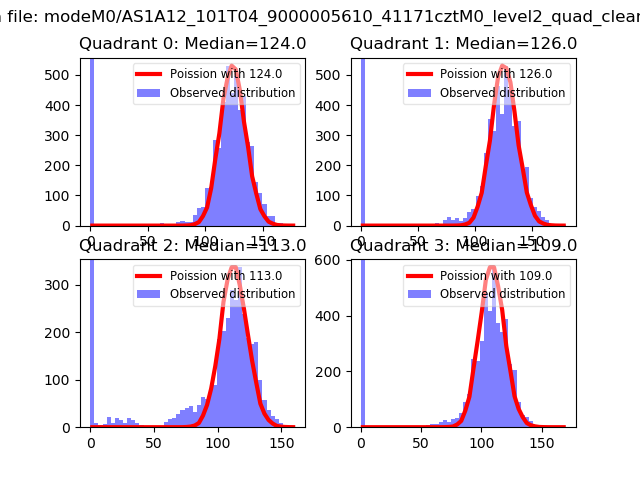 |
 |
| Quadrant-wise count rates Data is divided into 100 sec bins |
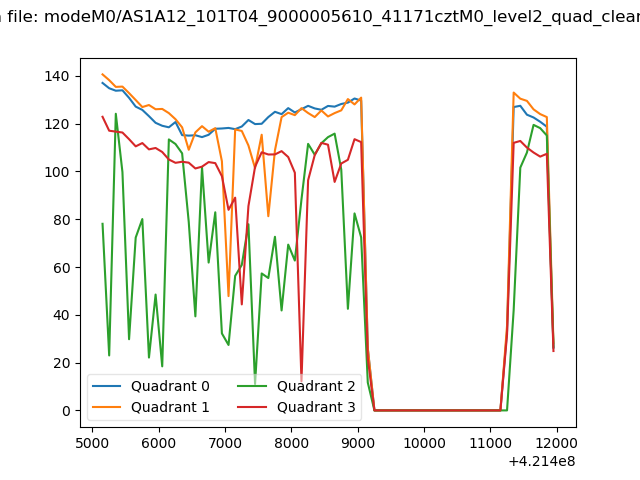 |
|
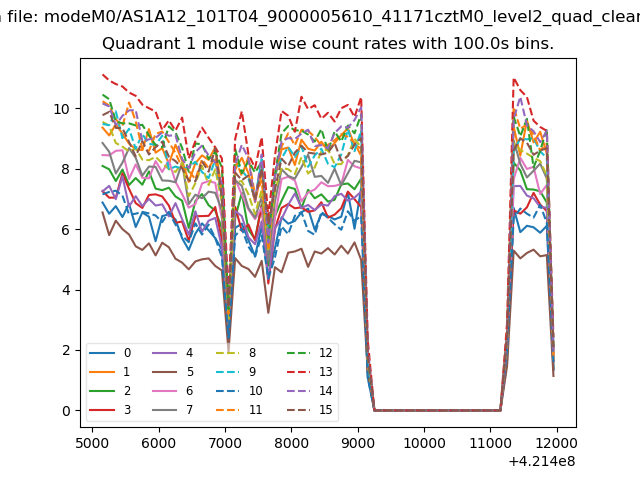
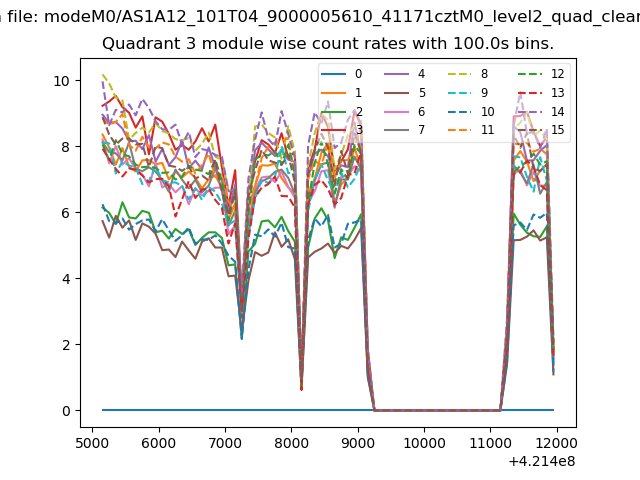
| Module-wise count rates for Quadrant A Data is divided into 100 sec bins |
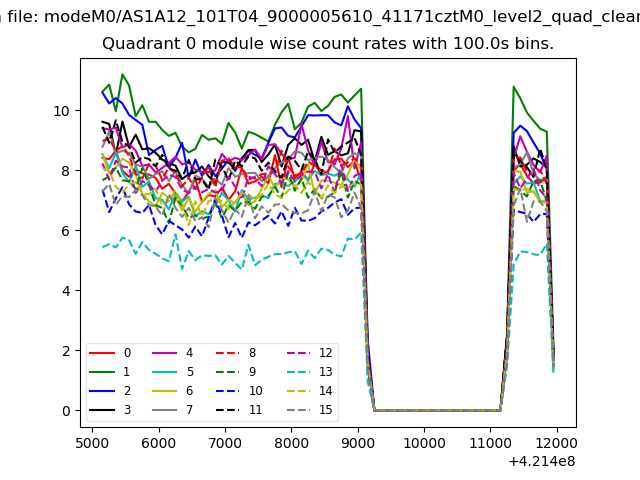 |
 |
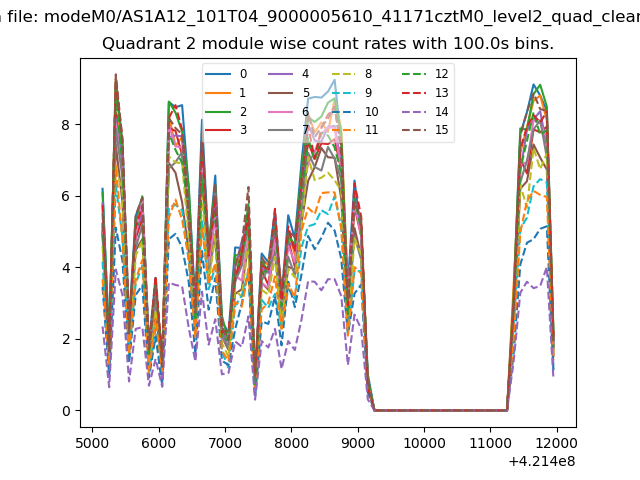
| Module-wise count rates for Quadrant B Data is divided into 100 sec bins |
 |
 |
| Module-wise count rates for Quadrant C Data is divided into 100 sec bins |
 |
 |
| Module-wise count rates for Quadrant D Data is divided into 100 sec bins |
 |
 |
| Parameter | Plot |
|---|---|
| CZT HV Monitor | 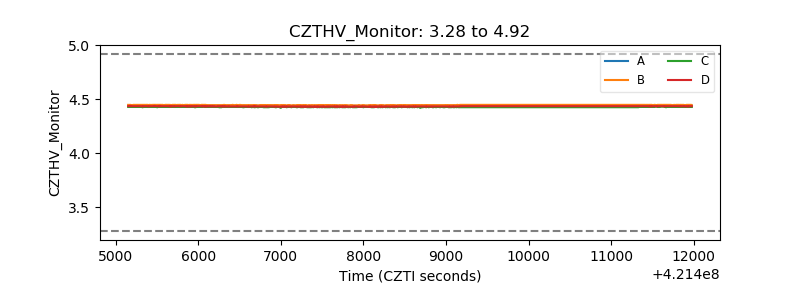 |
| D_VDD | 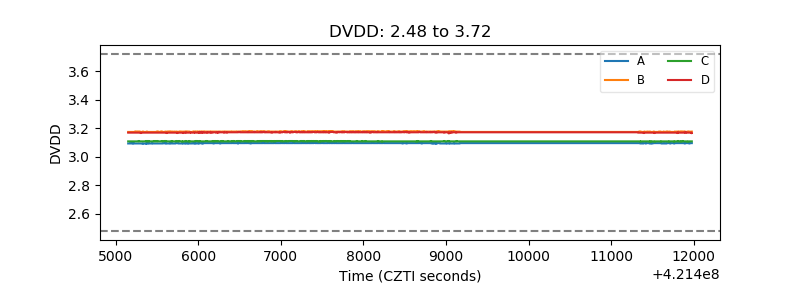 |
| Temperature 1 | 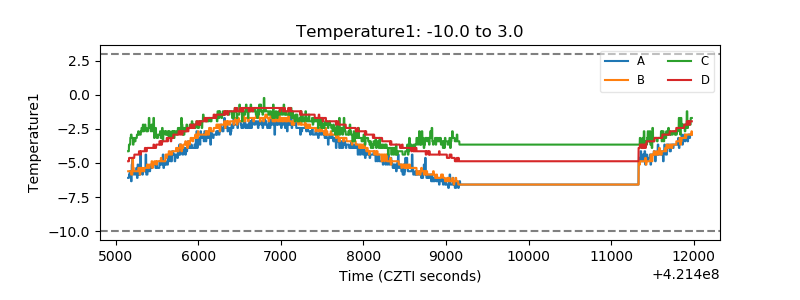 |
| Veto HV Monitor | 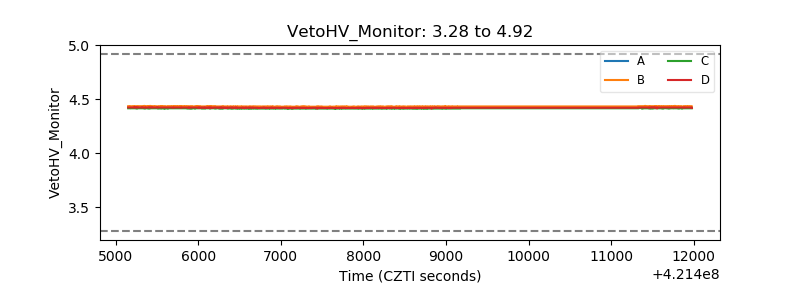 |
| Veto LLD | 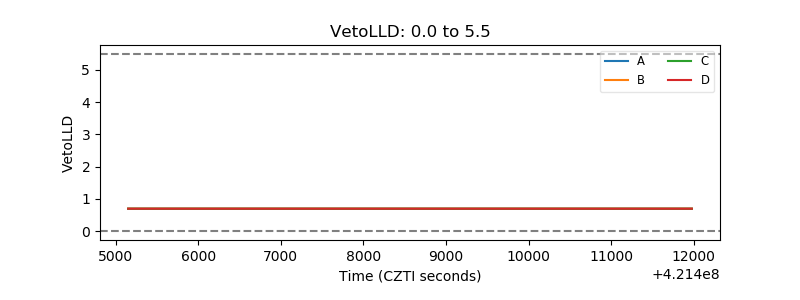 |
| Alpha Counter | 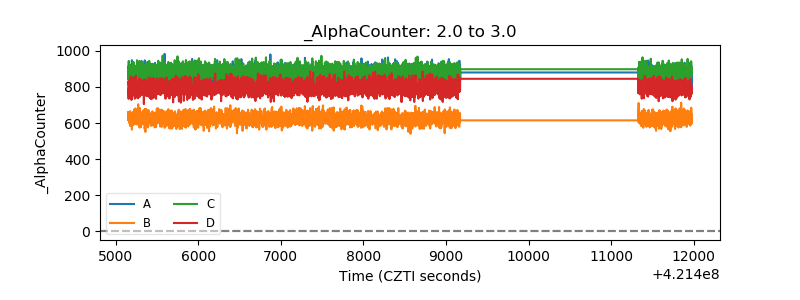 |
| _CPM_Rate | 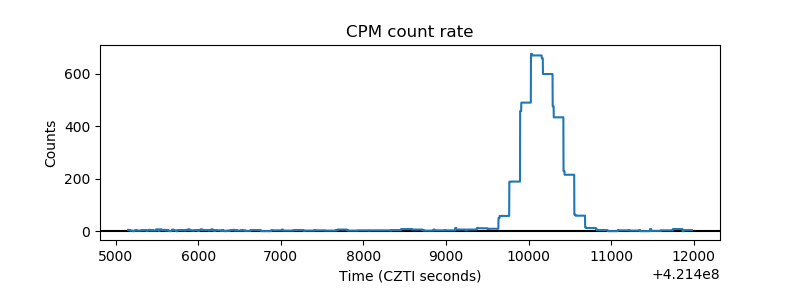 |
| CZT Counter | 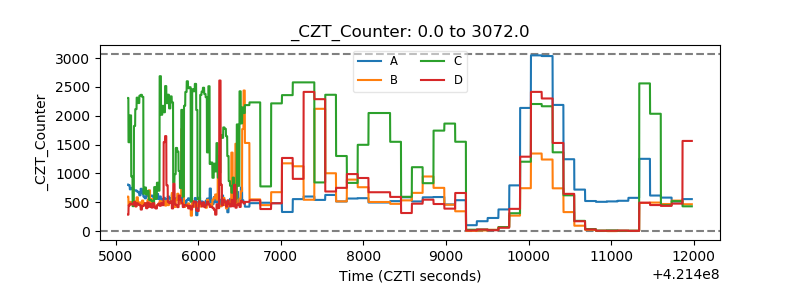 |
| +2.5 Volts monitor | 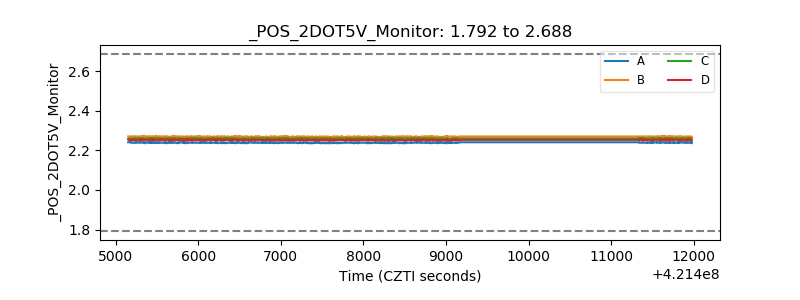 |
| +5 Volts monitor | 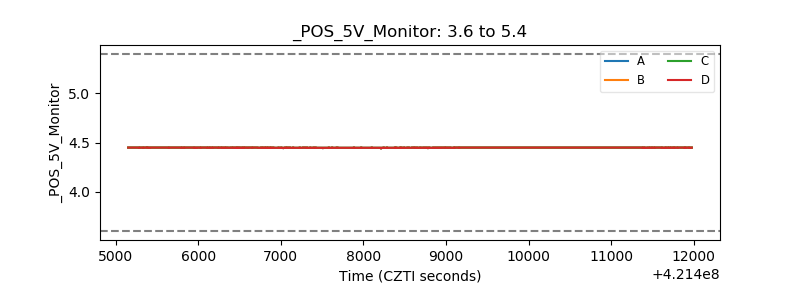 |
| _ROLL_ROT | 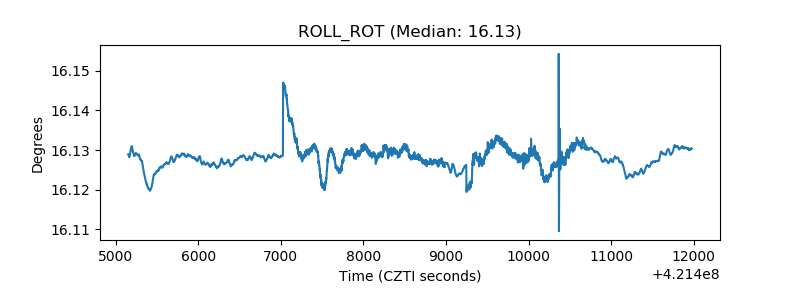 |
| _Roll_DEC | 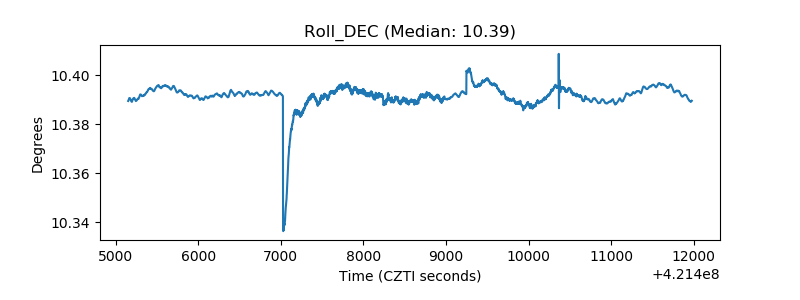 |
| _Roll_RA | 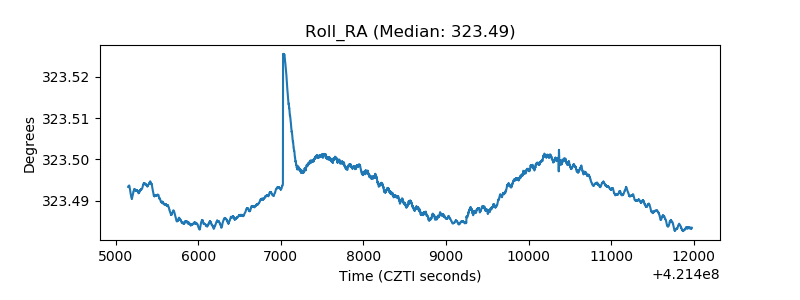 |
| Veto Counter | 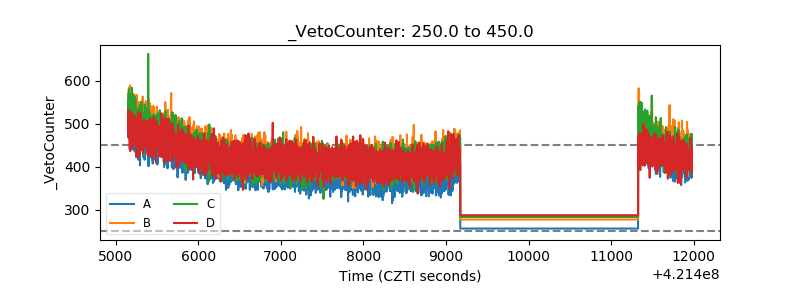 |