| Param | Original file | Final file |
|---|---|---|
| Filename | modeM0/AS1A12_101T04_9000005610_41172cztM0_level2.fits | modeM0/AS1A12_101T04_9000005610_41172cztM0_level2_quad_clean.evt |
| Size (bytes) | 1,482,577,920 | 269,712,000 |
| Size | 1.4 GB | 257.2 MB |
| Events in quadrant A | 9,251,383 | 2,005,494 |
| Events in quadrant B | 13,130,921 | 1,879,815 |
| Events in quadrant C | 18,593,066 | 1,484,741 |
| Events in quadrant D | 12,612,552 | 1,643,466 |
| Mode M0 | |||
|---|---|---|---|
| Quadrant | BADHDUFLAG | Total packets | Discarded packets |
| A | 0 | 36716 | 5 |
| B | 0 | 49888 | 12 |
| C | 0 | 66318 | 4 |
| D | 0 | 48735 | 4 |
| Mode SS | |||
|---|---|---|---|
| Quadrant | BADHDUFLAG | Total packets | Discarded packets |
| A | 0 | 342 | 0 |
| B | 0 | 342 | 0 |
| C | 0 | 342 | 0 |
| D | 0 | 342 | 0 |
| Mode M9 | |||
|---|---|---|---|
| Quadrant | BADHDUFLAG | Total packets | Discarded packets |
| A | 0 | 83 | 0 |
| B | 0 | 83 | 0 |
| C | 0 | 83 | 0 |
| D | 0 | 83 | 0 |
| Quadrant | Total seconds | Saturated seconds | Saturation percentage |
|---|---|---|---|
| A | 16721 | 29 | 0.173435% |
| B | 16720 | 1580 | 9.449761% |
| C | 16721 | 4015 | 24.011722% |
| D | 16721 | 1336 | 7.989953% |
Noise dominated data is calculated using 1-second bins in cleaned event files. If a bin has >2000 counts, and if more than 50% of those come from <1% of pixels, then it is considered to be noise-dominated and hence unusable.
| Quadrant | # 1 sec bins | Bins with >0 counts | Bins with >2000 counts | High rate bins dominated by noise | Noise dominated (total time) | Noise dominated (detector-on time) | Marked lightcurve |
|---|---|---|---|---|---|---|---|
| A | 25032 | 16725 | 7 | 7 | 0.03% | 0.04% | 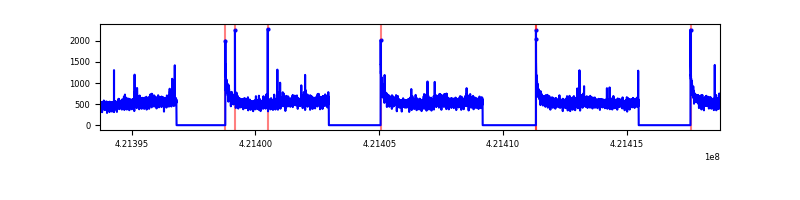 |
| B | 25031 | 16723 | 1286 | 1286 | 5.14% | 7.69% | 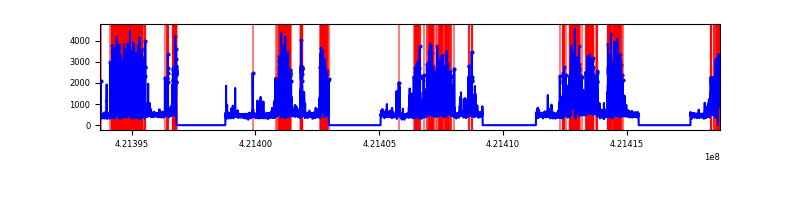 |
| C | 25032 | 16724 | 3263 | 3263 | 13.04% | 19.51% | 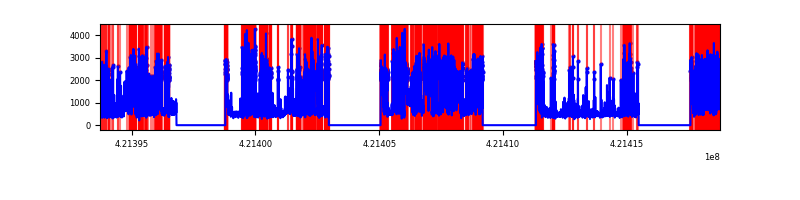 |
| D | 25032 | 16725 | 1182 | 1182 | 4.72% | 7.07% | 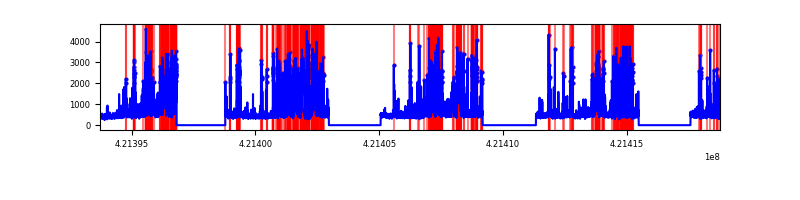 |
Top three noisy pixels from each quadrant. If the there are fewer than three noisy pixels in the level2.evt file, extra rows are filled as -1
| Pixel properties | Quadrant properties | ||||||
|---|---|---|---|---|---|---|---|
| Quadrant | DetID | PixID | Counts | Sigma | Mean | Median | Sigma |
| A | 10 | 83 | 1483976 | 3762.87 | 1961 | 1927 | 393.9 |
| A | 12 | 189 | 126373 | 315.96 | 1961 | 1927 | 393.9 |
| A | 13 | 254 | 29373 | 69.68 | 1961 | 1927 | 393.9 |
| B | 0 | 245 | 3546934 | 10051.79 | 1853 | 1806 | 352.7 |
| B | 0 | 186 | 1537214 | 4353.47 | 1853 | 1806 | 352.7 |
| B | 5 | 255 | 291780 | 822.19 | 1853 | 1806 | 352.7 |
| C | 9 | 54 | 10766365 | 28184.74 | 1663 | 1677 | 381.9 |
| C | 0 | 10 | 644386 | 1682.78 | 1663 | 1677 | 381.9 |
| C | 15 | 214 | 637972 | 1665.99 | 1663 | 1677 | 381.9 |
| D | 13 | 249 | 3862633 | 8519.36 | 1830 | 1783 | 453.2 |
| D | 2 | 249 | 785448 | 1729.24 | 1830 | 1783 | 453.2 |
| D | 2 | 16 | 358674 | 787.52 | 1830 | 1783 | 453.2 |
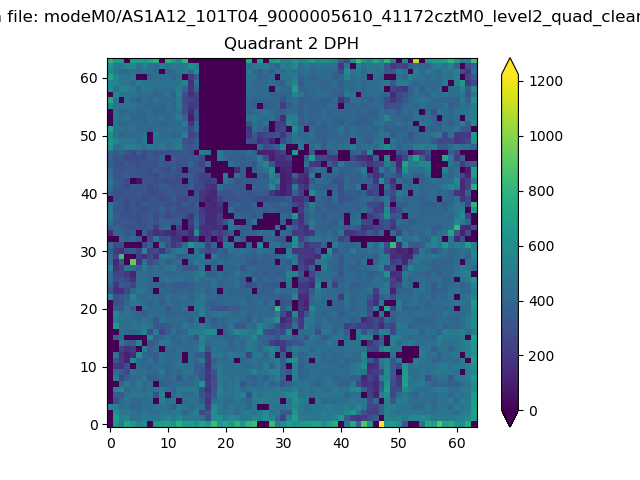
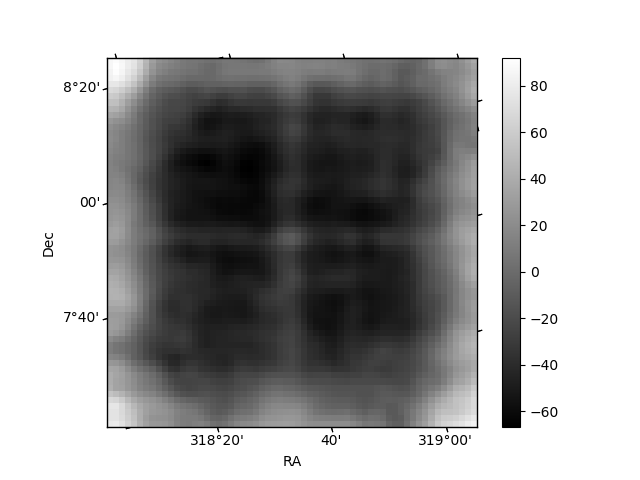
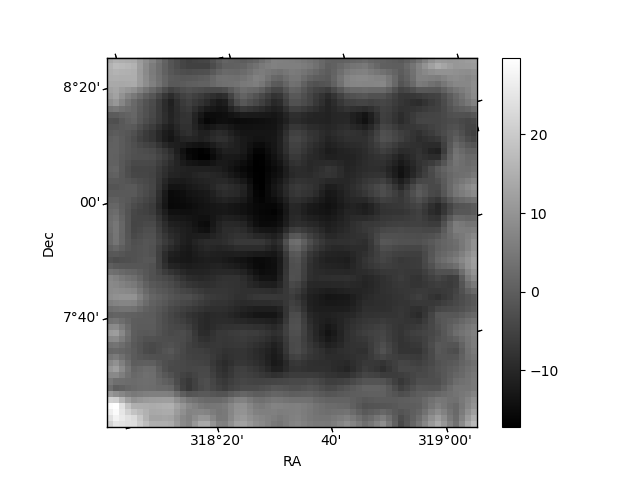
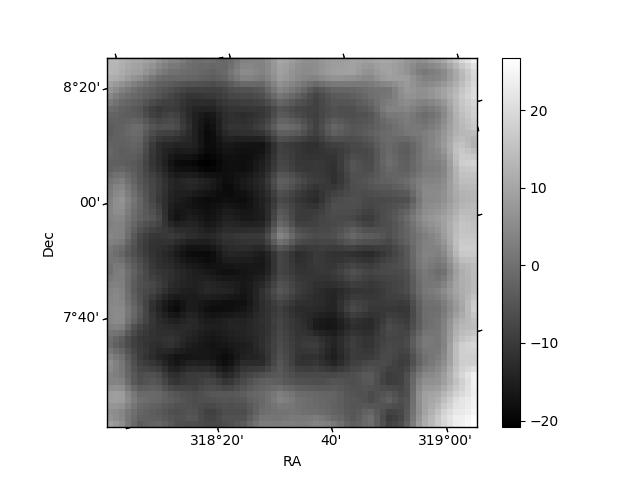
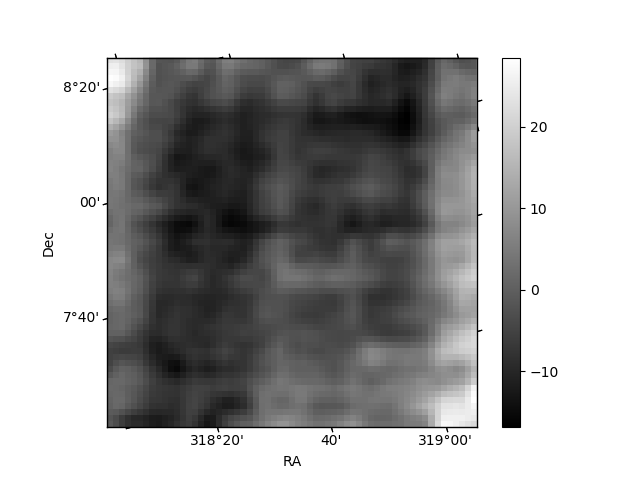
Histogram calculated using DETX and DETY for each event in the final _common_clean file
| Quadrant A | 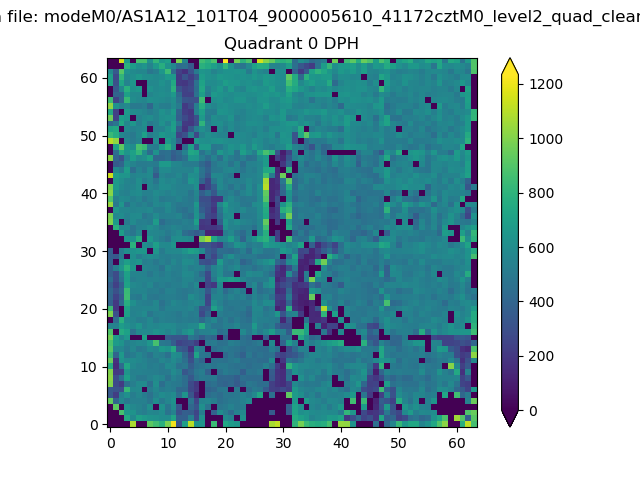 |
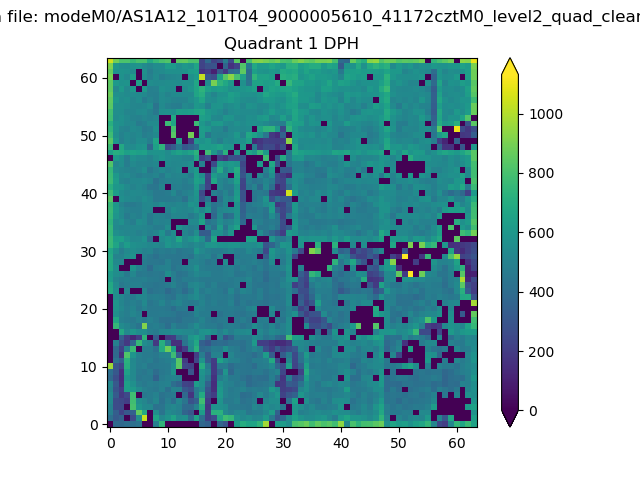 |
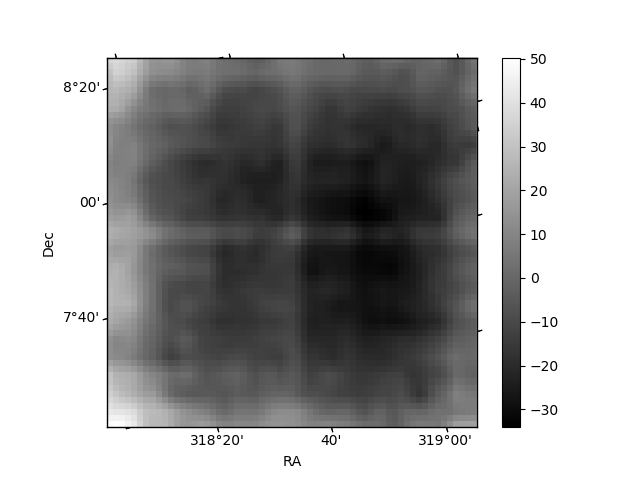
Quadrant B |
|---|---|---|---|
| Quadrant D | 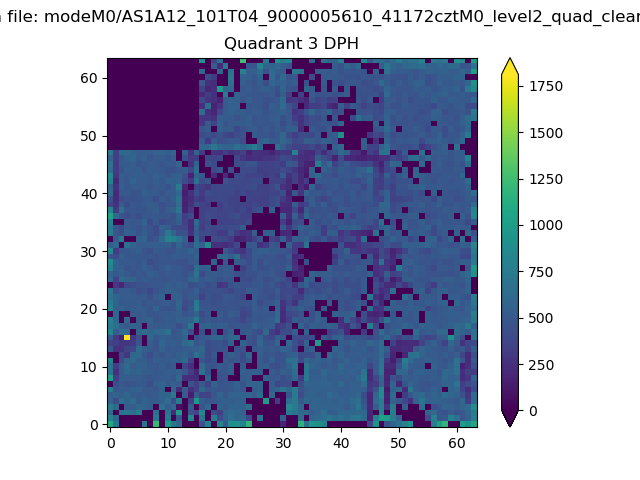 |
 |
Quadrant C |
| Plot type | Count rate plots | Images |
|---|---|---|
| Comparison with Poisson distribution Blue bars denote a histogram of data divided into 1 sec bins. Red curve is a Poisson curve with rate = median count rate of data. |
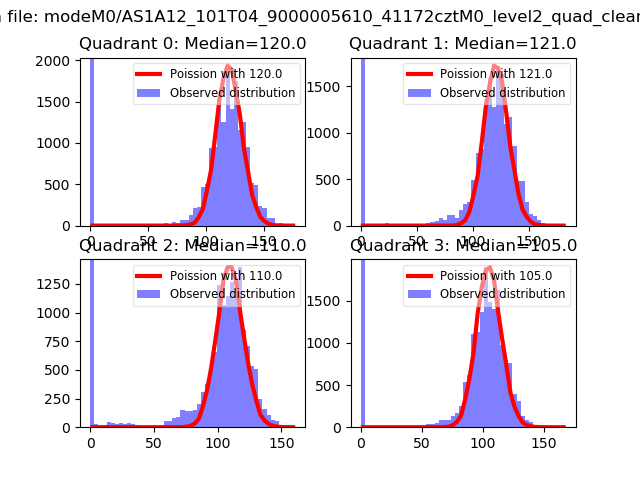 |
 |
| Quadrant-wise count rates Data is divided into 100 sec bins |
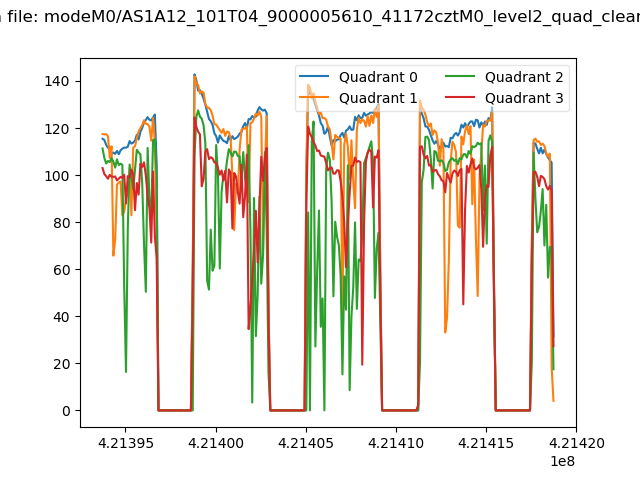 |
|
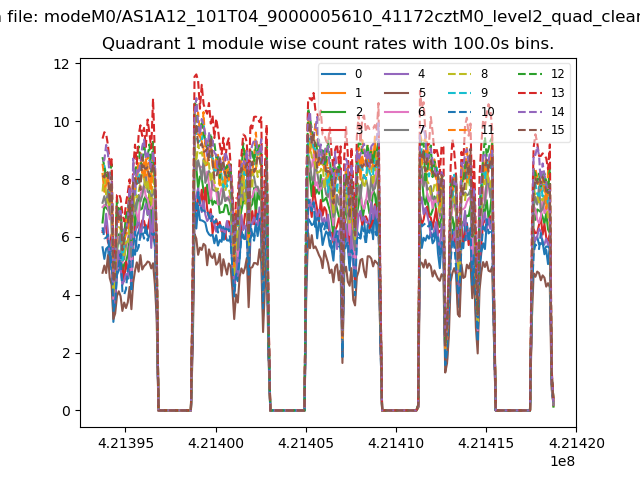
| Module-wise count rates for Quadrant A Data is divided into 100 sec bins |
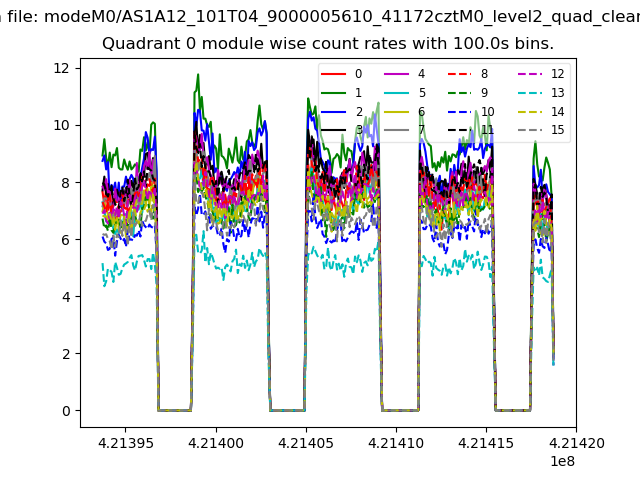 |
 |
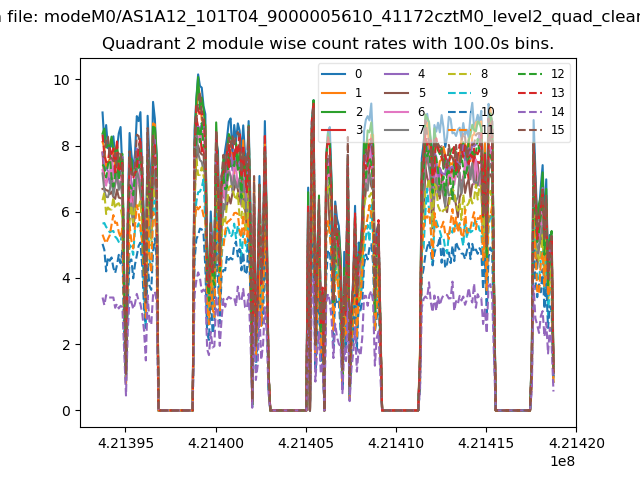
| Module-wise count rates for Quadrant B Data is divided into 100 sec bins |
 |
 |
| Module-wise count rates for Quadrant C Data is divided into 100 sec bins |
 |
 |
| Module-wise count rates for Quadrant D Data is divided into 100 sec bins |
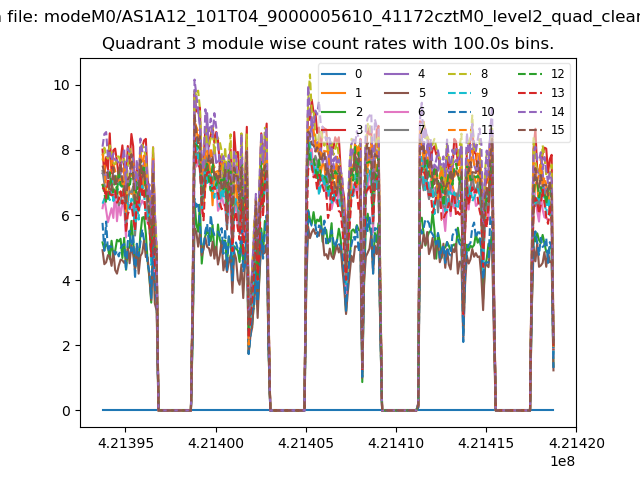 |
 |
| Parameter | Plot |
|---|---|
| CZT HV Monitor | 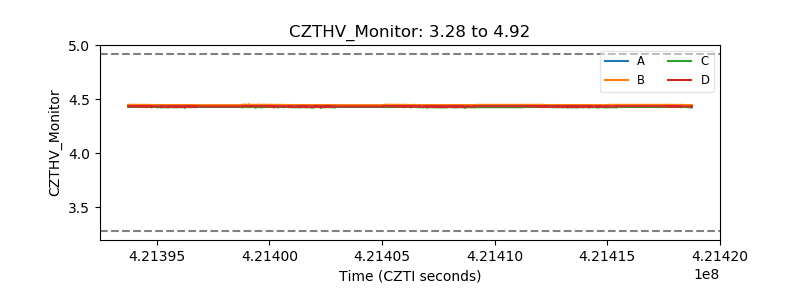 |
| D_VDD | 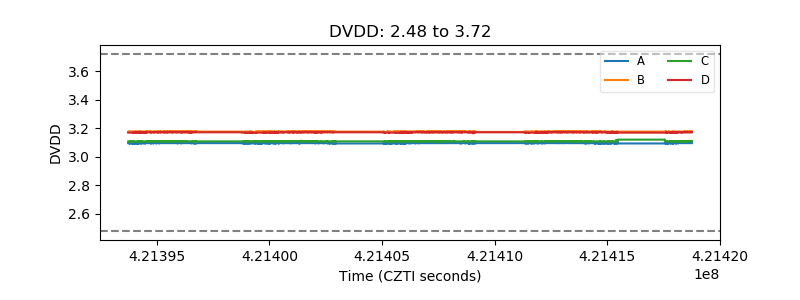 |
| Temperature 1 | 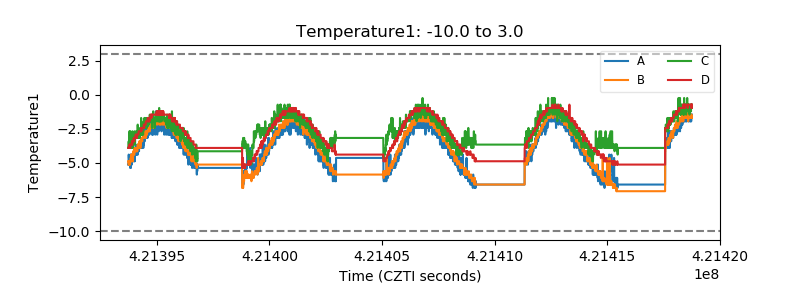 |
| Veto HV Monitor | 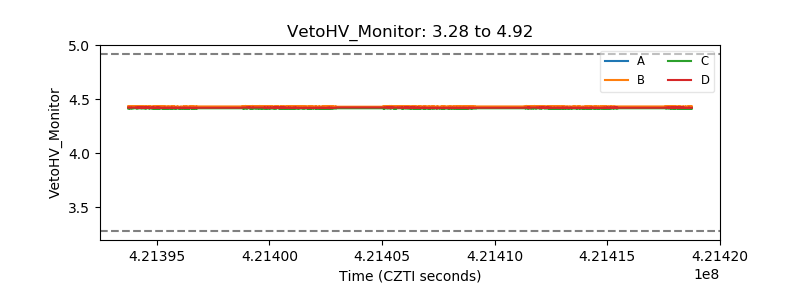 |
| Veto LLD | 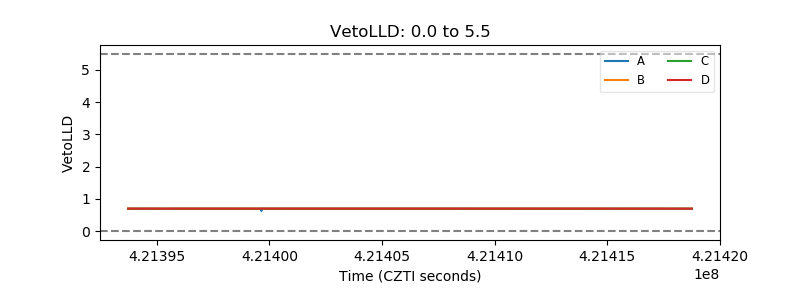 |
| Alpha Counter | 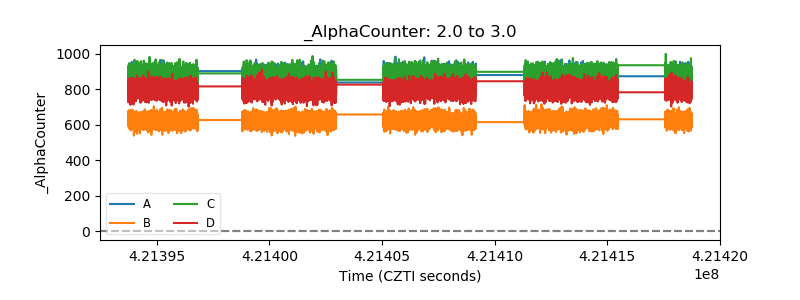 |
| _CPM_Rate |  |
| CZT Counter | 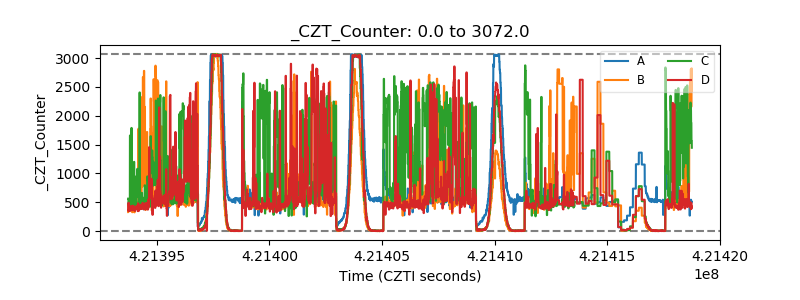 |
| +2.5 Volts monitor | 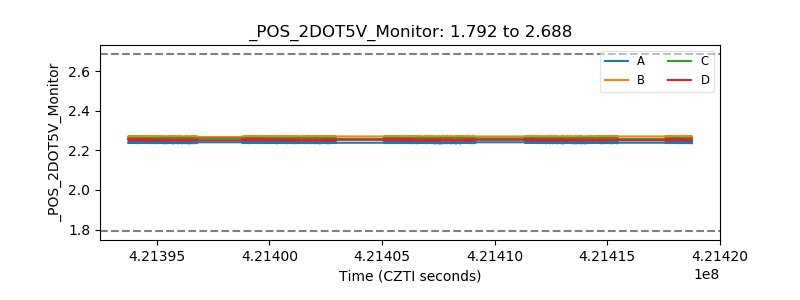 |
| +5 Volts monitor | 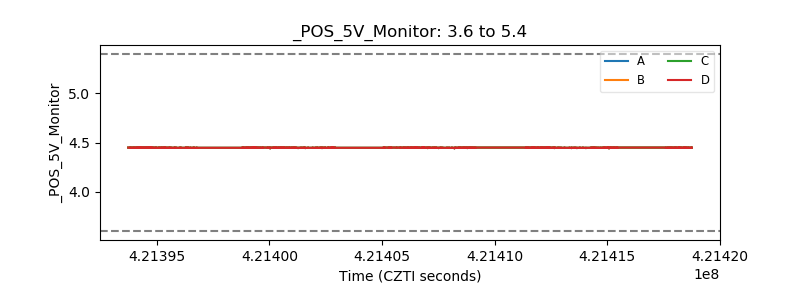 |
| _ROLL_ROT | 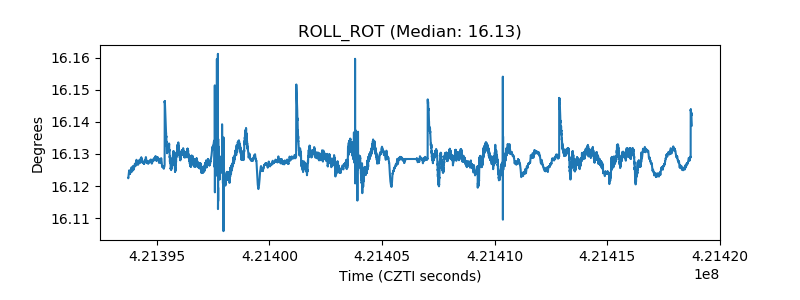 |
| _Roll_DEC | 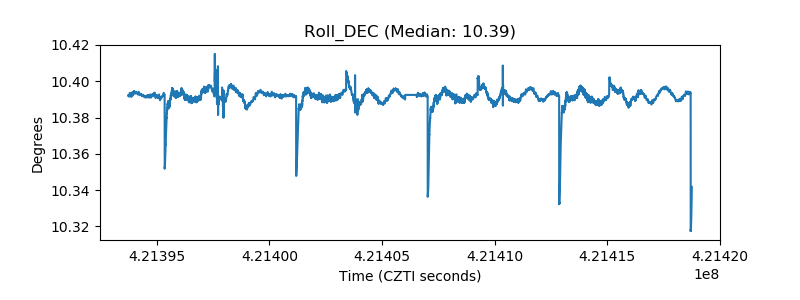 |
| _Roll_RA | 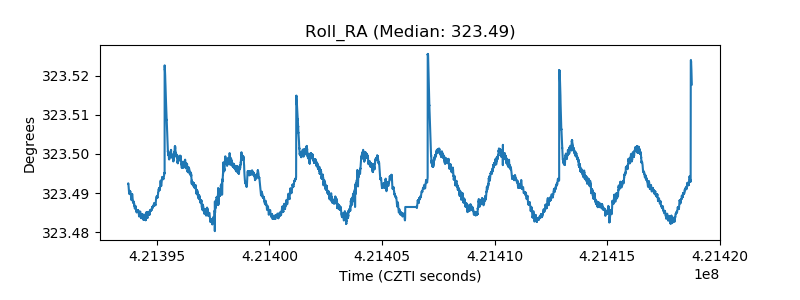 |
| Veto Counter | 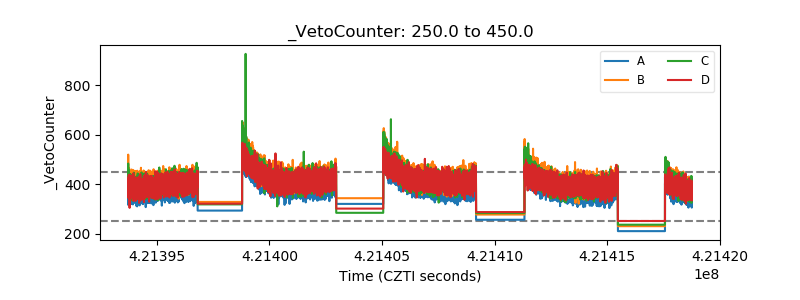 |