| Param | Original file | Final file |
|---|---|---|
| Filename | modeM0/AS1A12_101T04_9000005610_41173cztM0_level2.fits | modeM0/AS1A12_101T04_9000005610_41173cztM0_level2_quad_clean.evt |
| Size (bytes) | 540,204,480 | 79,937,280 |
| Size | 515.2 MB | 76.2 MB |
| Events in quadrant A | 2,920,152 | 600,262 |
| Events in quadrant B | 4,568,172 | 554,495 |
| Events in quadrant C | 8,596,052 | 374,066 |
| Events in quadrant D | 3,497,482 | 517,625 |
| Mode M0 | |||
|---|---|---|---|
| Quadrant | BADHDUFLAG | Total packets | Discarded packets |
| A | 0 | 11705 | 3 |
| B | 0 | 17206 | 2 |
| C | 0 | 29220 | 2 |
| D | 0 | 14092 | 2 |
| Mode SS | |||
|---|---|---|---|
| Quadrant | BADHDUFLAG | Total packets | Discarded packets |
| A | 0 | 108 | 0 |
| B | 0 | 108 | 0 |
| C | 0 | 108 | 0 |
| D | 0 | 108 | 0 |
| Mode M9 | |||
|---|---|---|---|
| Quadrant | BADHDUFLAG | Total packets | Discarded packets |
| A | 0 | 27 | 0 |
| B | 0 | 27 | 0 |
| C | 0 | 27 | 0 |
| D | 0 | 28 | 0 |
| Quadrant | Total seconds | Saturated seconds | Saturation percentage |
|---|---|---|---|
| A | 5340 | 16 | 0.299625% |
| B | 5340 | 633 | 11.853933% |
| C | 5340 | 2222 | 41.610487% |
| D | 5340 | 235 | 4.400749% |
Noise dominated data is calculated using 1-second bins in cleaned event files. If a bin has >2000 counts, and if more than 50% of those come from <1% of pixels, then it is considered to be noise-dominated and hence unusable.
| Quadrant | # 1 sec bins | Bins with >0 counts | Bins with >2000 counts | High rate bins dominated by noise | Noise dominated (total time) | Noise dominated (detector-on time) | Marked lightcurve |
|---|---|---|---|---|---|---|---|
| A | 7283 | 5341 | 3 | 3 | 0.04% | 0.06% | 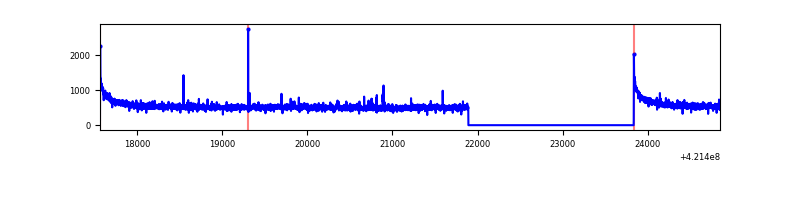 |
| B | 7283 | 5341 | 538 | 538 | 7.39% | 10.07% | 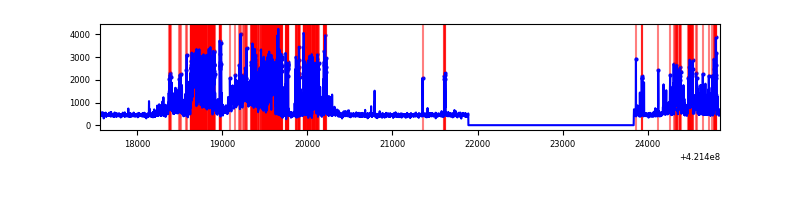 |
| C | 7282 | 5339 | 1905 | 1905 | 26.16% | 35.68% | 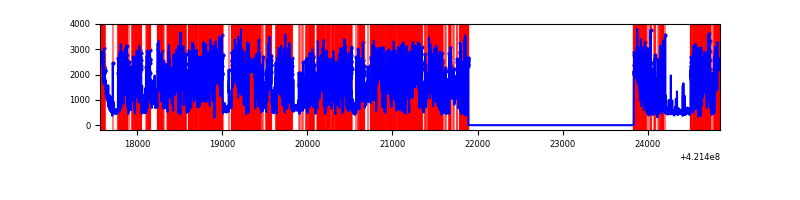 |
| D | 7282 | 5340 | 203 | 203 | 2.79% | 3.80% | 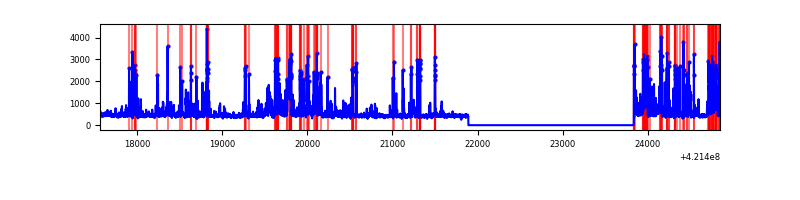 |
Top three noisy pixels from each quadrant. If the there are fewer than three noisy pixels in the level2.evt file, extra rows are filled as -1
| Pixel properties | Quadrant properties | ||||||
|---|---|---|---|---|---|---|---|
| Quadrant | DetID | PixID | Counts | Sigma | Mean | Median | Sigma |
| A | 10 | 83 | 546581 | 4448.58 | 599 | 587 | 122.7 |
| A | 12 | 189 | 43662 | 350.96 | 599 | 587 | 122.7 |
| A | 13 | 254 | 9272 | 70.76 | 599 | 587 | 122.7 |
| B | 0 | 186 | 1038960 | 9468.0 | 562 | 547 | 109.7 |
| B | 0 | 245 | 949524 | 8652.54 | 562 | 547 | 109.7 |
| B | 0 | 229 | 207837 | 1890.02 | 562 | 547 | 109.7 |
| C | 9 | 54 | 6129409 | 52805.51 | 497 | 500 | 116.1 |
| C | 0 | 10 | 298643 | 2568.74 | 497 | 500 | 116.1 |
| C | 15 | 214 | 201127 | 1728.56 | 497 | 500 | 116.1 |
| D | 13 | 249 | 827502 | 5820.55 | 572 | 555 | 142.1 |
| D | 2 | 249 | 231037 | 1622.27 | 572 | 555 | 142.1 |
| D | 12 | 233 | 180430 | 1266.07 | 572 | 555 | 142.1 |
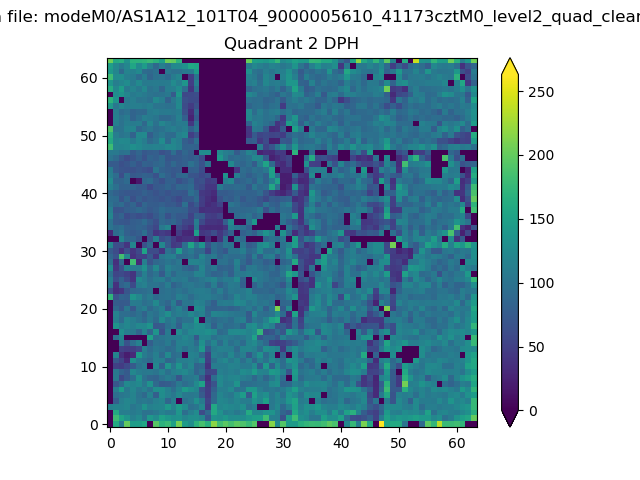
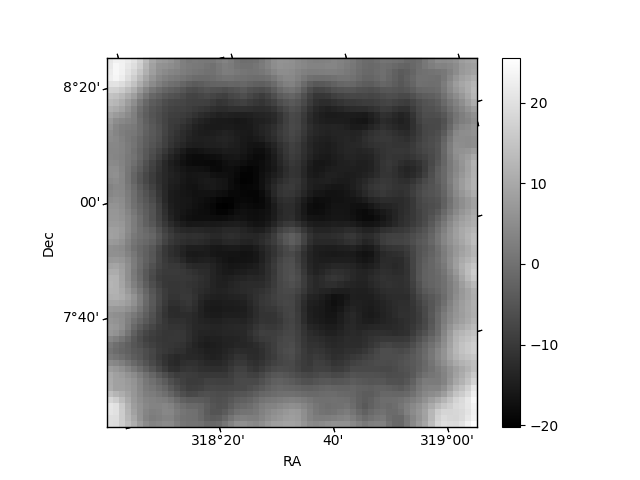
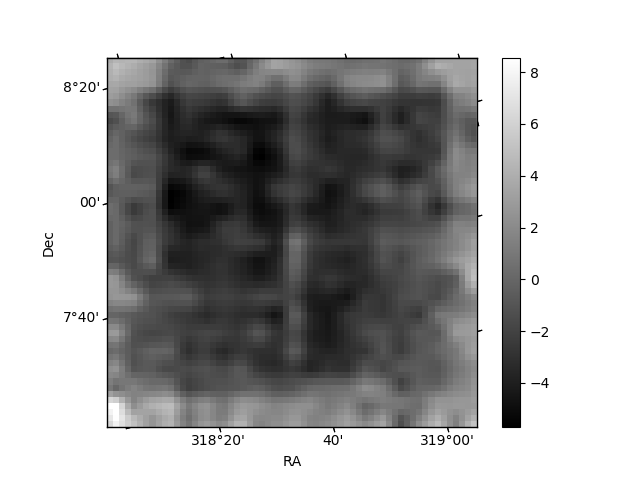
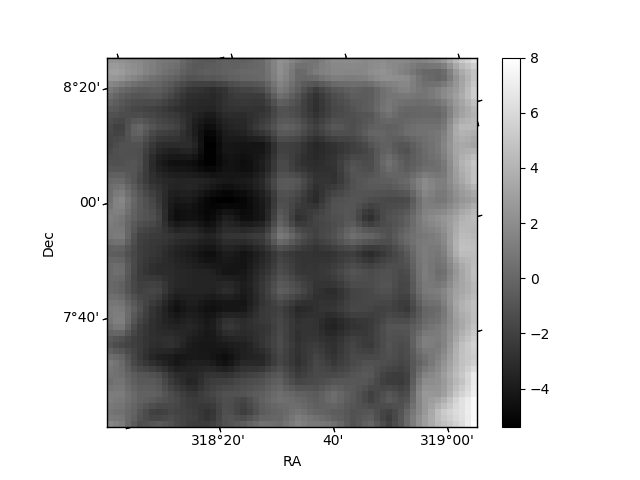
Histogram calculated using DETX and DETY for each event in the final _common_clean file
| Quadrant A | 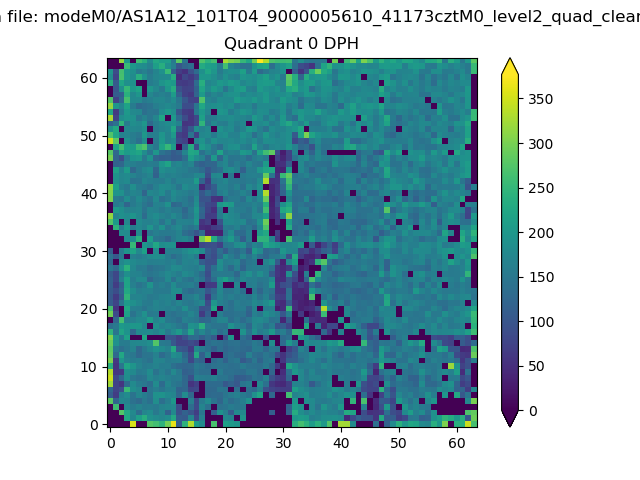 |
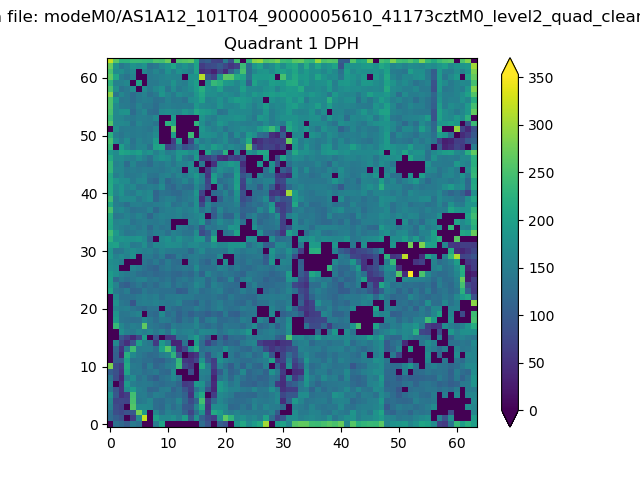 |
Quadrant B |
|---|---|---|---|
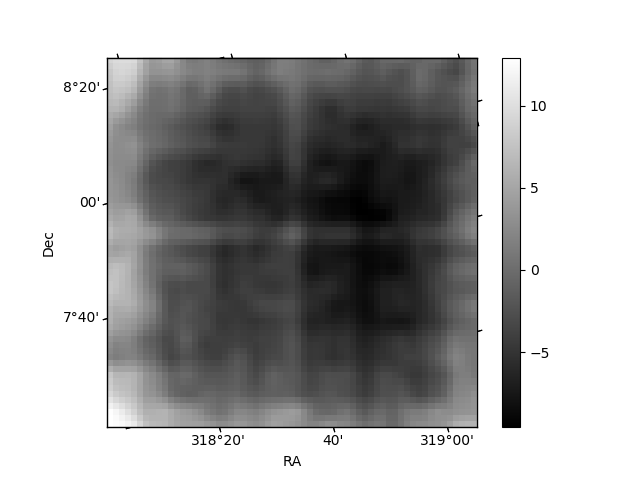
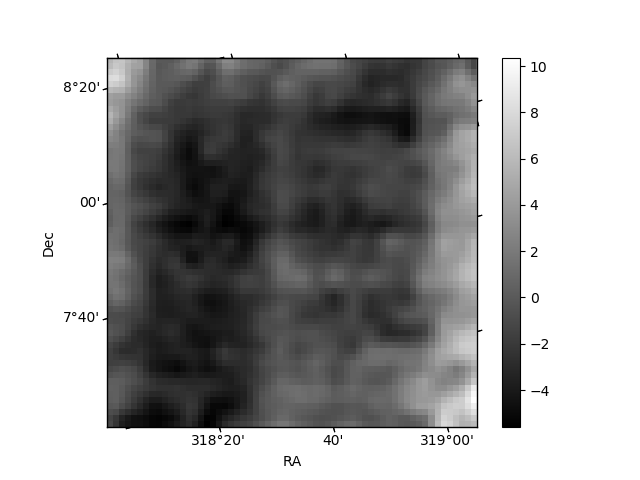
| Quadrant D | 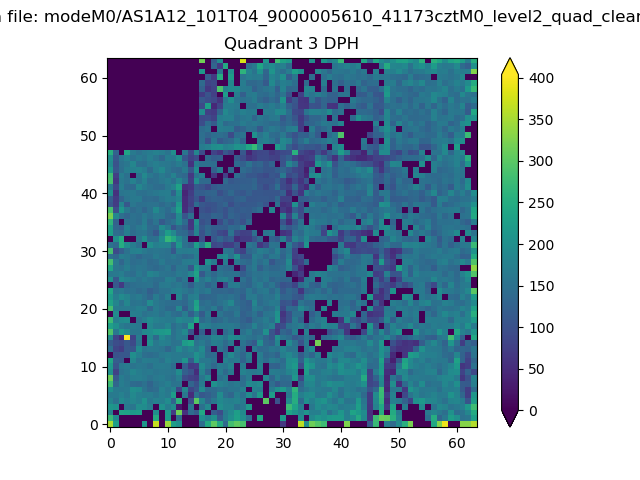 |
 |
Quadrant C |
| Plot type | Count rate plots | Images |
|---|---|---|
| Comparison with Poisson distribution Blue bars denote a histogram of data divided into 1 sec bins. Red curve is a Poisson curve with rate = median count rate of data. |
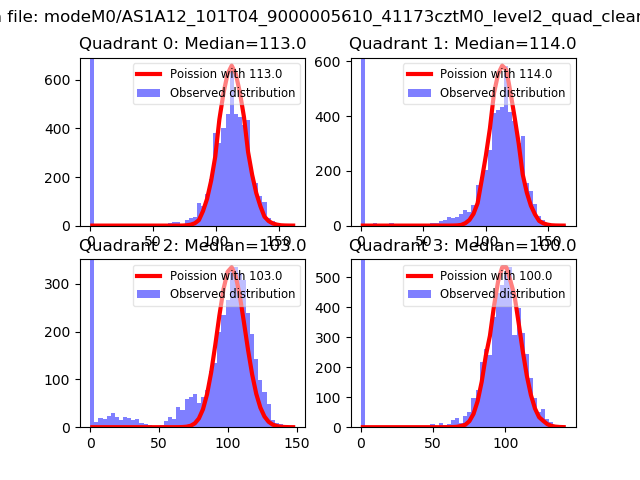 |
 |
| Quadrant-wise count rates Data is divided into 100 sec bins |
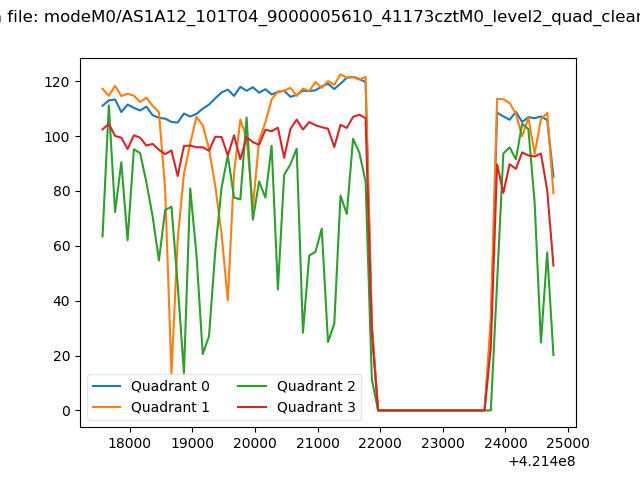 |
|
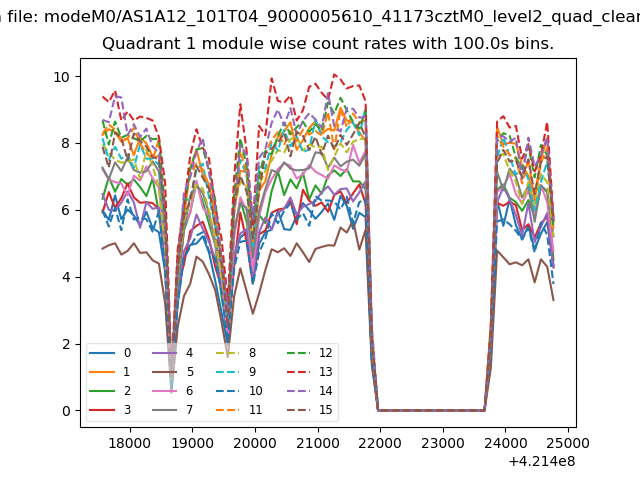
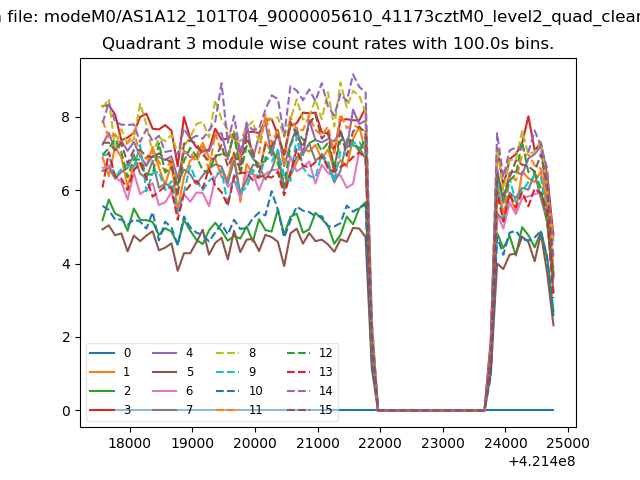
| Module-wise count rates for Quadrant A Data is divided into 100 sec bins |
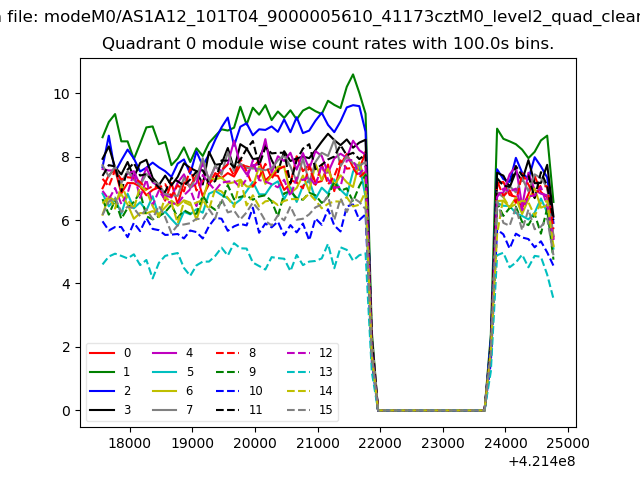 |
 |
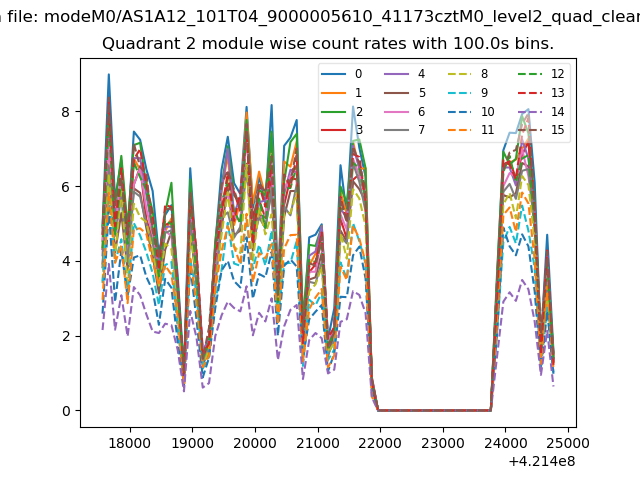
| Module-wise count rates for Quadrant B Data is divided into 100 sec bins |
 |
 |
| Module-wise count rates for Quadrant C Data is divided into 100 sec bins |
 |
 |
| Module-wise count rates for Quadrant D Data is divided into 100 sec bins |
 |
 |
| Parameter | Plot |
|---|---|
| CZT HV Monitor | 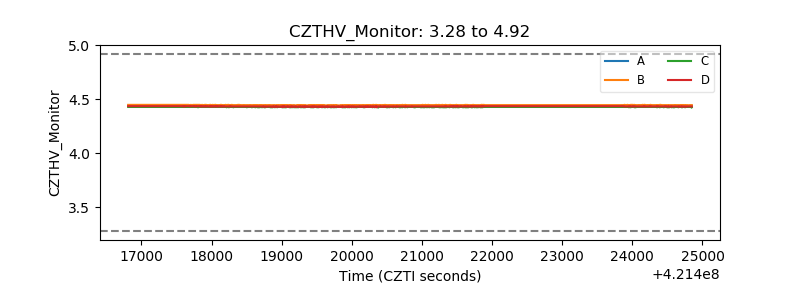 |
| D_VDD | 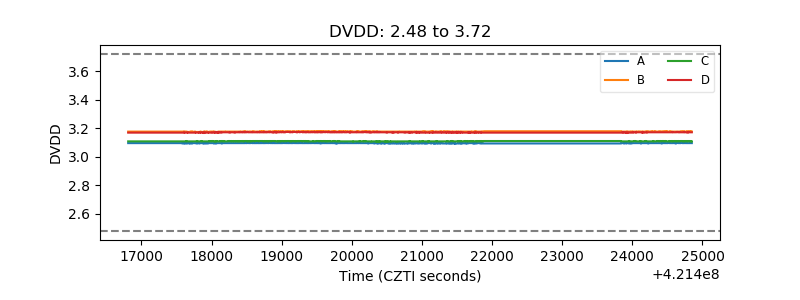 |
| Temperature 1 | 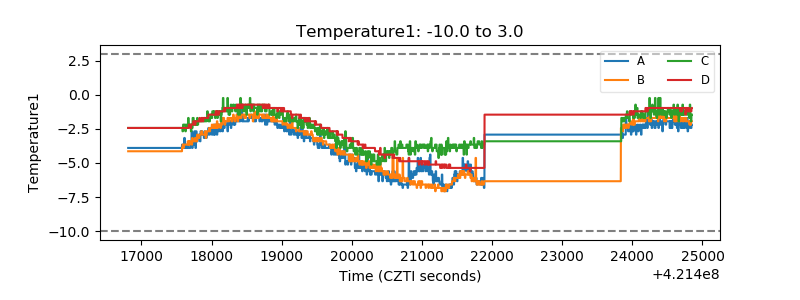 |
| Veto HV Monitor |  |
| Veto LLD | 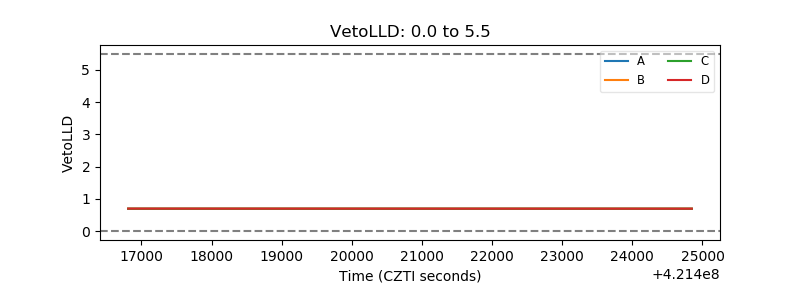 |
| Alpha Counter | 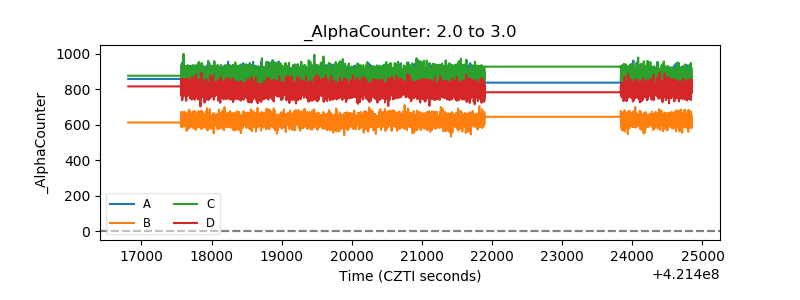 |
| _CPM_Rate | 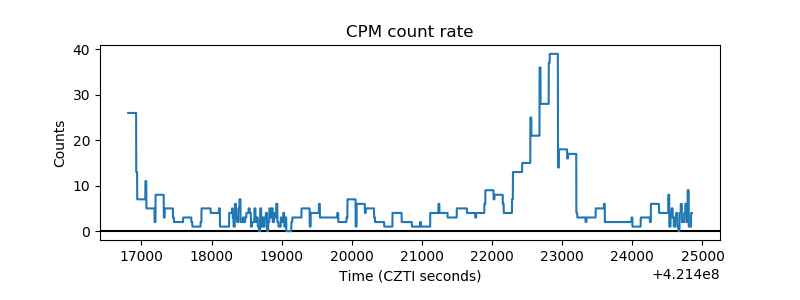 |
| CZT Counter | 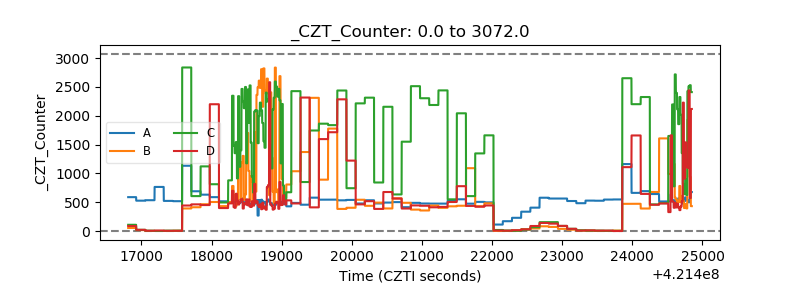 |
| +2.5 Volts monitor | 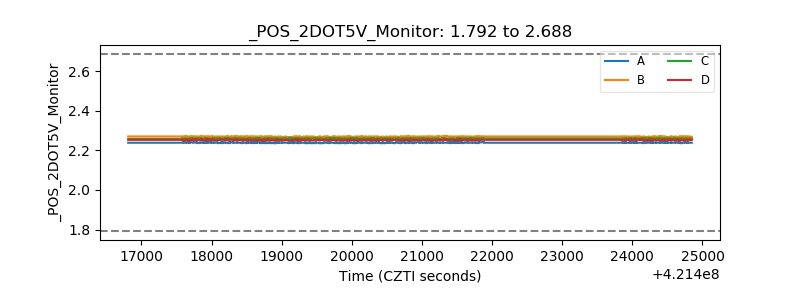 |
| +5 Volts monitor | 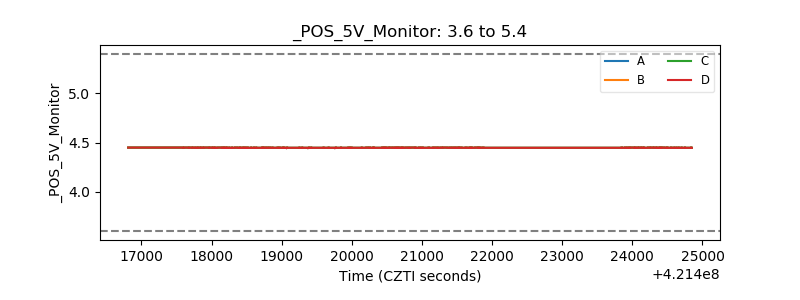 |
| _ROLL_ROT | 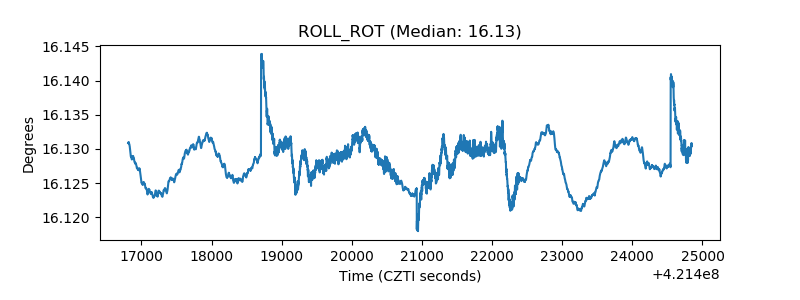 |
| _Roll_DEC | 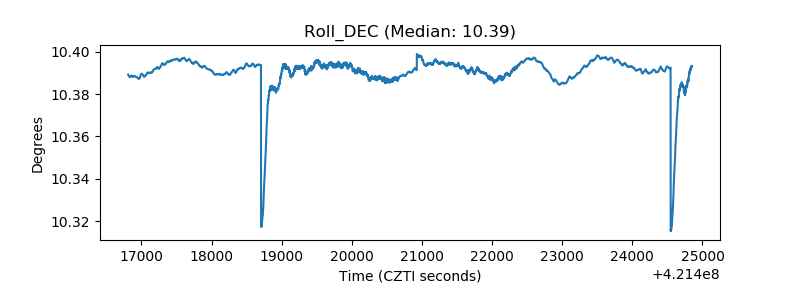 |
| _Roll_RA | 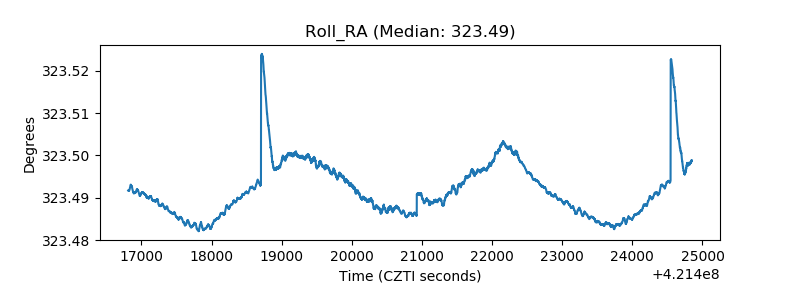 |
| Veto Counter | 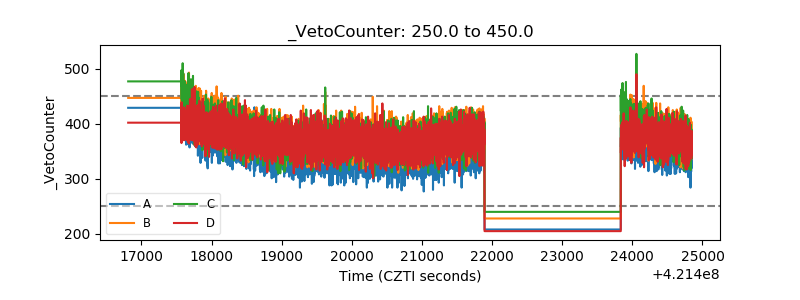 |