| Param | Original file | Final file |
|---|---|---|
| Filename | modeM0/AS1A12_101T04_9000005610_41174cztM0_level2.fits | modeM0/AS1A12_101T04_9000005610_41174cztM0_level2_quad_clean.evt |
| Size (bytes) | 474,333,120 | 83,615,040 |
| Size | 452.4 MB | 79.7 MB |
| Events in quadrant A | 2,979,644 | 613,873 |
| Events in quadrant B | 3,969,301 | 581,345 |
| Events in quadrant C | 6,632,871 | 437,055 |
| Events in quadrant D | 3,550,898 | 516,340 |
| Mode M0 | |||
|---|---|---|---|
| Quadrant | BADHDUFLAG | Total packets | Discarded packets |
| A | 0 | 12092 | 3 |
| B | 0 | 15602 | 2 |
| C | 0 | 23351 | 2 |
| D | 0 | 14508 | 2 |
| Mode SS | |||
|---|---|---|---|
| Quadrant | BADHDUFLAG | Total packets | Discarded packets |
| A | 0 | 112 | 0 |
| B | 0 | 112 | 0 |
| C | 0 | 112 | 0 |
| D | 0 | 112 | 0 |
| Mode M9 | |||
|---|---|---|---|
| Quadrant | BADHDUFLAG | Total packets | Discarded packets |
| A | 0 | 20 | 0 |
| B | 0 | 20 | 0 |
| C | 0 | 20 | 0 |
| D | 0 | 21 | 0 |
| Quadrant | Total seconds | Saturated seconds | Saturation percentage |
|---|---|---|---|
| A | 5469 | 14 | 0.255988% |
| B | 5469 | 430 | 7.862498% |
| C | 5469 | 1552 | 28.378131% |
| D | 5469 | 317 | 5.796306% |
Noise dominated data is calculated using 1-second bins in cleaned event files. If a bin has >2000 counts, and if more than 50% of those come from <1% of pixels, then it is considered to be noise-dominated and hence unusable.
| Quadrant | # 1 sec bins | Bins with >0 counts | Bins with >2000 counts | High rate bins dominated by noise | Noise dominated (total time) | Noise dominated (detector-on time) | Marked lightcurve |
|---|---|---|---|---|---|---|---|
| A | 7082 | 5470 | 2 | 2 | 0.03% | 0.04% | 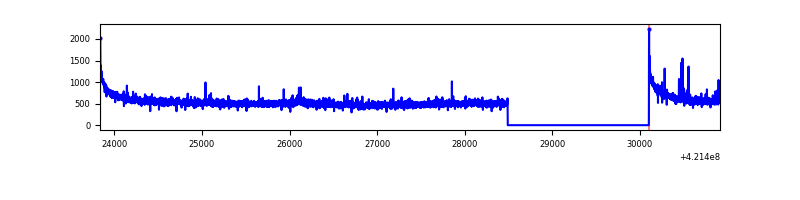 |
| B | 7082 | 5470 | 342 | 342 | 4.83% | 6.25% | 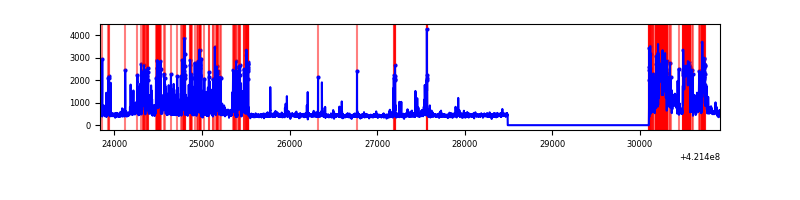 |
| C | 7082 | 5470 | 1281 | 1281 | 18.09% | 23.42% | 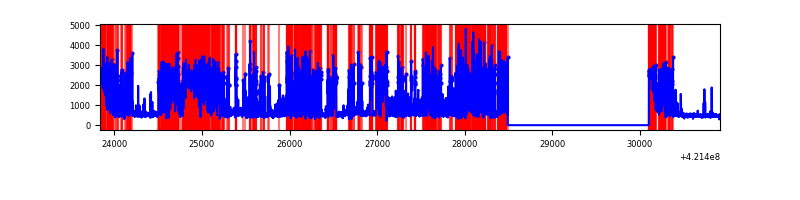 |
| D | 7082 | 5470 | 271 | 271 | 3.83% | 4.95% | 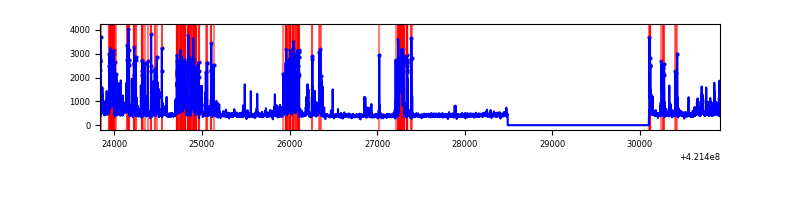 |
Top three noisy pixels from each quadrant. If the there are fewer than three noisy pixels in the level2.evt file, extra rows are filled as -1
| Pixel properties | Quadrant properties | ||||||
|---|---|---|---|---|---|---|---|
| Quadrant | DetID | PixID | Counts | Sigma | Mean | Median | Sigma |
| A | 10 | 83 | 551222 | 4400.32 | 606 | 593 | 125.1 |
| A | 12 | 189 | 66863 | 529.59 | 606 | 593 | 125.1 |
| A | 13 | 248 | 15977 | 122.94 | 606 | 593 | 125.1 |
| B | 0 | 186 | 876026 | 7756.75 | 580 | 563 | 112.9 |
| B | 0 | 229 | 580904 | 5141.92 | 580 | 563 | 112.9 |
| B | 5 | 255 | 174522 | 1541.31 | 580 | 563 | 112.9 |
| C | 9 | 54 | 4132534 | 34617.53 | 509 | 512 | 119.4 |
| C | 0 | 10 | 288800 | 2415.24 | 509 | 512 | 119.4 |
| C | 15 | 214 | 206184 | 1723.09 | 509 | 512 | 119.4 |
| D | 13 | 249 | 980504 | 6909.92 | 572 | 555 | 141.8 |
| D | 2 | 249 | 177104 | 1244.9 | 572 | 555 | 141.8 |
| D | 12 | 233 | 138526 | 972.88 | 572 | 555 | 141.8 |
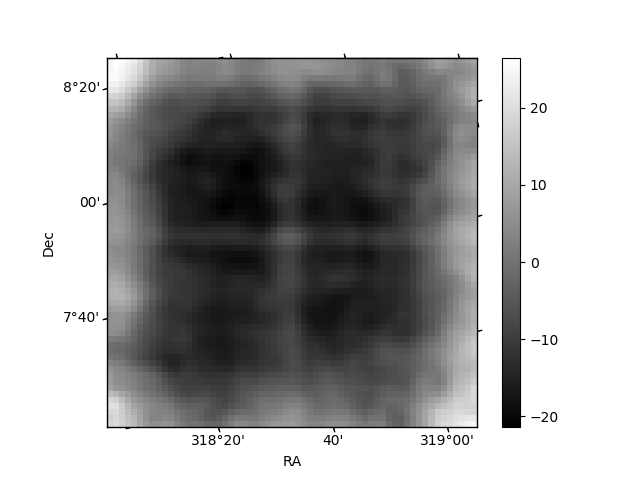
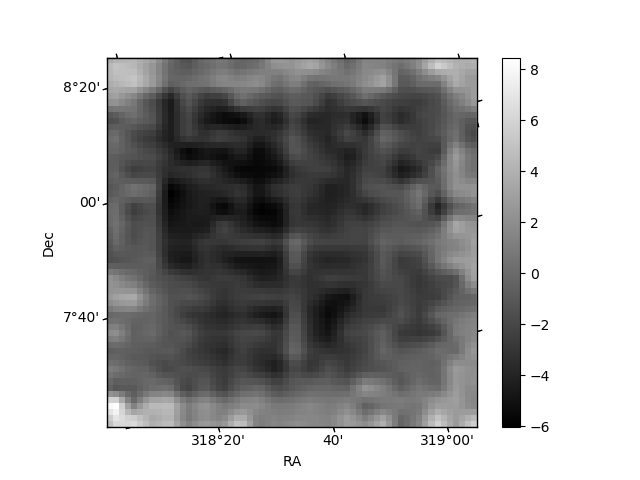
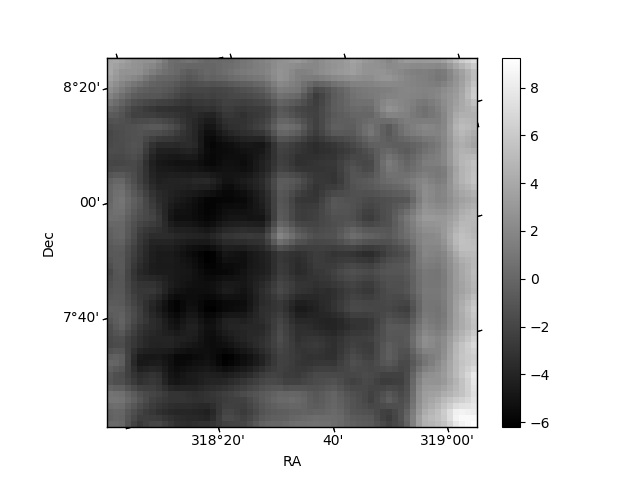
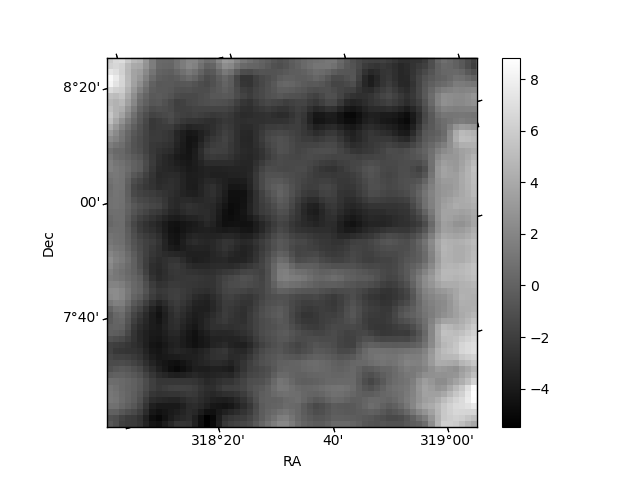
Histogram calculated using DETX and DETY for each event in the final _common_clean file
| Quadrant A | 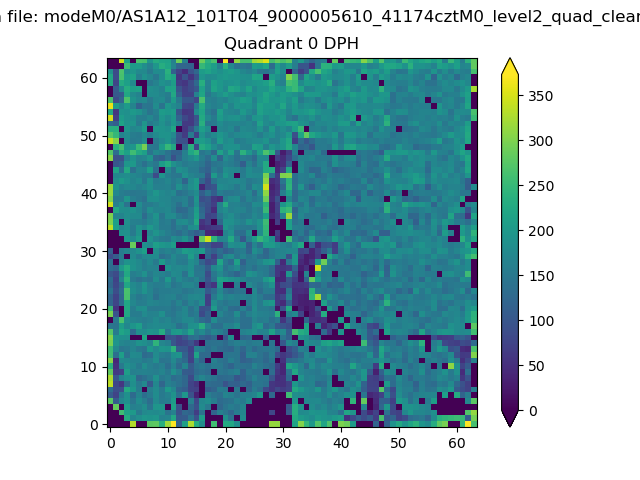 |
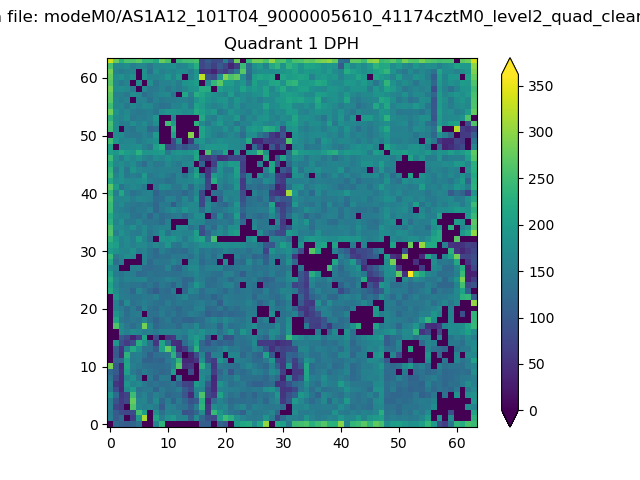 |
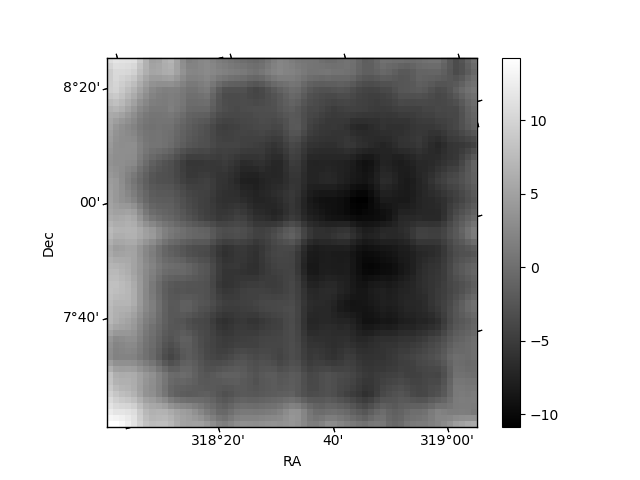
Quadrant B |
|---|---|---|---|
| Quadrant D | 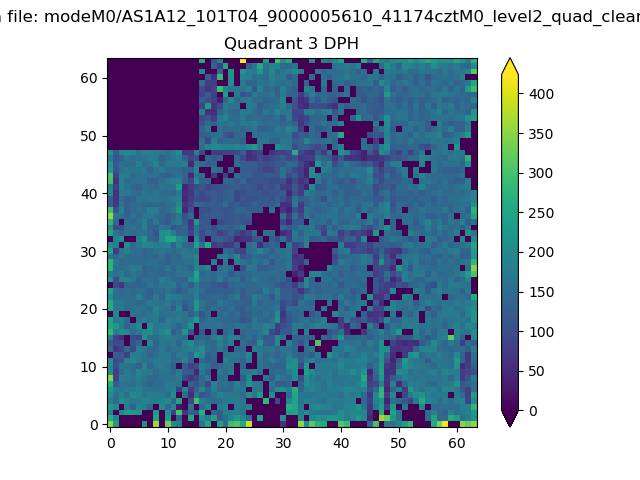 |
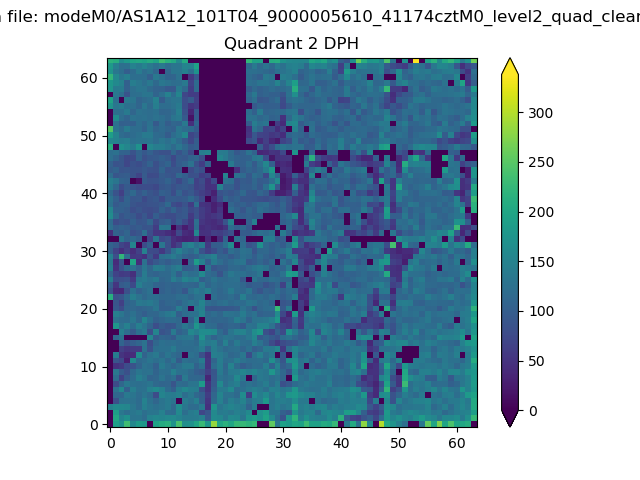 |
Quadrant C |
| Plot type | Count rate plots | Images |
|---|---|---|
| Comparison with Poisson distribution Blue bars denote a histogram of data divided into 1 sec bins. Red curve is a Poisson curve with rate = median count rate of data. |
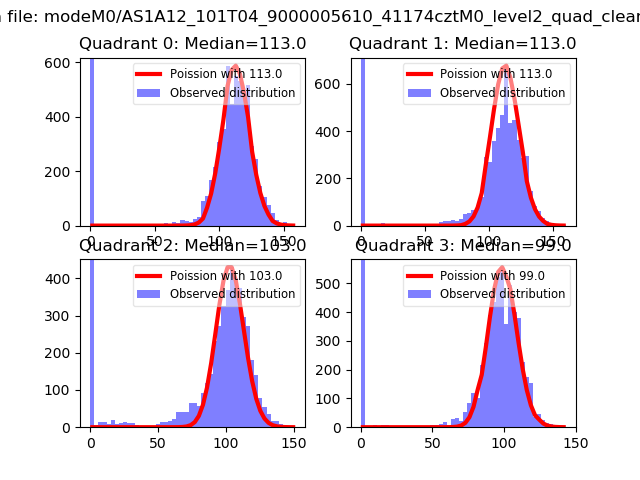 |
 |
| Quadrant-wise count rates Data is divided into 100 sec bins |
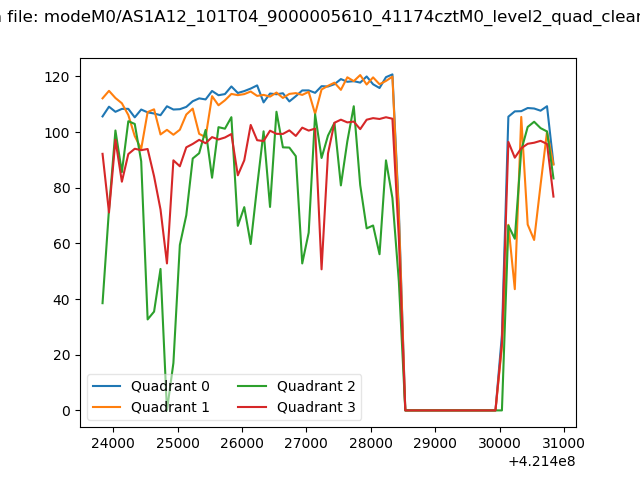 |
|
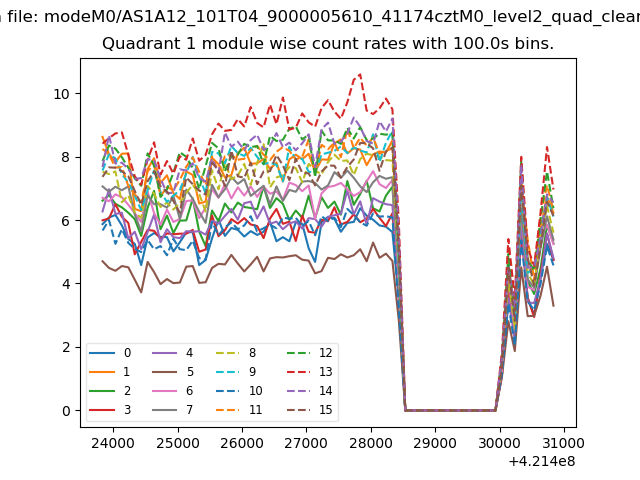
| Module-wise count rates for Quadrant A Data is divided into 100 sec bins |
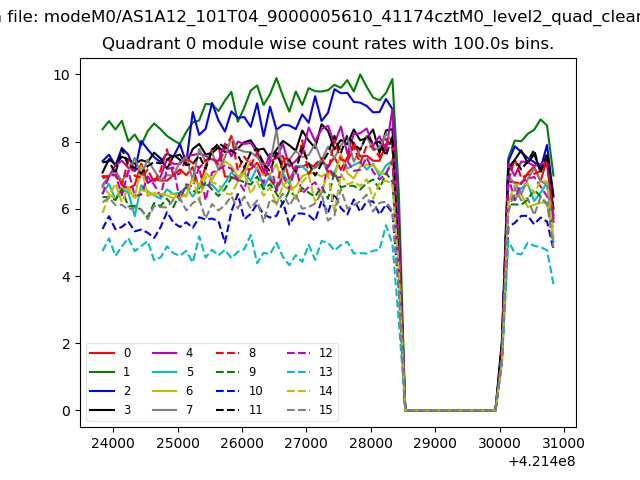 |
 |
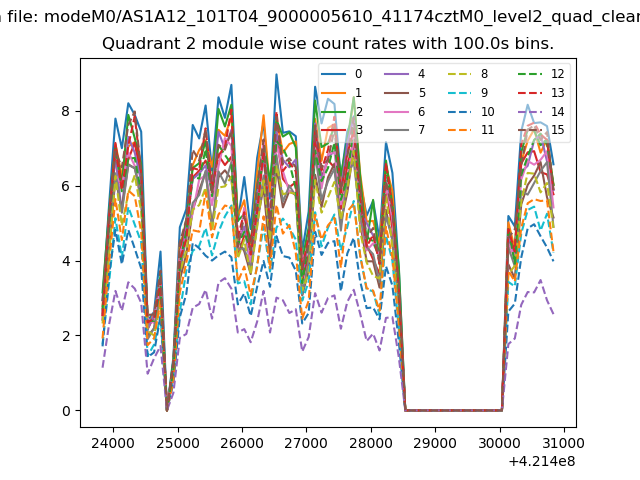
| Module-wise count rates for Quadrant B Data is divided into 100 sec bins |
 |
 |
| Module-wise count rates for Quadrant C Data is divided into 100 sec bins |
 |
 |
| Module-wise count rates for Quadrant D Data is divided into 100 sec bins |
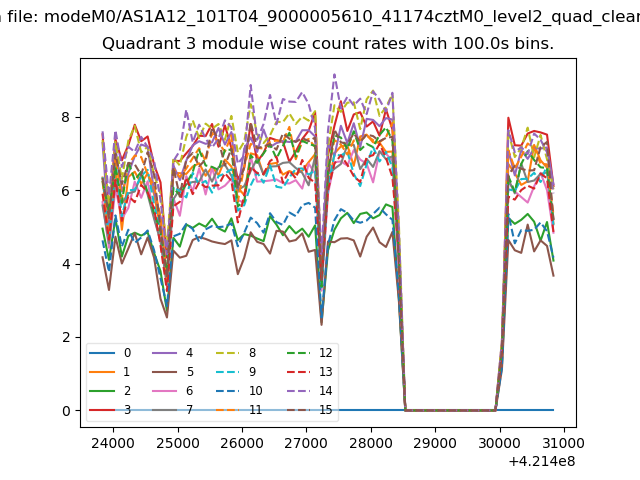 |
 |
| Parameter | Plot |
|---|---|
| CZT HV Monitor | 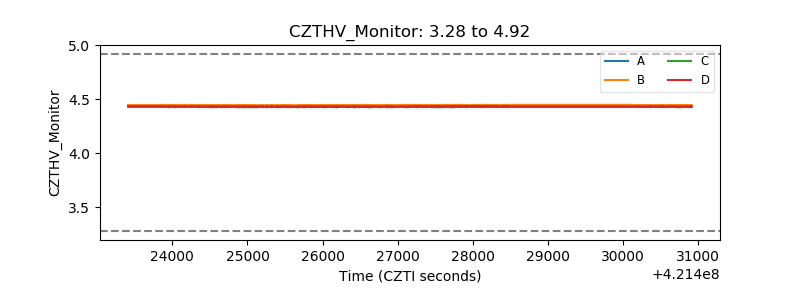 |
| D_VDD | 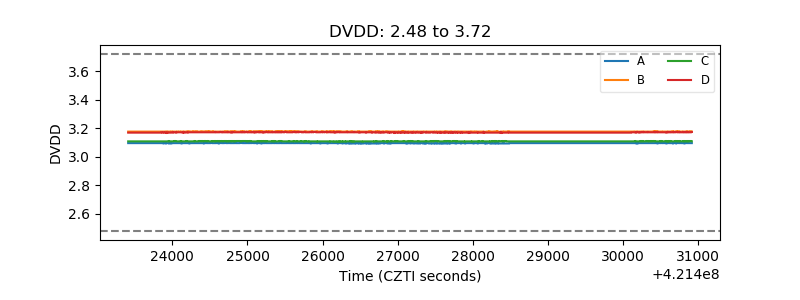 |
| Temperature 1 | 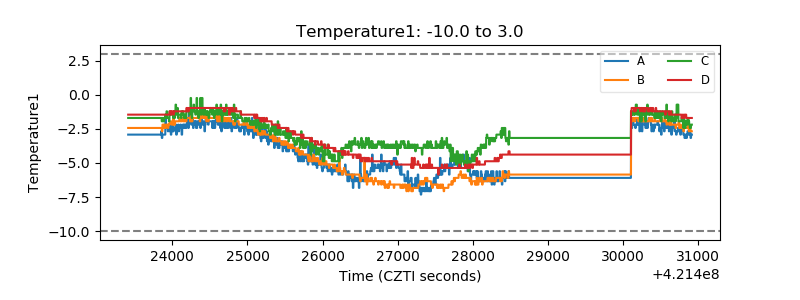 |
| Veto HV Monitor | 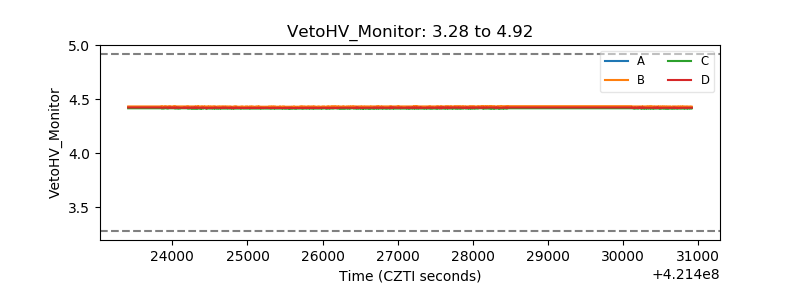 |
| Veto LLD | 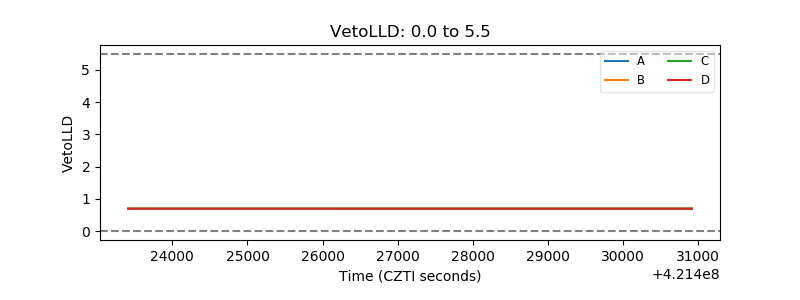 |
| Alpha Counter | 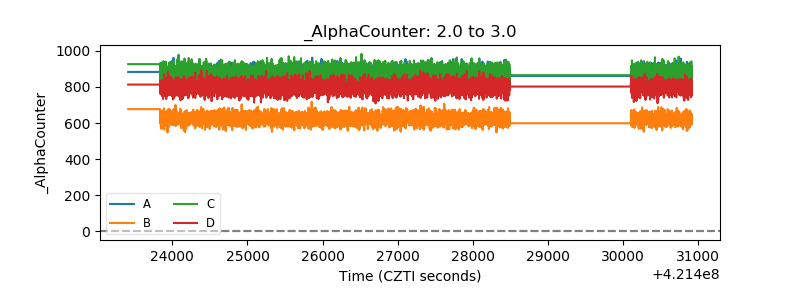 |
| _CPM_Rate | 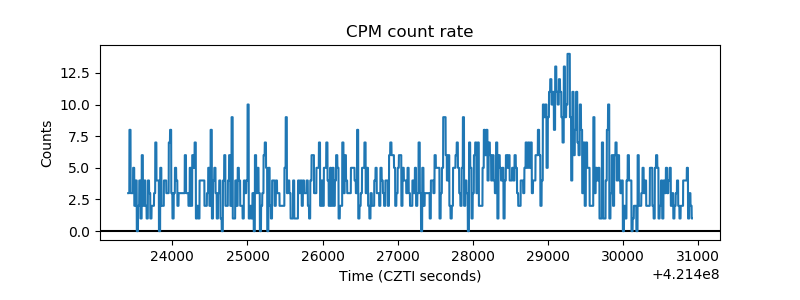 |
| CZT Counter | 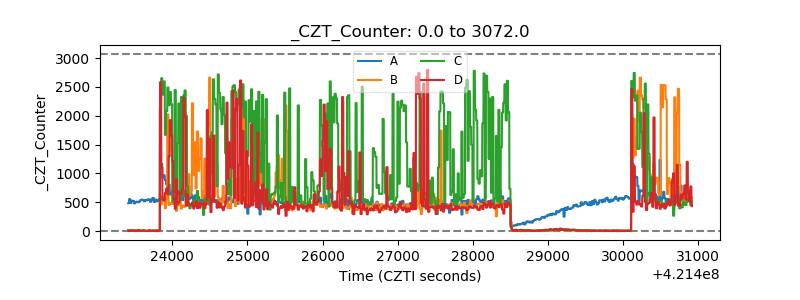 |
| +2.5 Volts monitor | 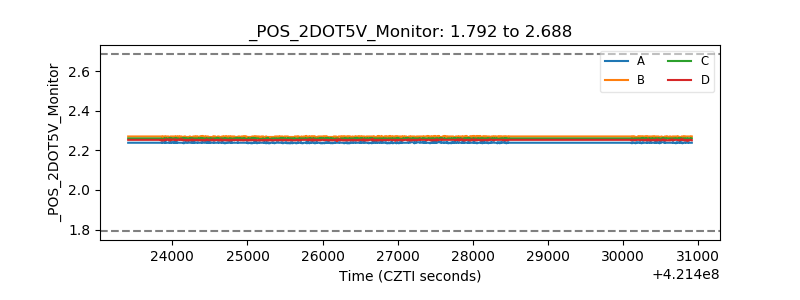 |
| +5 Volts monitor | 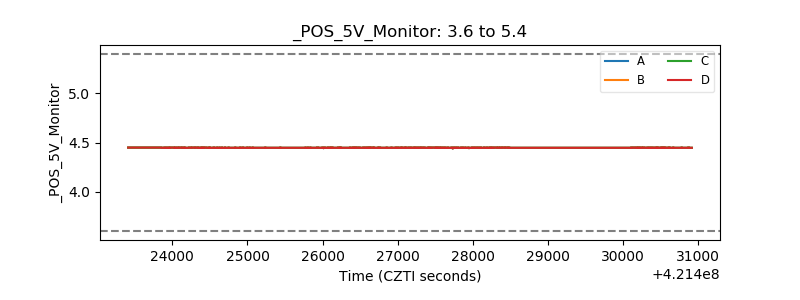 |
| _ROLL_ROT | 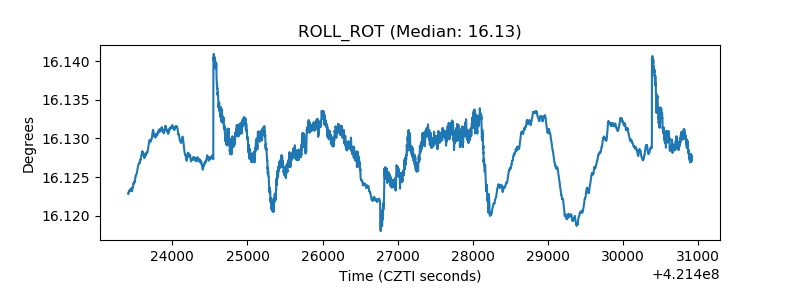 |
| _Roll_DEC | 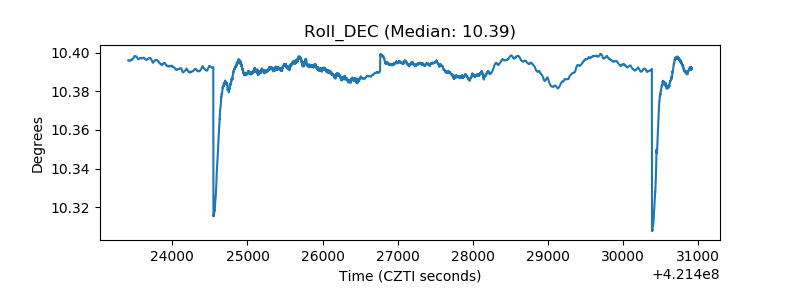 |
| _Roll_RA | 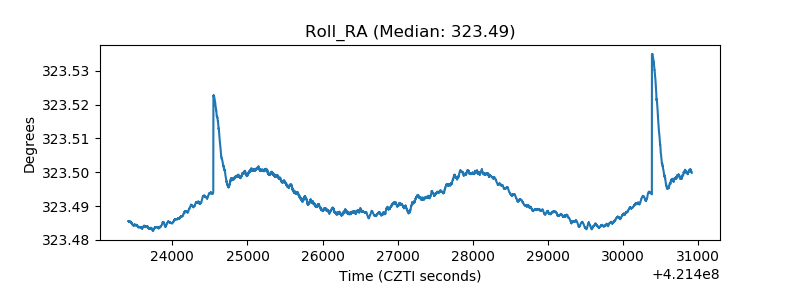 |
| Veto Counter | 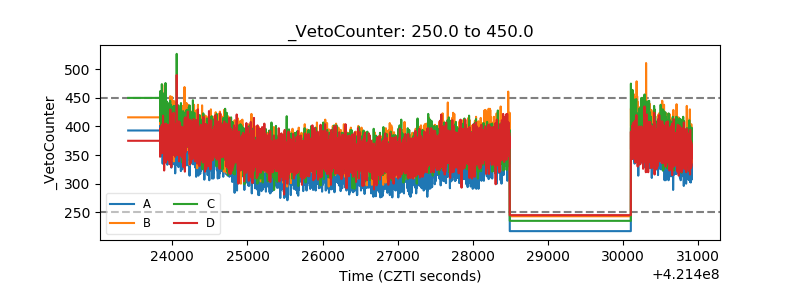 |