| Param | Original file | Final file |
|---|---|---|
| Filename | modeM0/AS1A12_101T04_9000005610_41175cztM0_level2.fits | modeM0/AS1A12_101T04_9000005610_41175cztM0_level2_quad_clean.evt |
| Size (bytes) | 437,898,240 | 91,310,400 |
| Size | 417.6 MB | 87.1 MB |
| Events in quadrant A | 3,236,046 | 646,803 |
| Events in quadrant B | 4,572,138 | 590,482 |
| Events in quadrant C | 4,343,210 | 560,741 |
| Events in quadrant D | 3,604,162 | 558,445 |
| Mode M0 | |||
|---|---|---|---|
| Quadrant | BADHDUFLAG | Total packets | Discarded packets |
| A | 0 | 13234 | 3 |
| B | 0 | 17741 | 2 |
| C | 0 | 16728 | 2 |
| D | 0 | 14999 | 2 |
| Mode SS | |||
|---|---|---|---|
| Quadrant | BADHDUFLAG | Total packets | Discarded packets |
| A | 0 | 120 | 0 |
| B | 0 | 120 | 0 |
| C | 0 | 120 | 0 |
| D | 0 | 120 | 0 |
| Mode M9 | |||
|---|---|---|---|
| Quadrant | BADHDUFLAG | Total packets | Discarded packets |
| A | 0 | 23 | 0 |
| B | 0 | 23 | 0 |
| C | 0 | 23 | 0 |
| D | 0 | 24 | 0 |
| Quadrant | Total seconds | Saturated seconds | Saturation percentage |
|---|---|---|---|
| A | 5835 | 24 | 0.411311% |
| B | 5835 | 678 | 11.619537% |
| C | 5835 | 589 | 10.094259% |
| D | 5835 | 198 | 3.393316% |
Noise dominated data is calculated using 1-second bins in cleaned event files. If a bin has >2000 counts, and if more than 50% of those come from <1% of pixels, then it is considered to be noise-dominated and hence unusable.
| Quadrant | # 1 sec bins | Bins with >0 counts | Bins with >2000 counts | High rate bins dominated by noise | Noise dominated (total time) | Noise dominated (detector-on time) | Marked lightcurve |
|---|---|---|---|---|---|---|---|
| A | 7208 | 5836 | 11 | 11 | 0.15% | 0.19% | 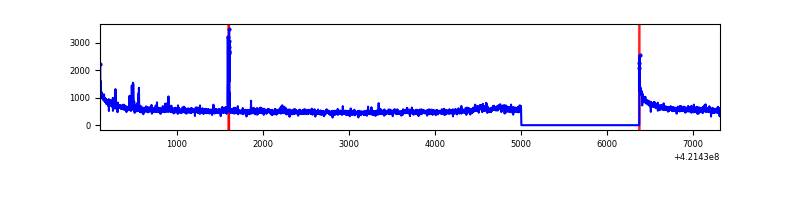 |
| B | 7208 | 5836 | 535 | 535 | 7.42% | 9.17% | 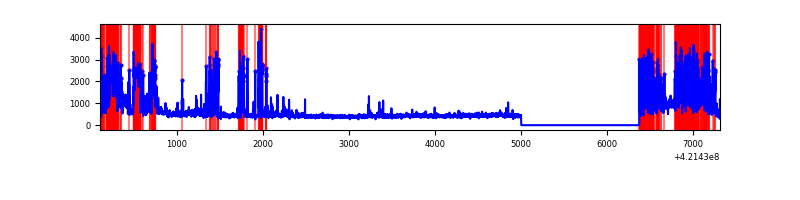 |
| C | 7208 | 5836 | 504 | 504 | 6.99% | 8.64% | 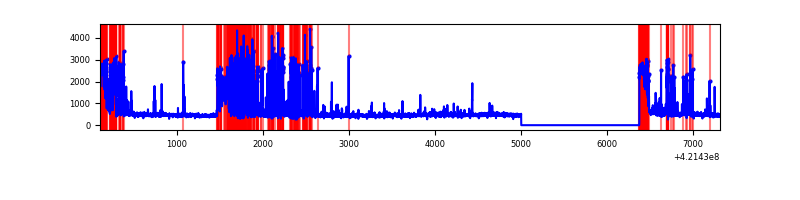 |
| D | 7208 | 5836 | 195 | 195 | 2.71% | 3.34% | 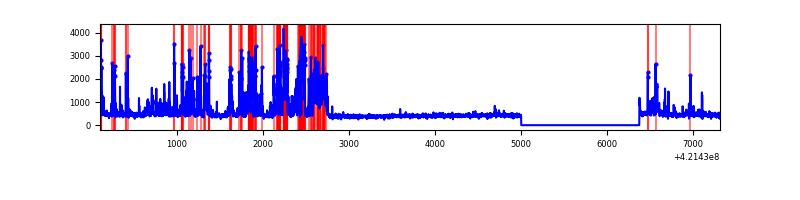 |
Top three noisy pixels from each quadrant. If the there are fewer than three noisy pixels in the level2.evt file, extra rows are filled as -1
| Pixel properties | Quadrant properties | ||||||
|---|---|---|---|---|---|---|---|
| Quadrant | DetID | PixID | Counts | Sigma | Mean | Median | Sigma |
| A | 10 | 83 | 577939 | 4413.35 | 639 | 626 | 130.8 |
| A | 12 | 189 | 133824 | 1018.25 | 639 | 626 | 130.8 |
| A | 10 | 255 | 32081 | 240.46 | 639 | 626 | 130.8 |
| B | 0 | 186 | 1027959 | 8690.08 | 602 | 585 | 118.2 |
| B | 0 | 229 | 475323 | 4015.59 | 602 | 585 | 118.2 |
| B | 0 | 245 | 345718 | 2919.32 | 602 | 585 | 118.2 |
| C | 9 | 54 | 1411857 | 10200.35 | 586 | 592 | 138.4 |
| C | 0 | 10 | 338146 | 2439.78 | 586 | 592 | 138.4 |
| C | 15 | 214 | 235982 | 1701.35 | 586 | 592 | 138.4 |
| D | 13 | 249 | 815328 | 5369.74 | 613 | 596 | 151.7 |
| D | 2 | 249 | 351064 | 2309.87 | 613 | 596 | 151.7 |
| D | 10 | 34 | 44562 | 289.77 | 613 | 596 | 151.7 |
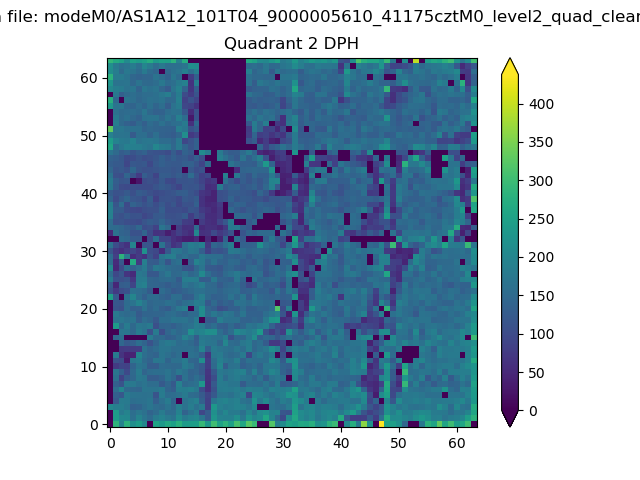
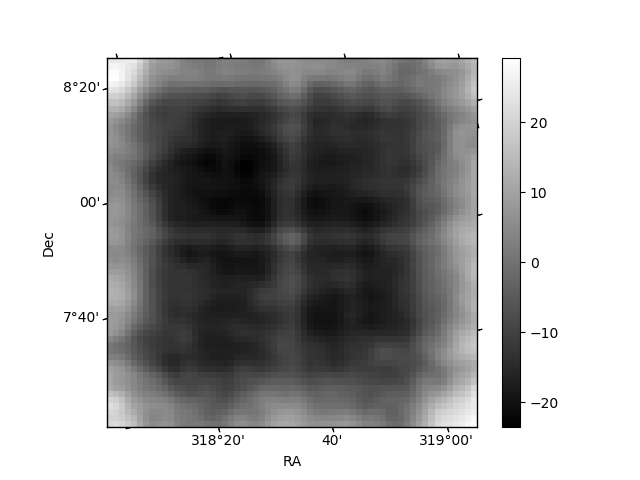
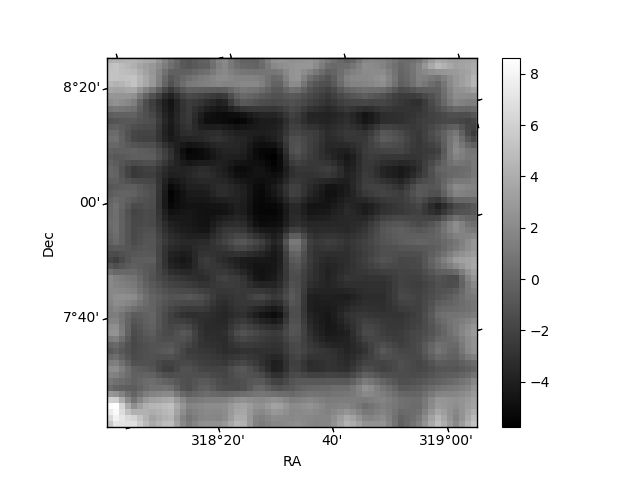
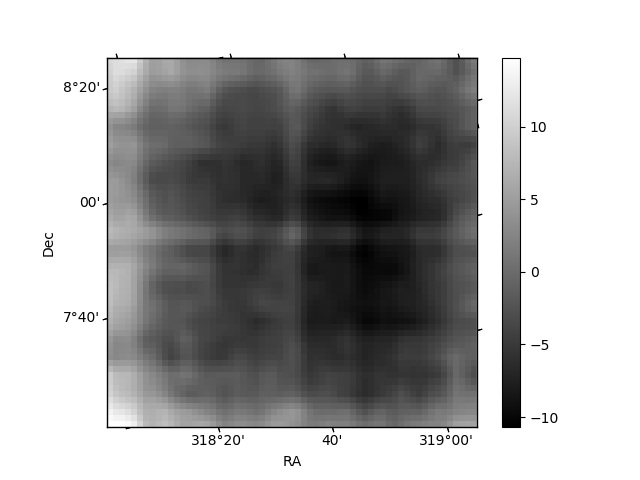
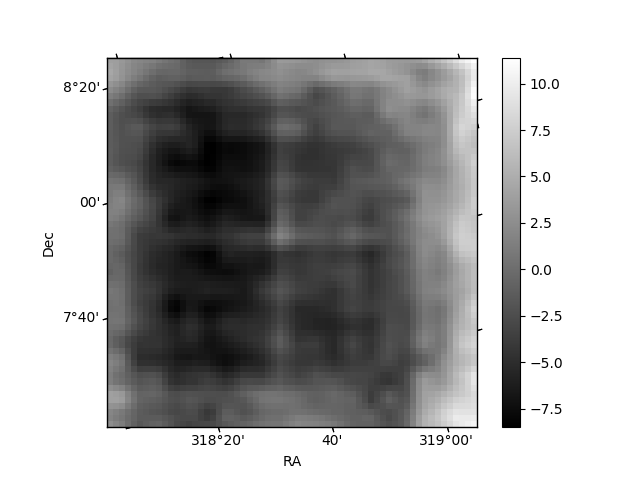
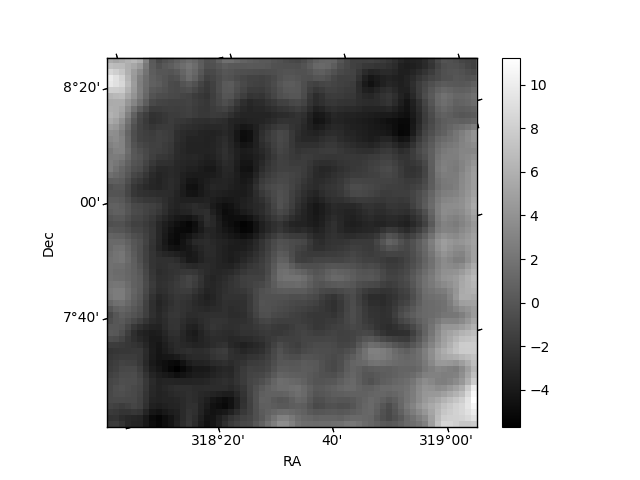
Histogram calculated using DETX and DETY for each event in the final _common_clean file
| Quadrant A | 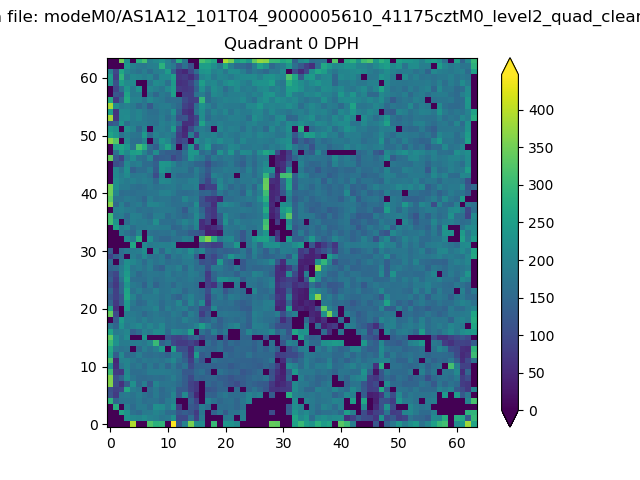 |
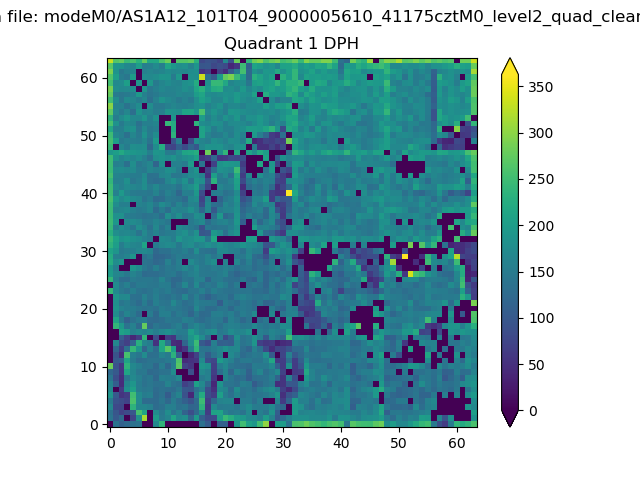 |
Quadrant B |
|---|---|---|---|
| Quadrant D | 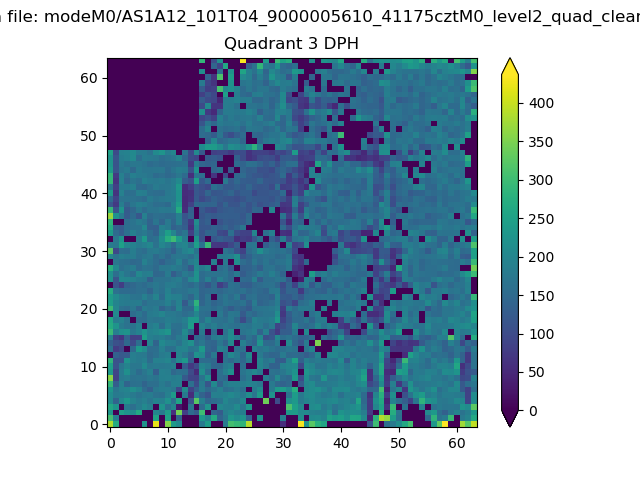 |
 |
Quadrant C |
| Plot type | Count rate plots | Images |
|---|---|---|
| Comparison with Poisson distribution Blue bars denote a histogram of data divided into 1 sec bins. Red curve is a Poisson curve with rate = median count rate of data. |
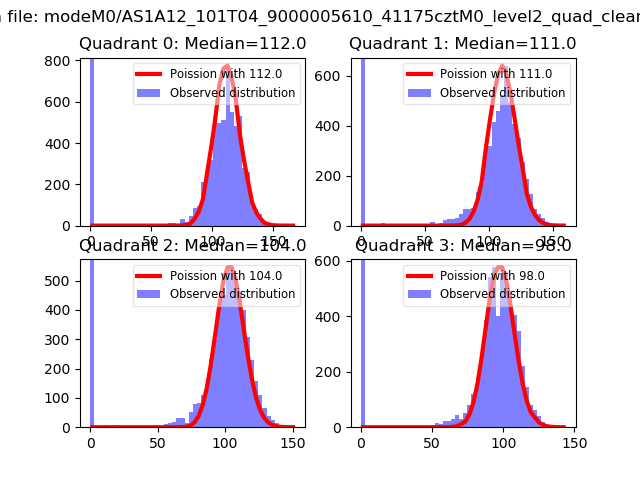 |
 |
| Quadrant-wise count rates Data is divided into 100 sec bins |
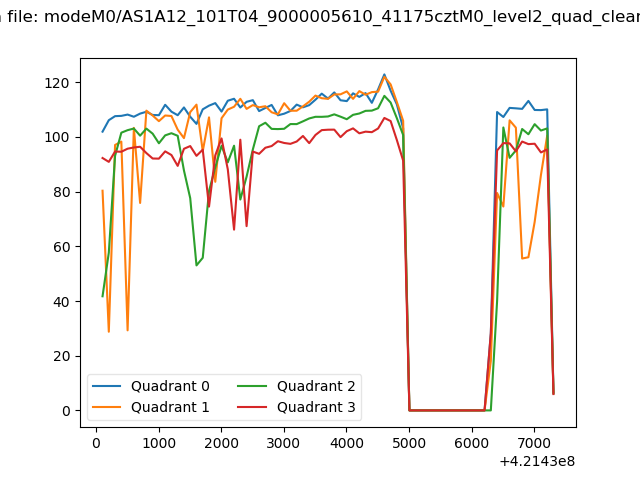 |
|
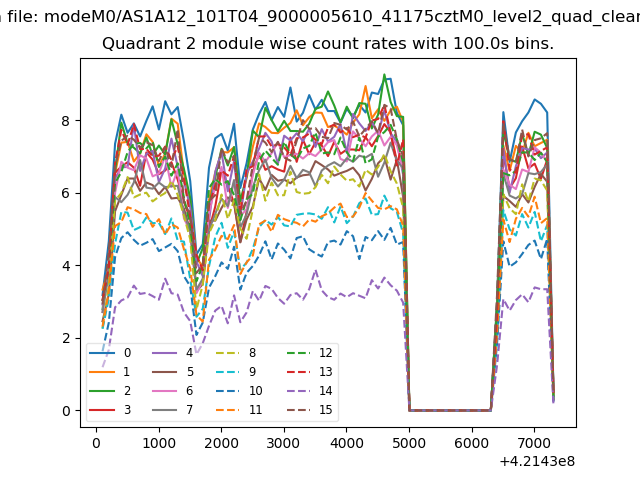
| Module-wise count rates for Quadrant A Data is divided into 100 sec bins |
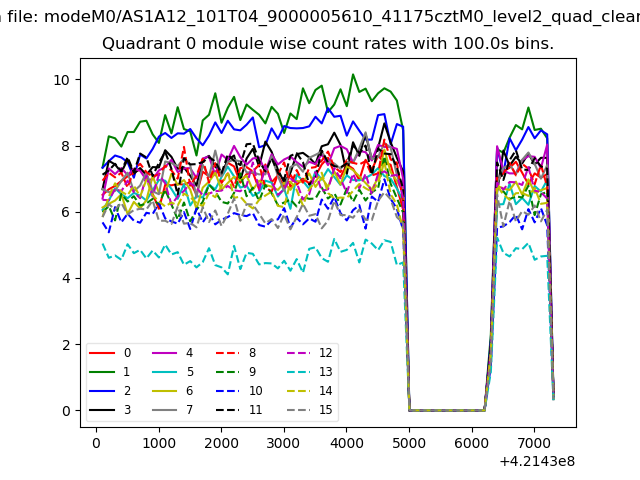 |
 |
| Module-wise count rates for Quadrant B Data is divided into 100 sec bins |
 |
 |
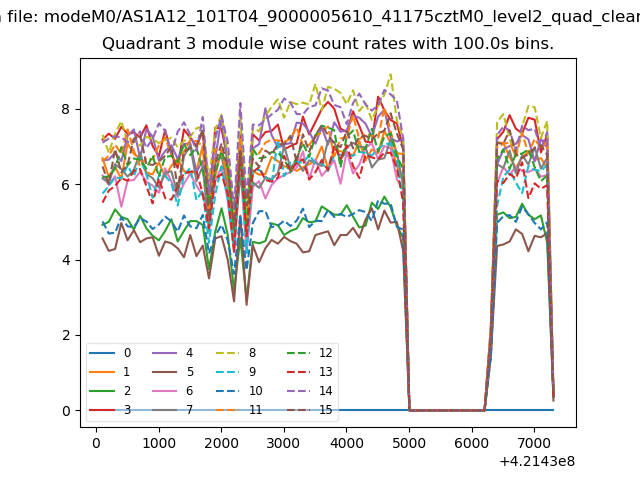
| Module-wise count rates for Quadrant C Data is divided into 100 sec bins |
 |
 |
| Module-wise count rates for Quadrant D Data is divided into 100 sec bins |
 |
 |
| Parameter | Plot |
|---|---|
| CZT HV Monitor | 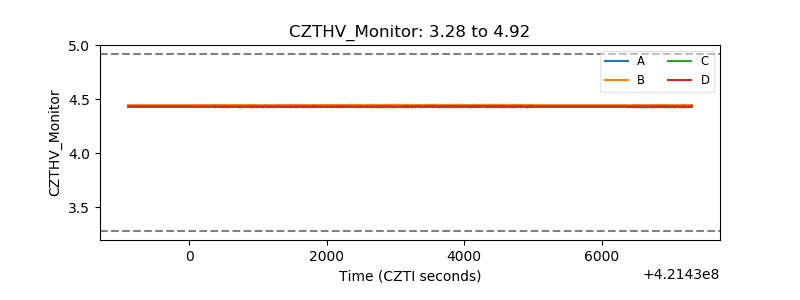 |
| D_VDD | 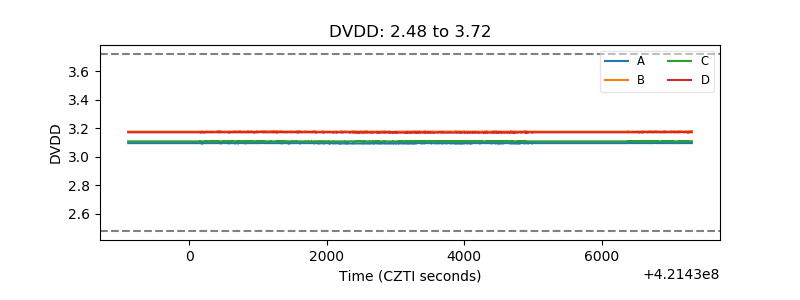 |
| Temperature 1 | 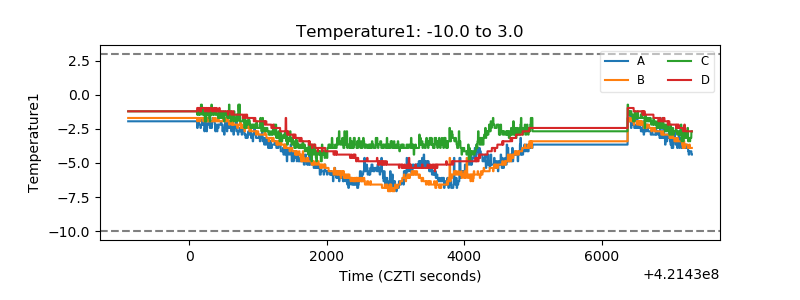 |
| Veto HV Monitor | 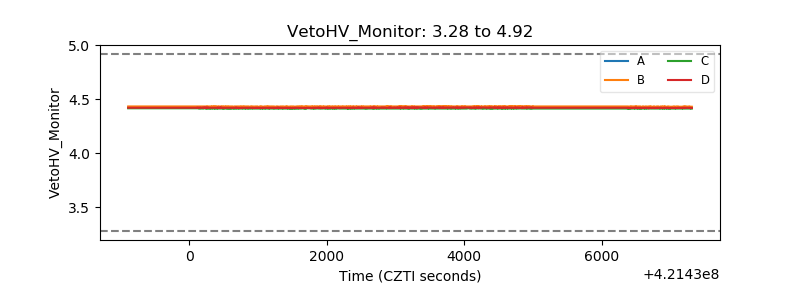 |
| Veto LLD | 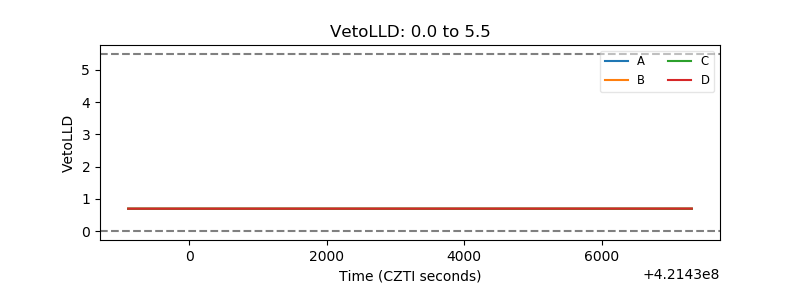 |
| Alpha Counter | 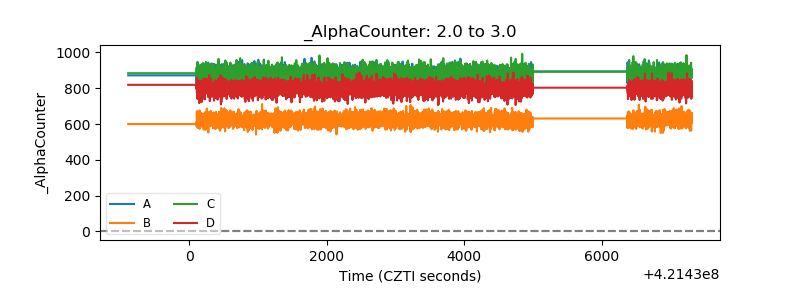 |
| _CPM_Rate | 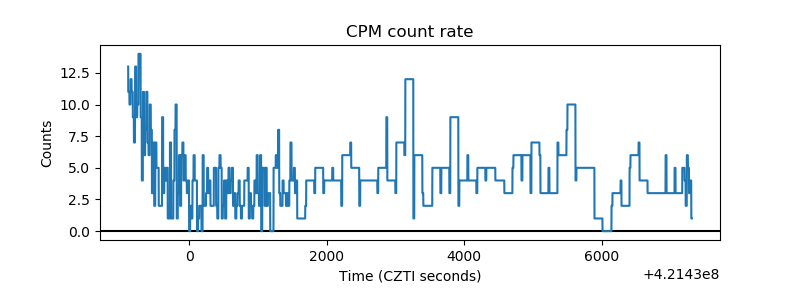 |
| CZT Counter | 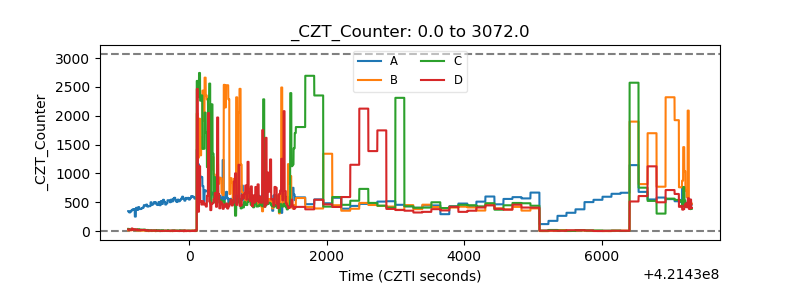 |
| +2.5 Volts monitor | 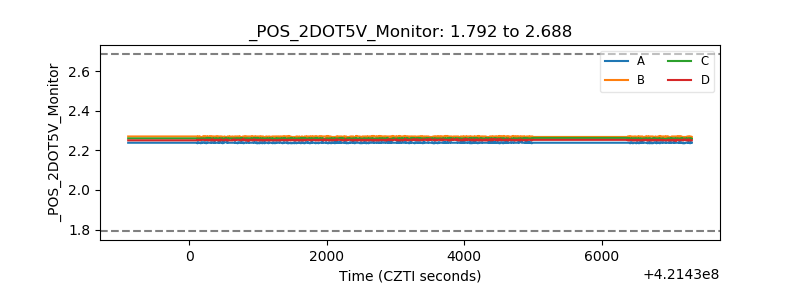 |
| +5 Volts monitor |  |
| _ROLL_ROT | 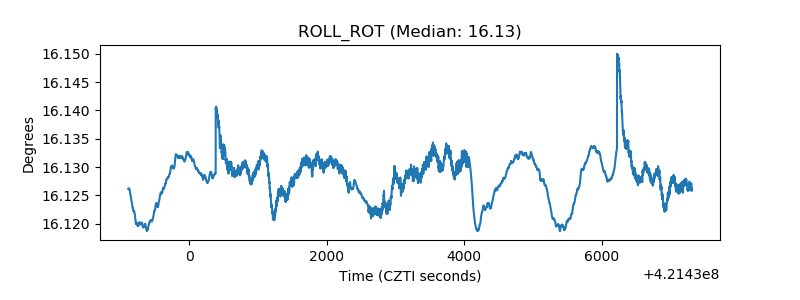 |
| _Roll_DEC | 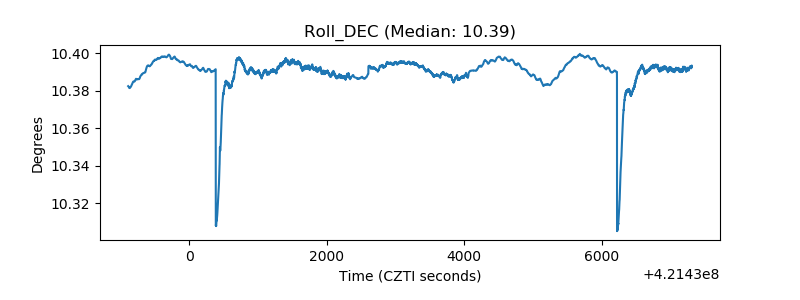 |
| _Roll_RA | 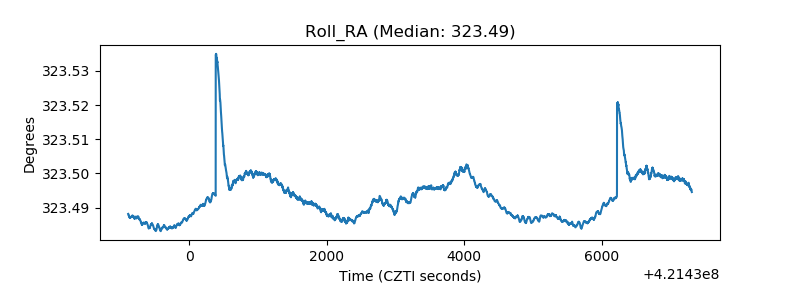 |
| Veto Counter | 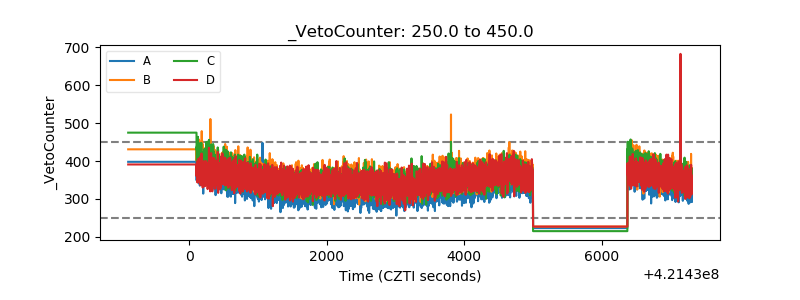 |