| Param | Original file | Final file |
|---|---|---|
| Filename | modeM0/AS1A12_101T04_9000005610_41176cztM0_level2.fits | modeM0/AS1A12_101T04_9000005610_41176cztM0_level2_quad_clean.evt |
| Size (bytes) | 423,138,240 | 94,726,080 |
| Size | 403.5 MB | 90.3 MB |
| Events in quadrant A | 3,254,202 | 665,548 |
| Events in quadrant B | 4,776,728 | 617,044 |
| Events in quadrant C | 4,101,065 | 583,836 |
| Events in quadrant D | 3,061,936 | 580,746 |
| Mode M0 | |||
|---|---|---|---|
| Quadrant | BADHDUFLAG | Total packets | Discarded packets |
| A | 0 | 13363 | 3 |
| B | 0 | 18541 | 2 |
| C | 0 | 16175 | 2 |
| D | 0 | 13568 | 2 |
| Mode SS | |||
|---|---|---|---|
| Quadrant | BADHDUFLAG | Total packets | Discarded packets |
| A | 0 | 124 | 0 |
| B | 0 | 124 | 0 |
| C | 0 | 124 | 0 |
| D | 0 | 124 | 0 |
| Mode M9 | |||
|---|---|---|---|
| Quadrant | BADHDUFLAG | Total packets | Discarded packets |
| A | 0 | 27 | 0 |
| B | 0 | 27 | 0 |
| C | 0 | 27 | 0 |
| D | 0 | 27 | 0 |
| Quadrant | Total seconds | Saturated seconds | Saturation percentage |
|---|---|---|---|
| A | 6027 | 16 | 0.265472% |
| B | 6027 | 665 | 11.033682% |
| C | 6027 | 501 | 8.312593% |
| D | 6027 | 120 | 1.991040% |
Noise dominated data is calculated using 1-second bins in cleaned event files. If a bin has >2000 counts, and if more than 50% of those come from <1% of pixels, then it is considered to be noise-dominated and hence unusable.
| Quadrant | # 1 sec bins | Bins with >0 counts | Bins with >2000 counts | High rate bins dominated by noise | Noise dominated (total time) | Noise dominated (detector-on time) | Marked lightcurve |
|---|---|---|---|---|---|---|---|
| A | 8682 | 6029 | 6 | 6 | 0.07% | 0.10% | 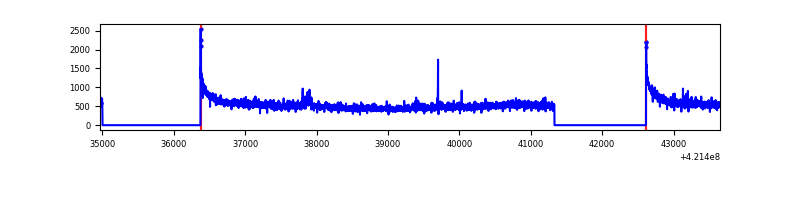 |
| B | 8682 | 6029 | 521 | 521 | 6.00% | 8.64% | 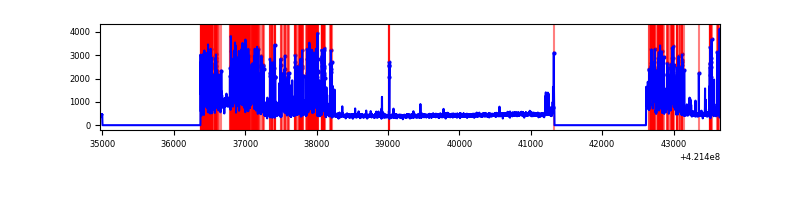 |
| C | 8682 | 6029 | 432 | 432 | 4.98% | 7.17% | 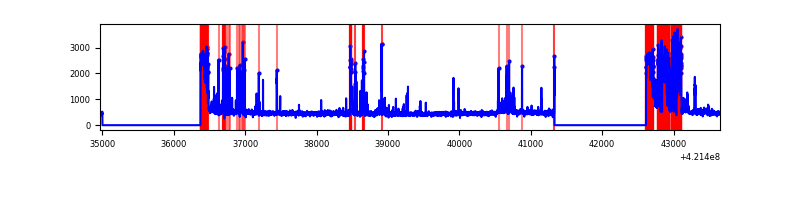 |
| D | 8682 | 6029 | 109 | 109 | 1.26% | 1.81% | 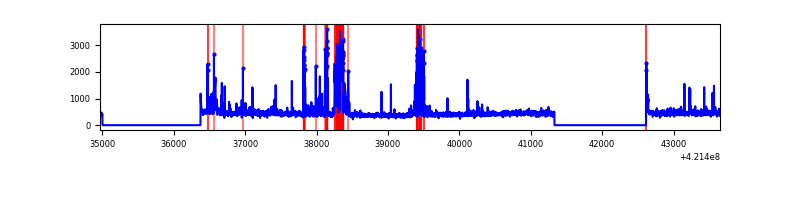 |
Top three noisy pixels from each quadrant. If the there are fewer than three noisy pixels in the level2.evt file, extra rows are filled as -1
| Pixel properties | Quadrant properties | ||||||
|---|---|---|---|---|---|---|---|
| Quadrant | DetID | PixID | Counts | Sigma | Mean | Median | Sigma |
| A | 10 | 83 | 594677 | 4362.07 | 660 | 647 | 136.2 |
| A | 12 | 189 | 82311 | 599.67 | 660 | 647 | 136.2 |
| A | 13 | 6 | 13852 | 96.97 | 660 | 647 | 136.2 |
| B | 0 | 245 | 982811 | 7983.14 | 625 | 607 | 123.0 |
| B | 0 | 186 | 854066 | 6936.73 | 625 | 607 | 123.0 |
| B | 0 | 229 | 218383 | 1770.04 | 625 | 607 | 123.0 |
| C | 9 | 54 | 1031793 | 7198.6 | 610 | 614 | 143.2 |
| C | 0 | 10 | 356823 | 2486.67 | 610 | 614 | 143.2 |
| C | 15 | 214 | 244667 | 1703.72 | 610 | 614 | 143.2 |
| D | 13 | 249 | 343264 | 2183.63 | 634 | 617 | 156.9 |
| D | 2 | 249 | 195296 | 1240.65 | 634 | 617 | 156.9 |
| D | 10 | 34 | 45479 | 285.9 | 634 | 617 | 156.9 |
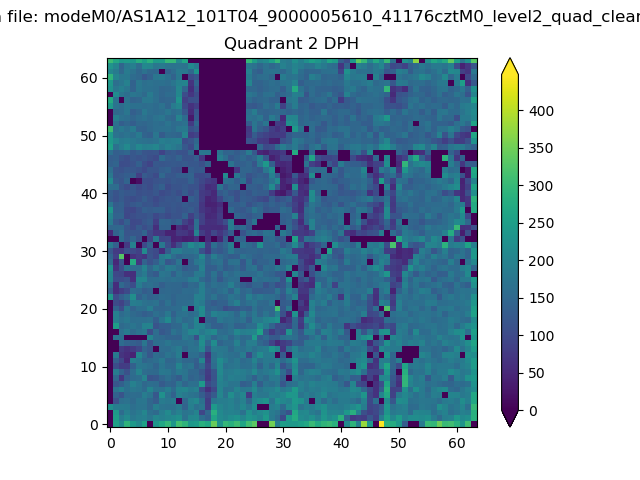
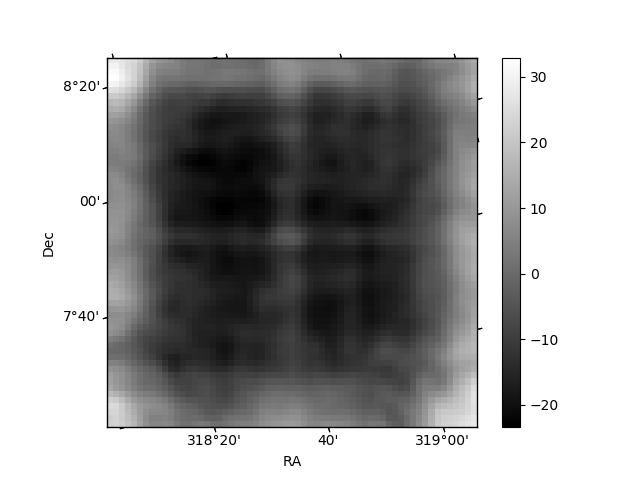
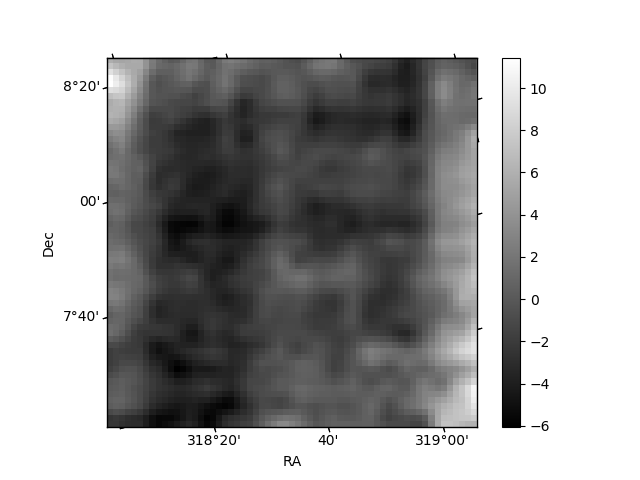
Histogram calculated using DETX and DETY for each event in the final _common_clean file
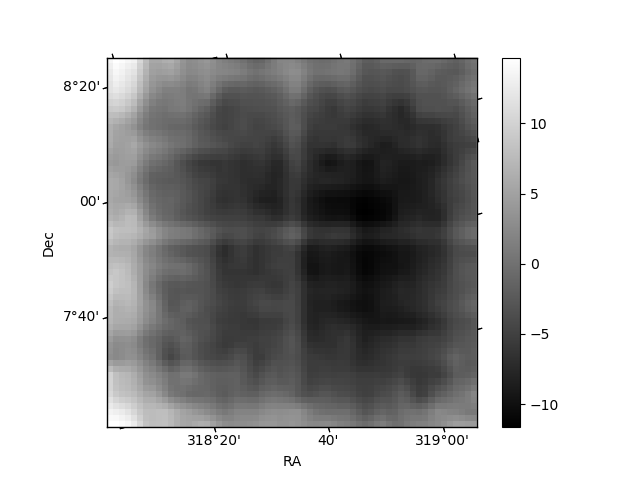
| Quadrant A | 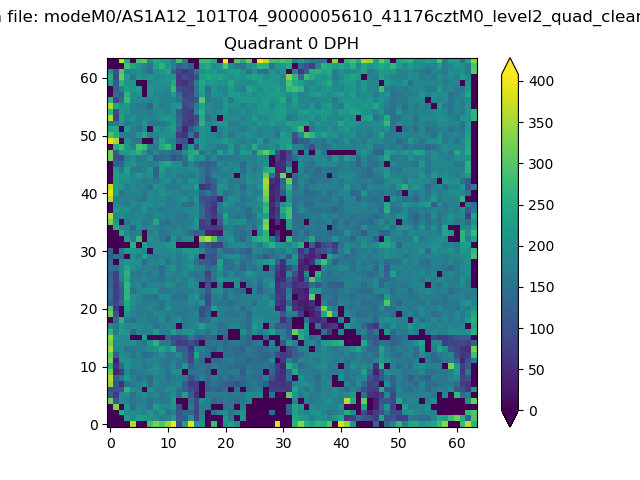 |
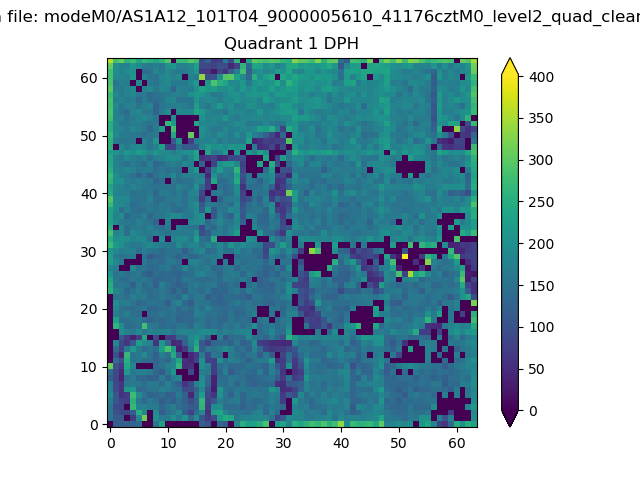 |
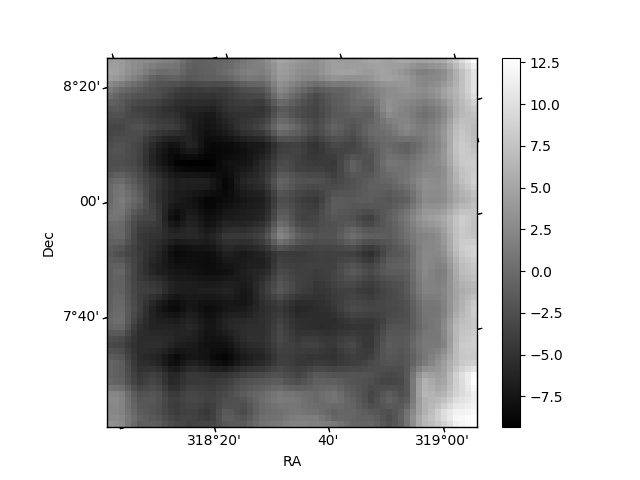
Quadrant B |
|---|---|---|---|
| Quadrant D | 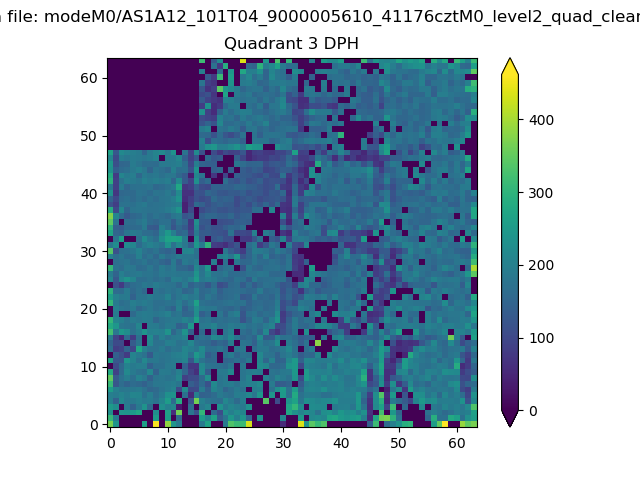 |
 |
Quadrant C |
| Plot type | Count rate plots | Images |
|---|---|---|
| Comparison with Poisson distribution Blue bars denote a histogram of data divided into 1 sec bins. Red curve is a Poisson curve with rate = median count rate of data. |
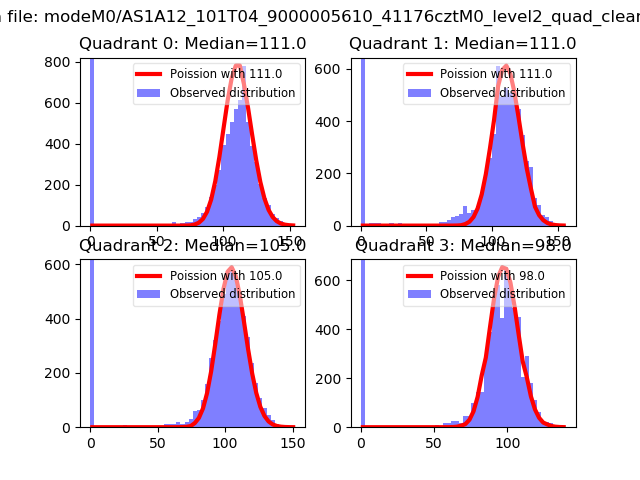 |
 |
| Quadrant-wise count rates Data is divided into 100 sec bins |
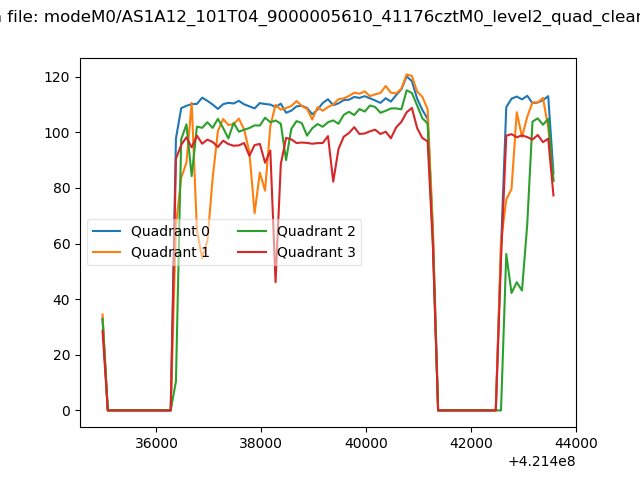 |
|
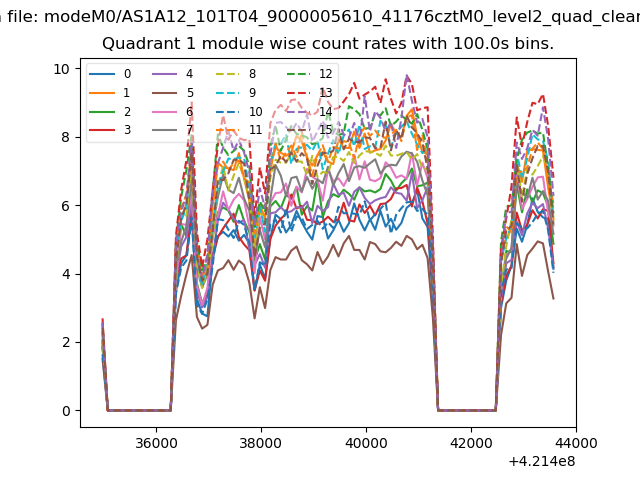
| Module-wise count rates for Quadrant A Data is divided into 100 sec bins |
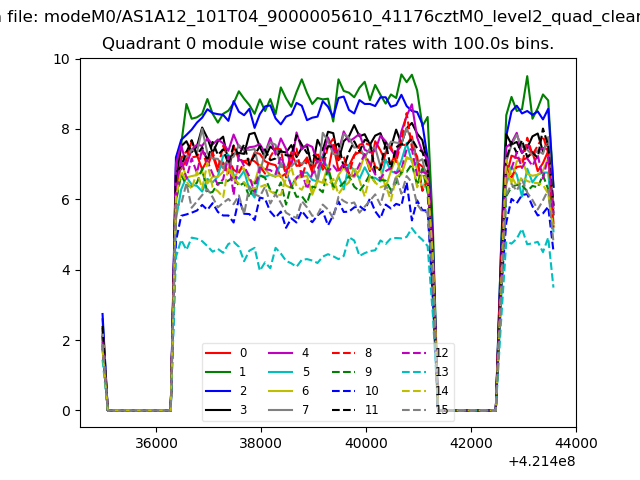 |
 |
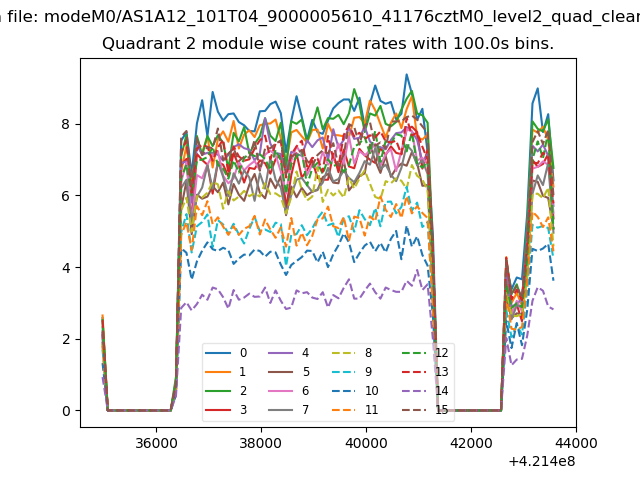
| Module-wise count rates for Quadrant B Data is divided into 100 sec bins |
 |
 |
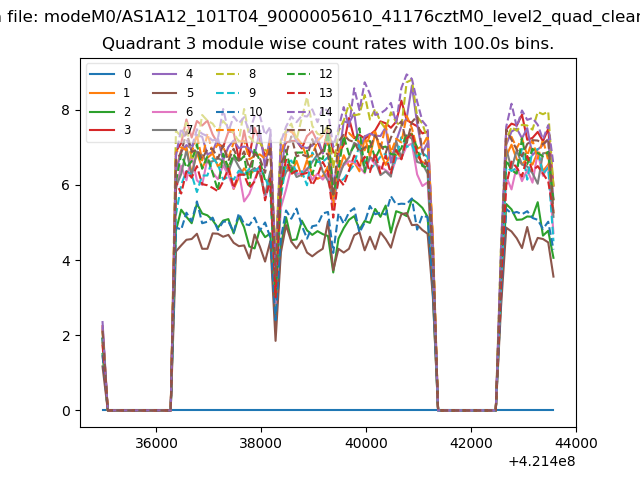
| Module-wise count rates for Quadrant C Data is divided into 100 sec bins |
 |
 |
| Module-wise count rates for Quadrant D Data is divided into 100 sec bins |
 |
 |
| Parameter | Plot |
|---|---|
| CZT HV Monitor | 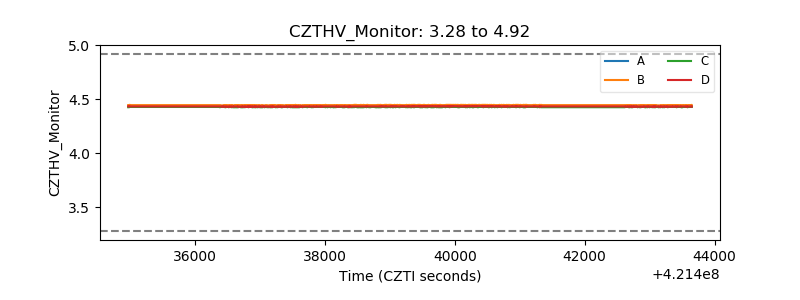 |
| D_VDD | 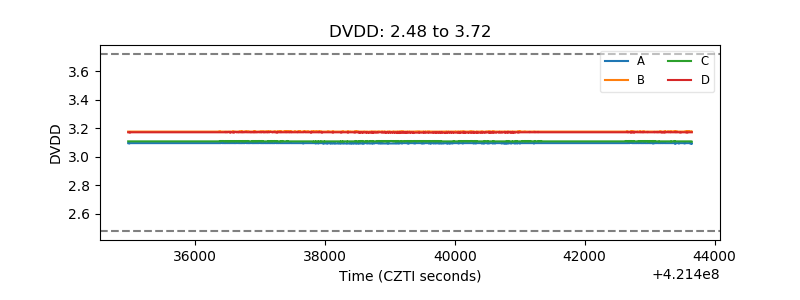 |
| Temperature 1 | 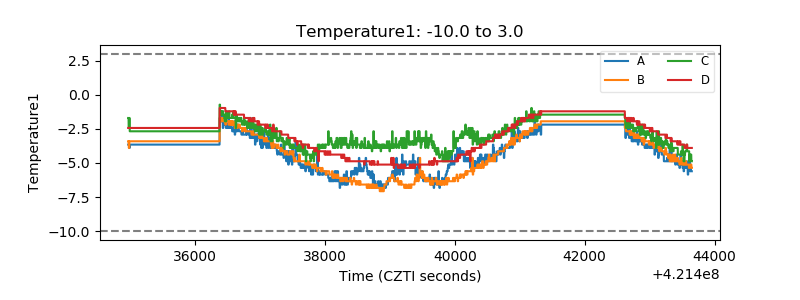 |
| Veto HV Monitor | 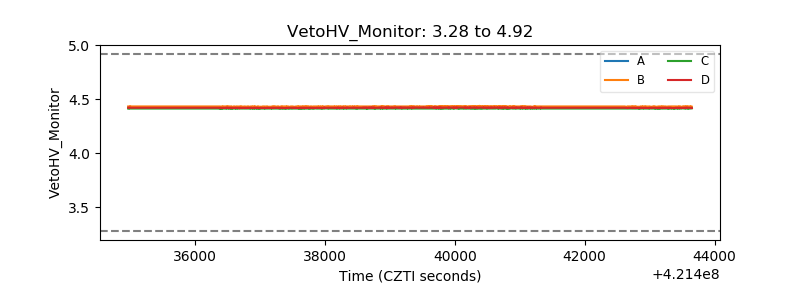 |
| Veto LLD | 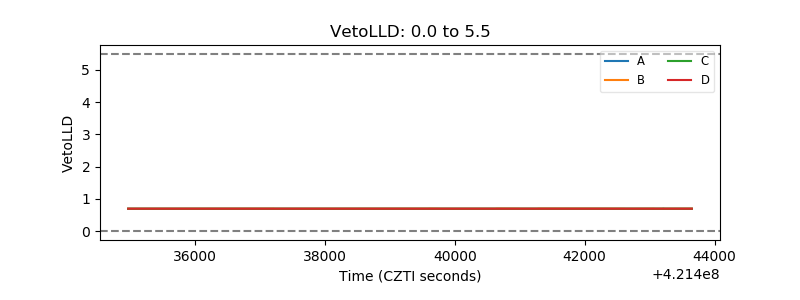 |
| Alpha Counter | 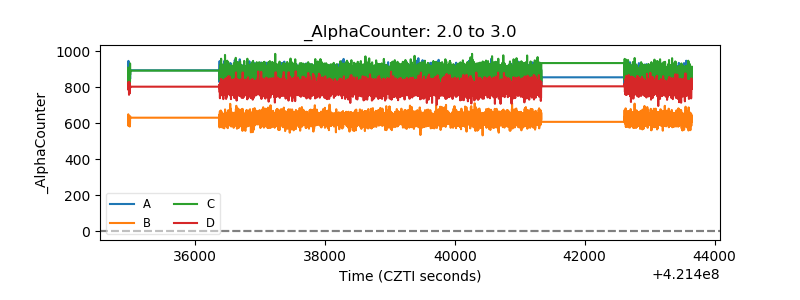 |
| _CPM_Rate | 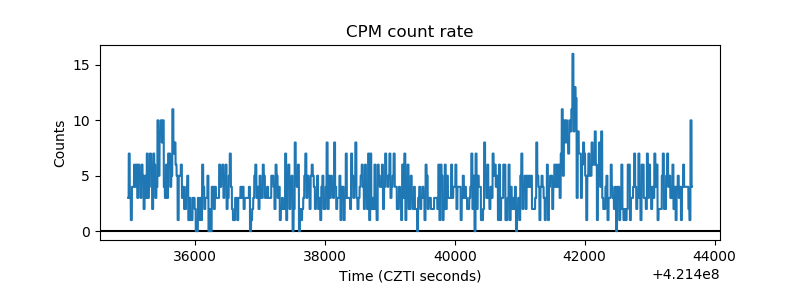 |
| CZT Counter | 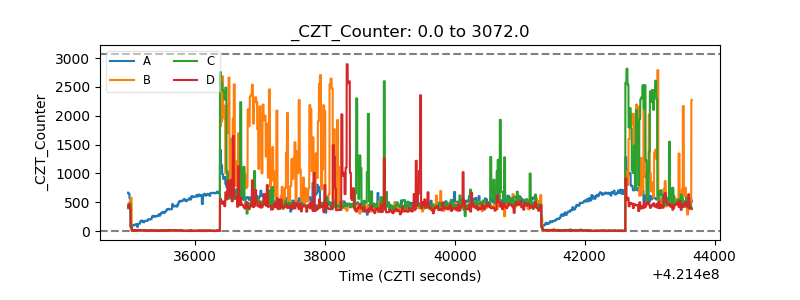 |
| +2.5 Volts monitor | 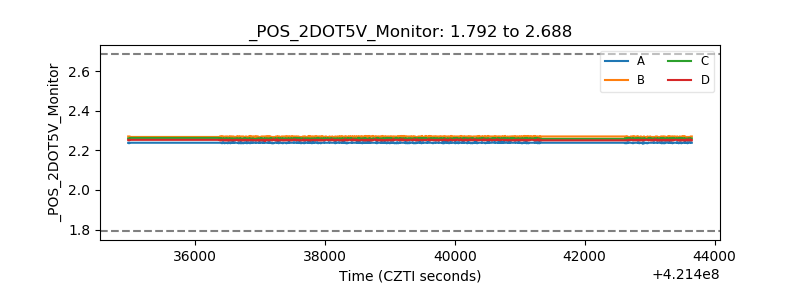 |
| +5 Volts monitor |  |
| _ROLL_ROT | 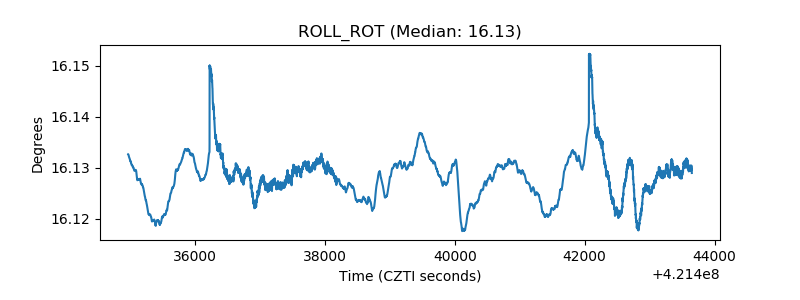 |
| _Roll_DEC | 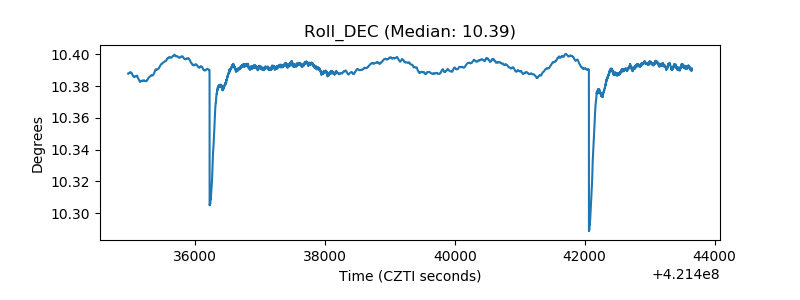 |
| _Roll_RA | 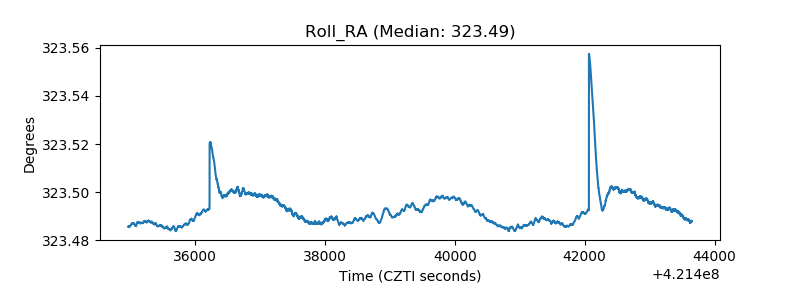 |
| Veto Counter | 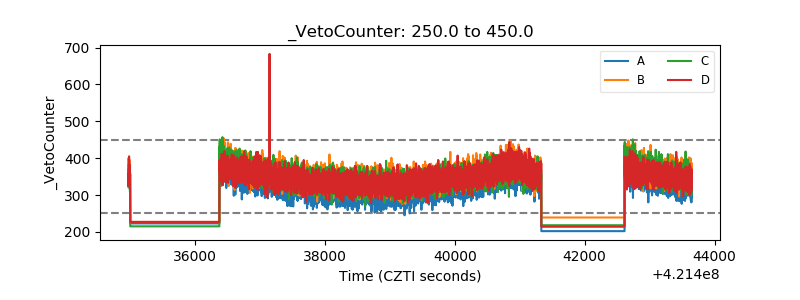 |