| Param | Original file | Final file |
|---|---|---|
| Filename | modeM0/AS1A12_101T04_9000005610_41178cztM0_level2.fits | modeM0/AS1A12_101T04_9000005610_41178cztM0_level2_quad_clean.evt |
| Size (bytes) | 166,498,560 | 32,495,040 |
| Size | 158.8 MB | 31.0 MB |
| Events in quadrant A | 1,193,219 | 231,520 |
| Events in quadrant B | 1,852,635 | 212,742 |
| Events in quadrant C | 1,960,231 | 182,105 |
| Events in quadrant D | 991,306 | 205,484 |
| Mode M0 | |||
|---|---|---|---|
| Quadrant | BADHDUFLAG | Total packets | Discarded packets |
| A | 0 | 4794 | 1 |
| B | 0 | 6924 | 1 |
| C | 0 | 7184 | 1 |
| D | 0 | 4454 | 1 |
| Mode SS | |||
|---|---|---|---|
| Quadrant | BADHDUFLAG | Total packets | Discarded packets |
| A | 0 | 44 | 0 |
| B | 0 | 44 | 0 |
| C | 0 | 44 | 0 |
| D | 0 | 44 | 0 |
| Mode M9 | |||
|---|---|---|---|
| Quadrant | BADHDUFLAG | Total packets | Discarded packets |
| A | 0 | 13 | 0 |
| B | 0 | 13 | 0 |
| C | 0 | 13 | 0 |
| D | 0 | 13 | 0 |
| Quadrant | Total seconds | Saturated seconds | Saturation percentage |
|---|---|---|---|
| A | 2099 | 7 | 0.333492% |
| B | 2099 | 264 | 12.577418% |
| C | 2099 | 389 | 18.532635% |
| D | 2099 | 11 | 0.524059% |
Noise dominated data is calculated using 1-second bins in cleaned event files. If a bin has >2000 counts, and if more than 50% of those come from <1% of pixels, then it is considered to be noise-dominated and hence unusable.
| Quadrant | # 1 sec bins | Bins with >0 counts | Bins with >2000 counts | High rate bins dominated by noise | Noise dominated (total time) | Noise dominated (detector-on time) | Marked lightcurve |
|---|---|---|---|---|---|---|---|
| A | 3381 | 2100 | 3 | 3 | 0.09% | 0.14% | 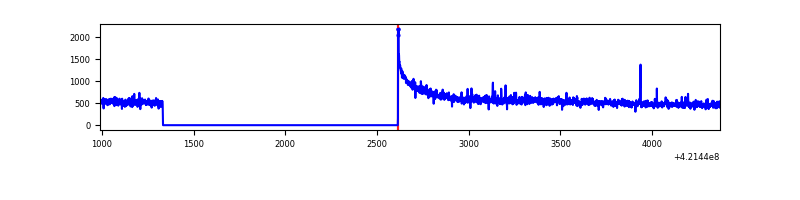 |
| B | 3381 | 2100 | 194 | 194 | 5.74% | 9.24% | 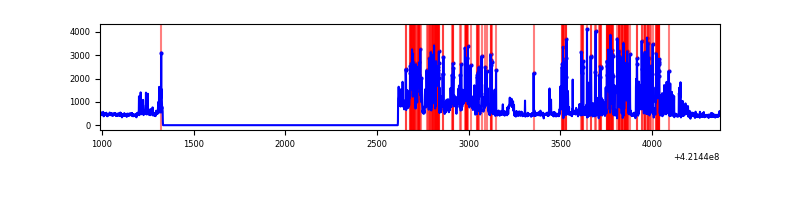 |
| C | 3381 | 2100 | 322 | 322 | 9.52% | 15.33% | 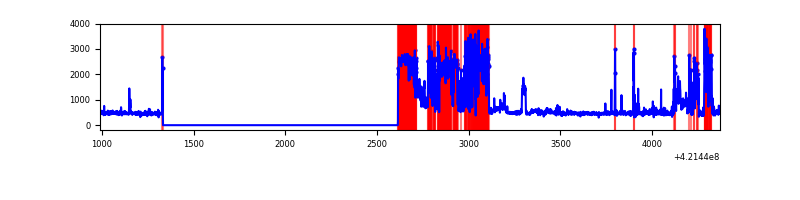 |
| D | 3381 | 2100 | 10 | 10 | 0.30% | 0.48% | 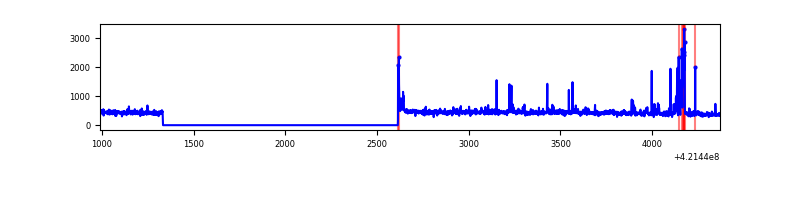 |
Top three noisy pixels from each quadrant. If the there are fewer than three noisy pixels in the level2.evt file, extra rows are filled as -1
| Pixel properties | Quadrant properties | ||||||
|---|---|---|---|---|---|---|---|
| Quadrant | DetID | PixID | Counts | Sigma | Mean | Median | Sigma |
| A | 10 | 83 | 240387 | 4797.9 | 233 | 228 | 50.1 |
| A | 12 | 189 | 28758 | 569.97 | 233 | 228 | 50.1 |
| A | 2 | 79 | 12764 | 250.44 | 233 | 228 | 50.1 |
| B | 0 | 245 | 536857 | 11806.68 | 221 | 215 | 45.5 |
| B | 0 | 186 | 169974 | 3734.87 | 221 | 215 | 45.5 |
| B | 0 | 229 | 157153 | 3452.8 | 221 | 215 | 45.5 |
| C | 9 | 54 | 899557 | 17923.13 | 206 | 207 | 50.2 |
| C | 0 | 10 | 164934 | 3282.84 | 206 | 207 | 50.2 |
| C | 15 | 214 | 83439 | 1658.73 | 206 | 207 | 50.2 |
| D | 13 | 249 | 68102 | 1173.68 | 225 | 218 | 57.8 |
| D | 2 | 249 | 29520 | 506.62 | 225 | 218 | 57.8 |
| D | 2 | 234 | 11758 | 199.52 | 225 | 218 | 57.8 |
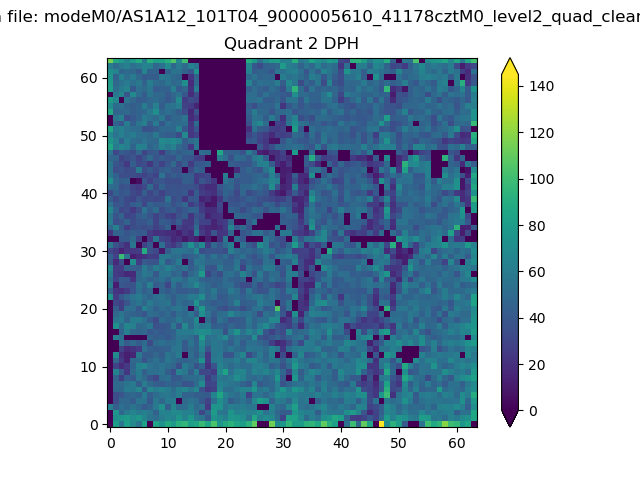
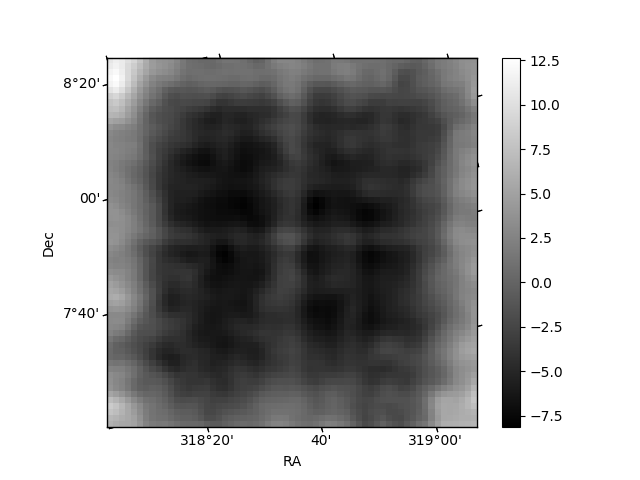
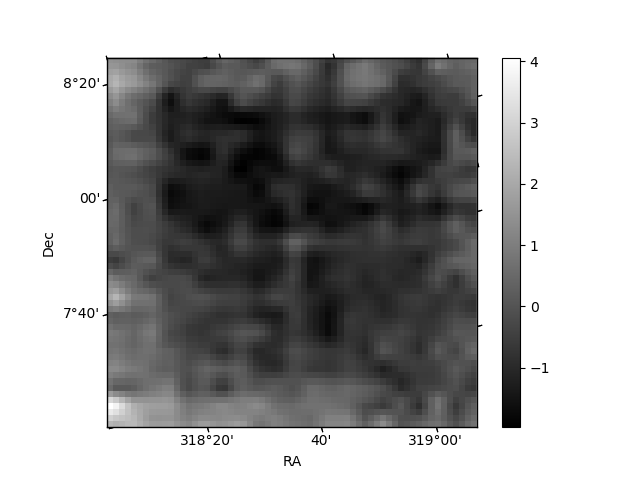
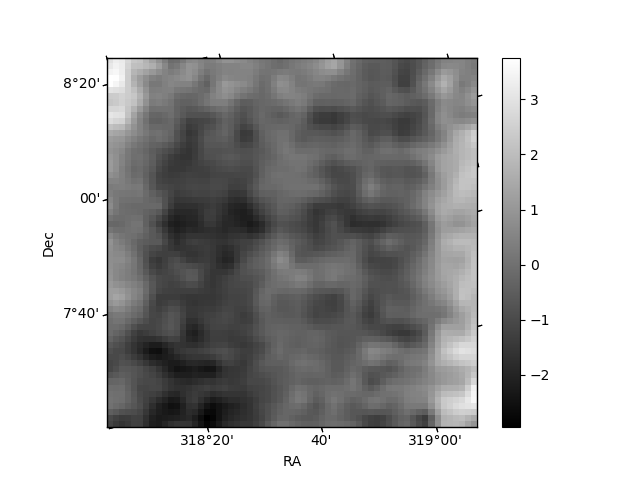
Histogram calculated using DETX and DETY for each event in the final _common_clean file
| Quadrant A | 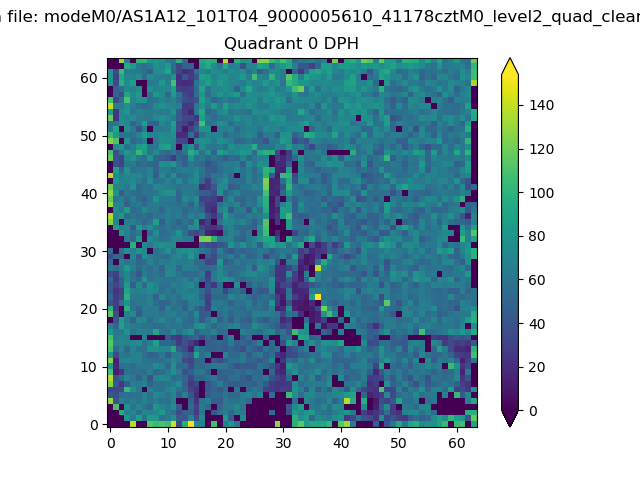 |
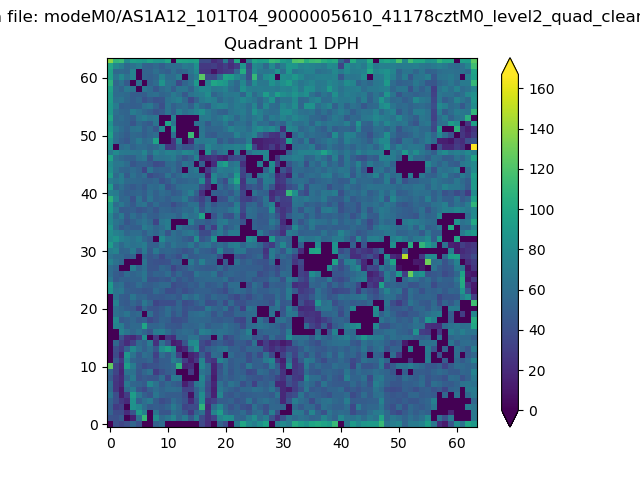 |
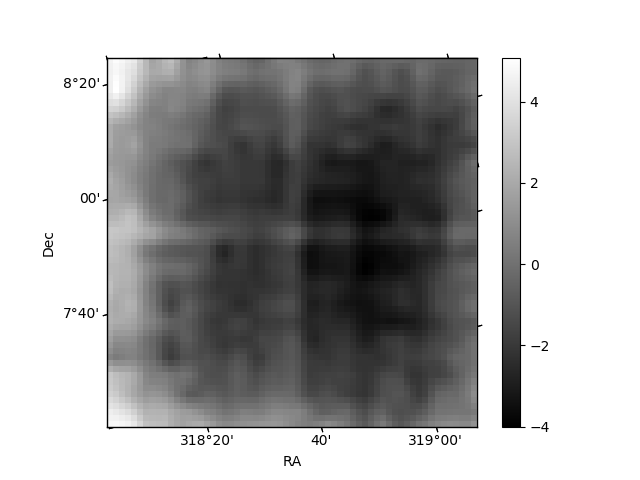
Quadrant B |
|---|---|---|---|
| Quadrant D | 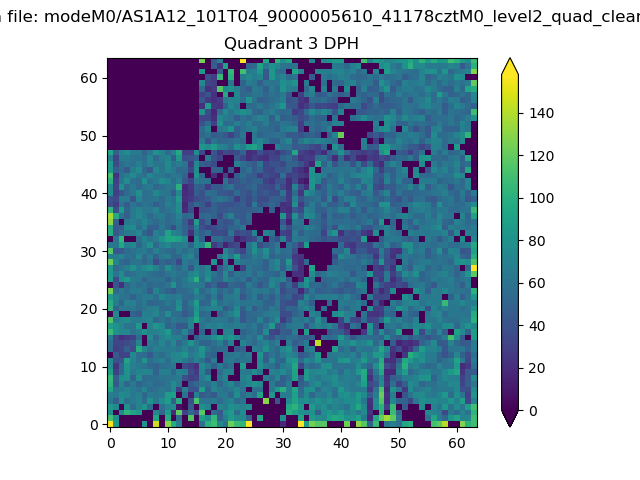 |
 |
Quadrant C |
| Plot type | Count rate plots | Images |
|---|---|---|
| Comparison with Poisson distribution Blue bars denote a histogram of data divided into 1 sec bins. Red curve is a Poisson curve with rate = median count rate of data. |
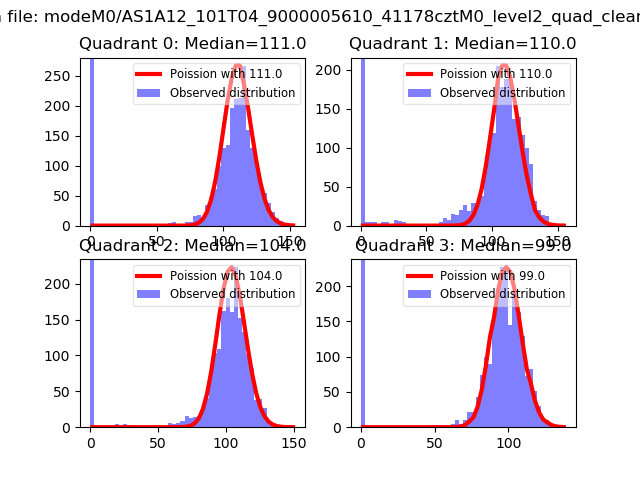 |
 |
| Quadrant-wise count rates Data is divided into 100 sec bins |
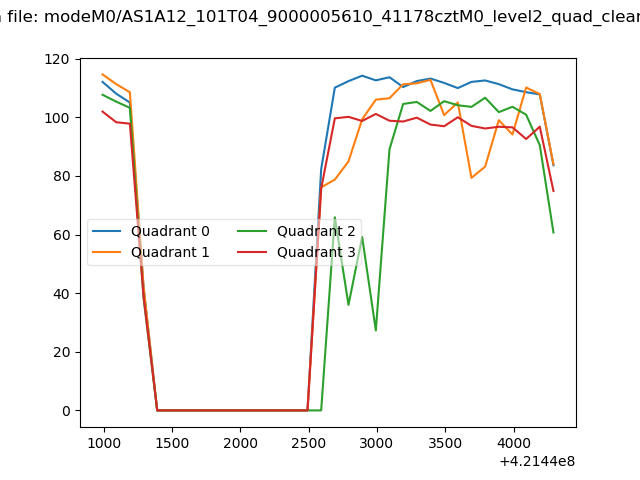 |
|
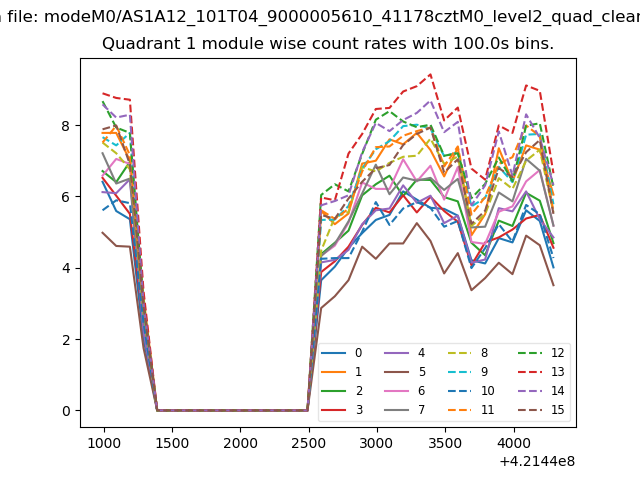
| Module-wise count rates for Quadrant A Data is divided into 100 sec bins |
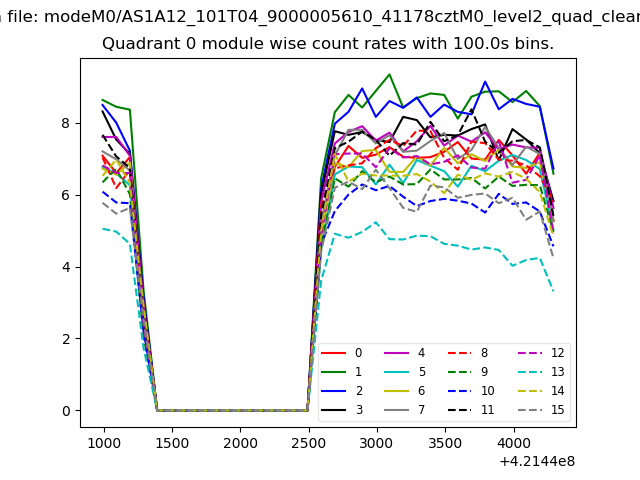 |
 |
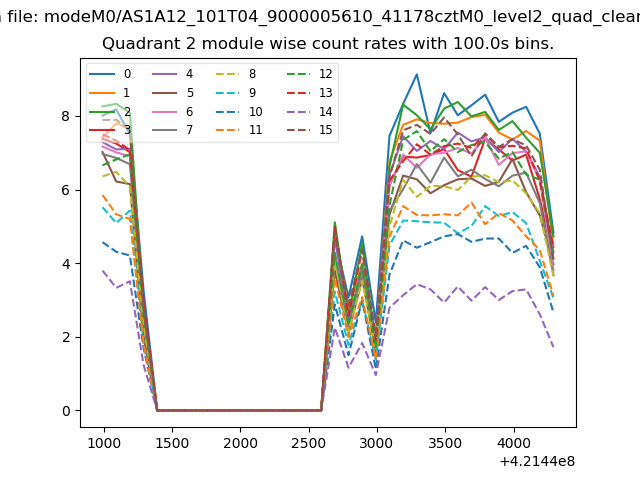
| Module-wise count rates for Quadrant B Data is divided into 100 sec bins |
 |
 |
| Module-wise count rates for Quadrant C Data is divided into 100 sec bins |
 |
 |
| Module-wise count rates for Quadrant D Data is divided into 100 sec bins |
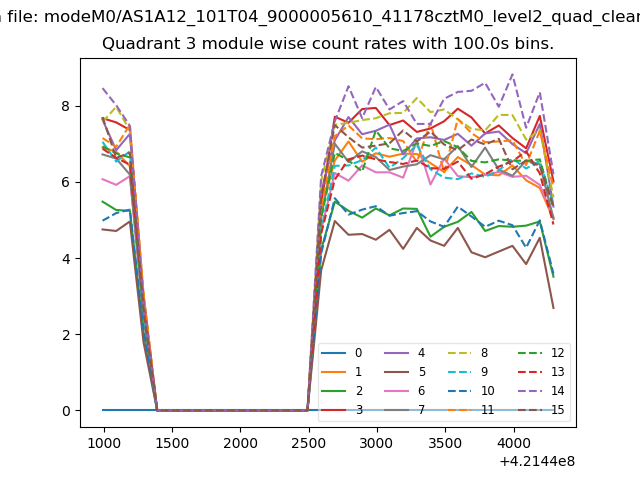 |
 |
| Parameter | Plot |
|---|---|
| CZT HV Monitor | 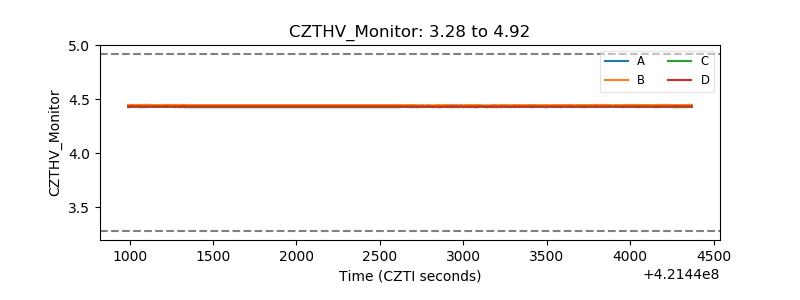 |
| D_VDD | 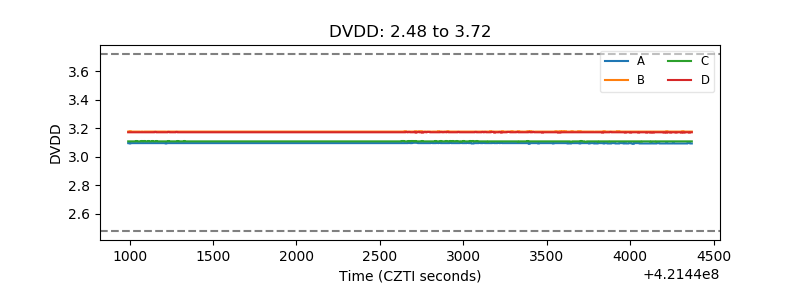 |
| Temperature 1 | 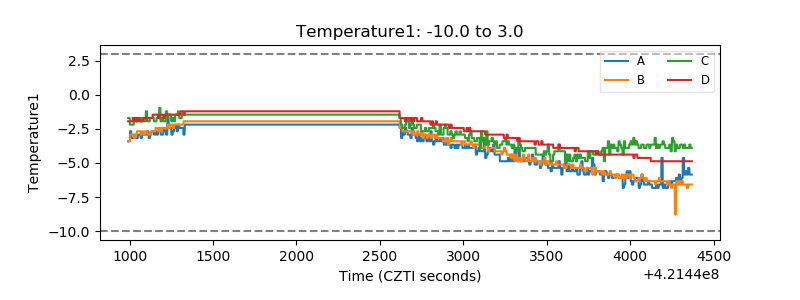 |
| Veto HV Monitor | 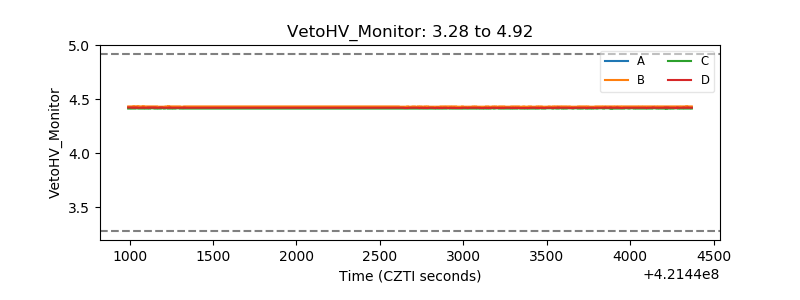 |
| Veto LLD | 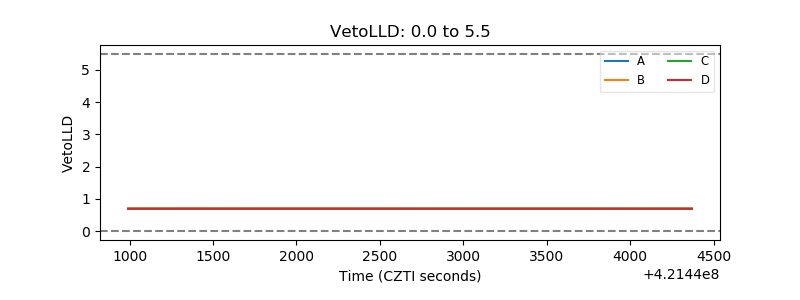 |
| Alpha Counter | 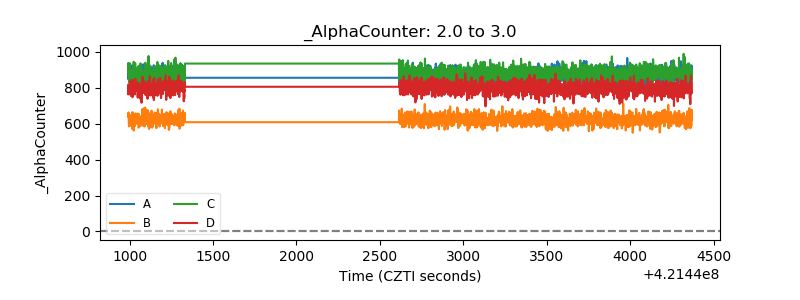 |
| _CPM_Rate | 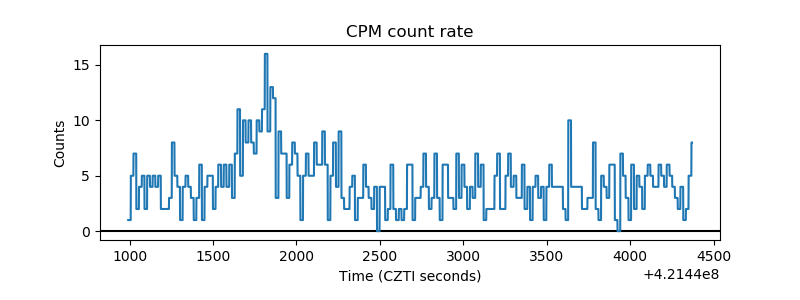 |
| CZT Counter | 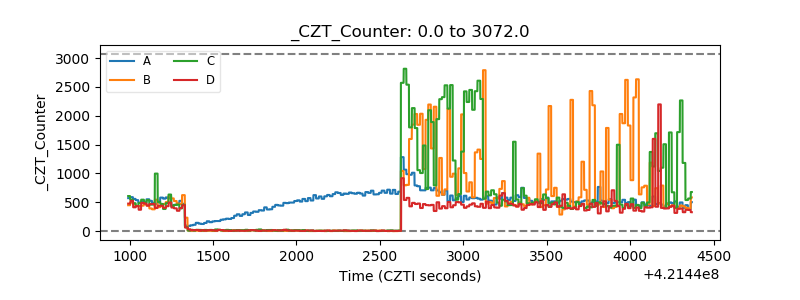 |
| +2.5 Volts monitor | 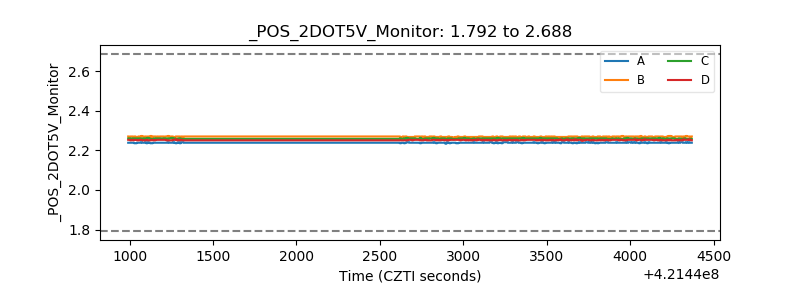 |
| +5 Volts monitor | 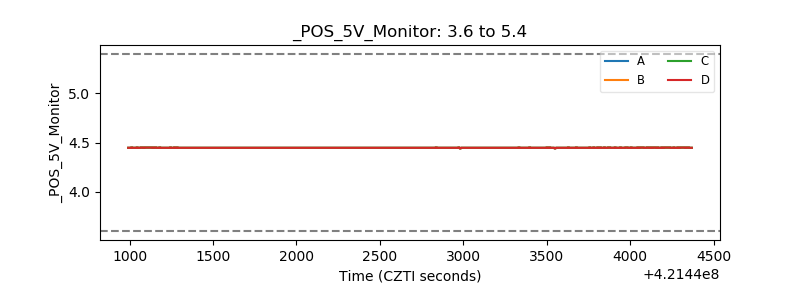 |
| _ROLL_ROT | 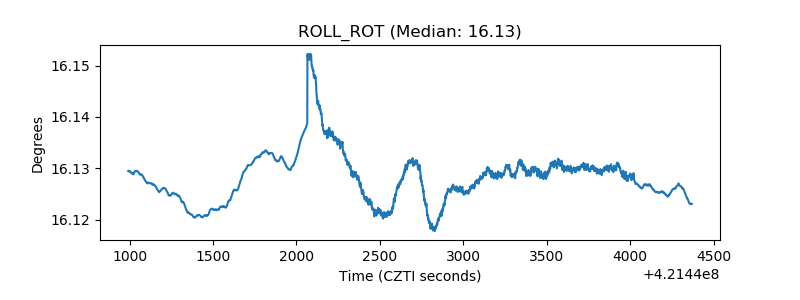 |
| _Roll_DEC | 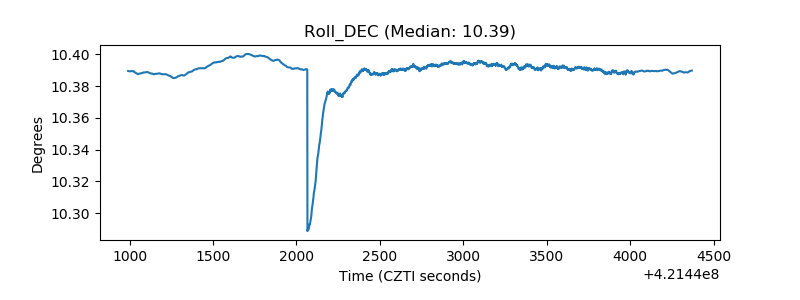 |
| _Roll_RA | 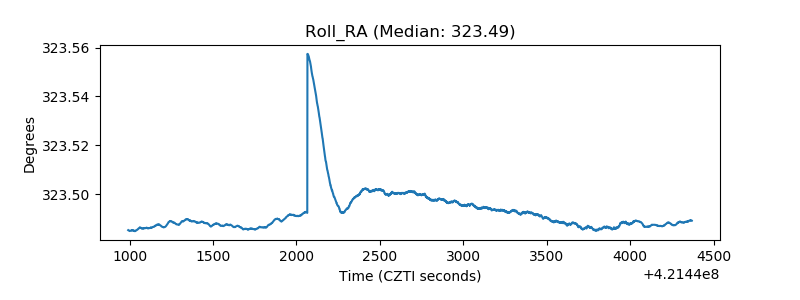 |
| Veto Counter | 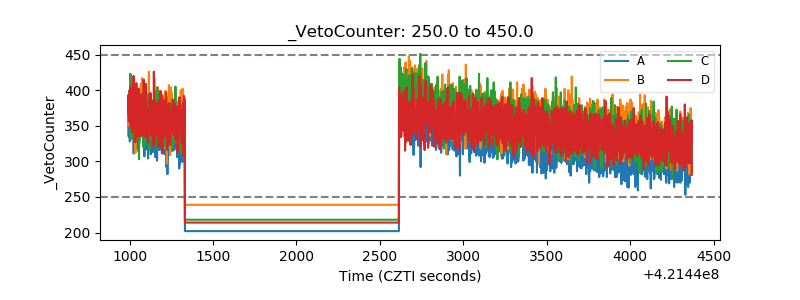 |