| Param | Original file | Final file |
|---|---|---|
| Filename | modeM0/AS1A12_089T10_9000005614_41186cztM0_level2.fits | modeM0/AS1A12_089T10_9000005614_41186cztM0_level2_quad_clean.evt |
| Size (bytes) | 88,490,880 | 20,257,920 |
| Size | 84.4 MB | 19.3 MB |
| Events in quadrant A | 731,466 | 139,976 |
| Events in quadrant B | 685,392 | 144,383 |
| Events in quadrant C | 1,107,312 | 117,120 |
| Events in quadrant D | 656,977 | 123,667 |
| Mode SS | |||
|---|---|---|---|
| Quadrant | BADHDUFLAG | Total packets | Discarded packets |
| A | 0 | 24 | 0 |
| B | 0 | 24 | 0 |
| C | 0 | 24 | 0 |
| D | 0 | 24 | 0 |
| Mode M0 | |||
|---|---|---|---|
| Quadrant | BADHDUFLAG | Total packets | Discarded packets |
| A | 0 | 2894 | 2 |
| B | 0 | 2766 | 1 |
| C | 0 | 3983 | 1 |
| D | 0 | 2729 | 1 |
| Mode M9 | |||
|---|---|---|---|
| Quadrant | BADHDUFLAG | Total packets | Discarded packets |
| A | 0 | 22 | 0 |
| B | 0 | 22 | 0 |
| C | 0 | 22 | 0 |
| D | 0 | 22 | 0 |
| Quadrant | Total seconds | Saturated seconds | Saturation percentage |
|---|---|---|---|
| A | 1174 | 8 | 0.681431% |
| B | 1174 | 12 | 1.022147% |
| C | 1174 | 200 | 17.035775% |
| D | 1174 | 41 | 3.492334% |
Noise dominated data is calculated using 1-second bins in cleaned event files. If a bin has >2000 counts, and if more than 50% of those come from <1% of pixels, then it is considered to be noise-dominated and hence unusable.
| Quadrant | # 1 sec bins | Bins with >0 counts | Bins with >2000 counts | High rate bins dominated by noise | Noise dominated (total time) | Noise dominated (detector-on time) | Marked lightcurve |
|---|---|---|---|---|---|---|---|
| A | 3297 | 1175 | 1 | 1 | 0.03% | 0.09% | 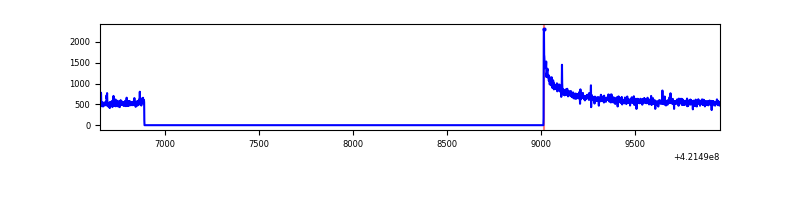 |
| B | 3297 | 1175 | 3 | 3 | 0.09% | 0.26% | 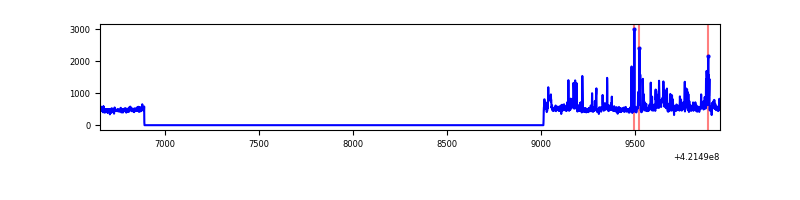 |
| C | 3297 | 1175 | 183 | 183 | 5.55% | 15.57% | 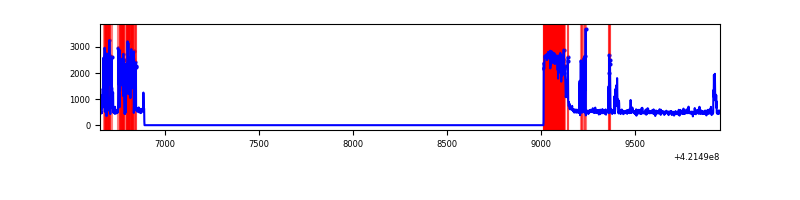 |
| D | 3297 | 1175 | 28 | 28 | 0.85% | 2.38% | 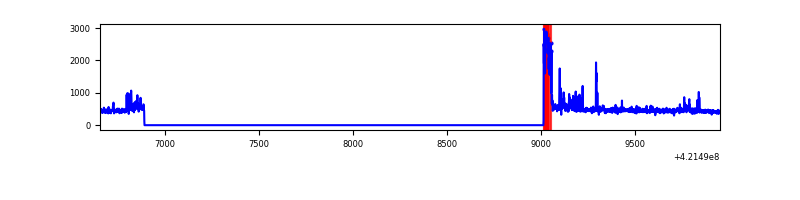 |
Top three noisy pixels from each quadrant. If the there are fewer than three noisy pixels in the level2.evt file, extra rows are filled as -1
| Pixel properties | Quadrant properties | ||||||
|---|---|---|---|---|---|---|---|
| Quadrant | DetID | PixID | Counts | Sigma | Mean | Median | Sigma |
| A | 10 | 83 | 172227 | 5697.99 | 140 | 137 | 30.2 |
| A | 12 | 189 | 5152 | 166.05 | 140 | 137 | 30.2 |
| A | 13 | 6 | 4507 | 144.69 | 140 | 137 | 30.2 |
| B | 0 | 229 | 109320 | 3826.76 | 137 | 134 | 28.5 |
| B | 0 | 186 | 22974 | 800.5 | 137 | 134 | 28.5 |
| B | 5 | 255 | 7764 | 267.42 | 137 | 134 | 28.5 |
| C | 9 | 54 | 289358 | 9364.36 | 126 | 126 | 30.9 |
| C | 0 | 10 | 273251 | 8842.87 | 126 | 126 | 30.9 |
| C | 15 | 214 | 50790 | 1640.33 | 126 | 126 | 30.9 |
| D | 13 | 249 | 100958 | 2991.73 | 134 | 130 | 33.7 |
| D | 12 | 233 | 19242 | 567.08 | 134 | 130 | 33.7 |
| D | 2 | 249 | 16074 | 473.08 | 134 | 130 | 33.7 |
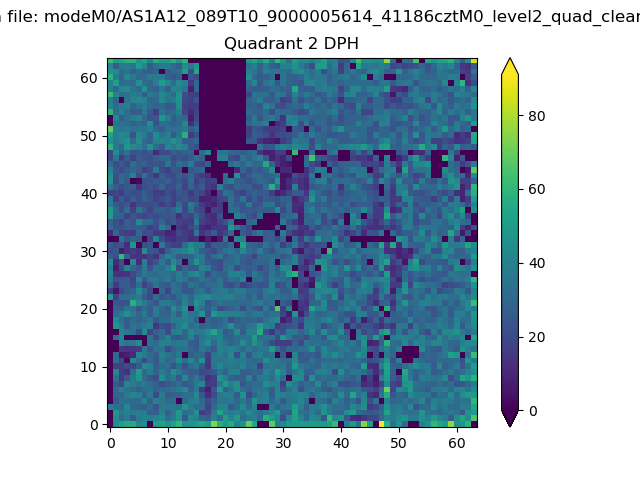
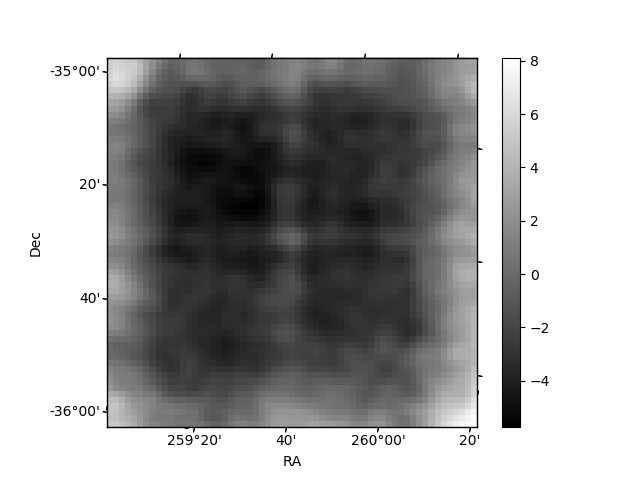
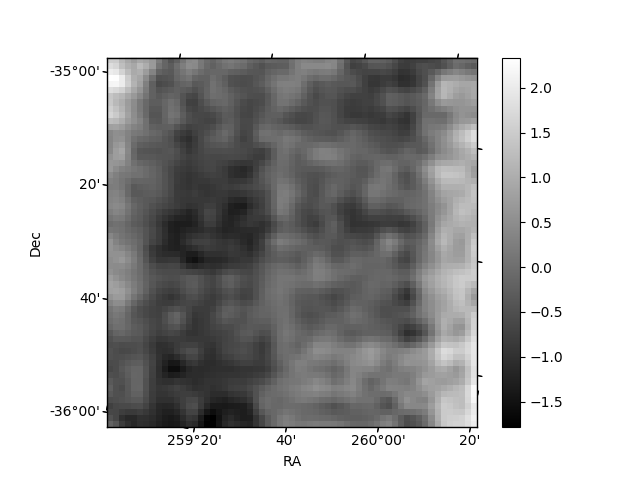
Histogram calculated using DETX and DETY for each event in the final _common_clean file
| Quadrant A | 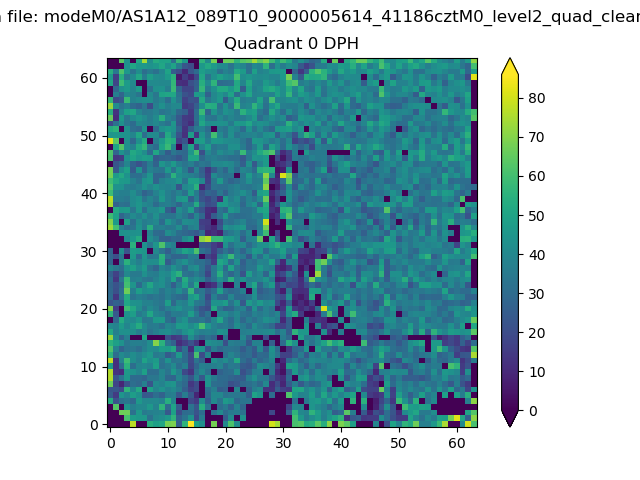 |
 |
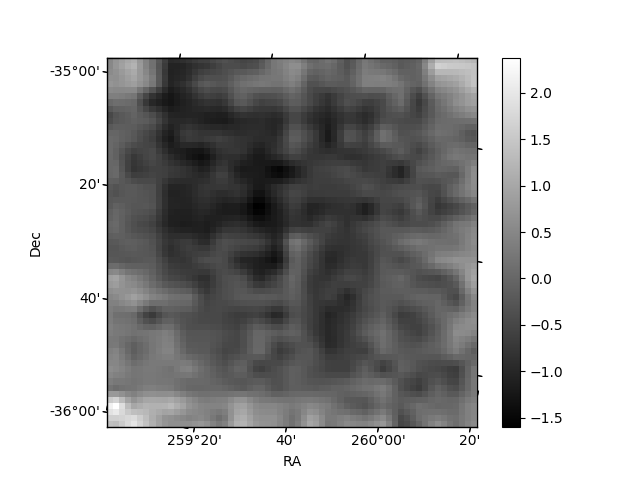
Quadrant B |
|---|---|---|---|
| Quadrant D | 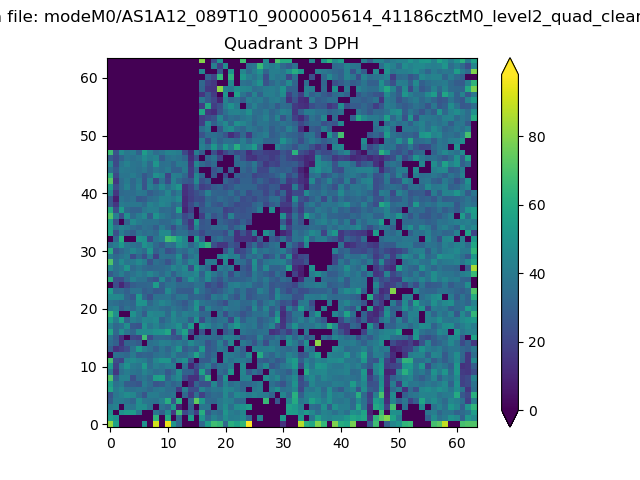 |
 |
Quadrant C |
| Plot type | Count rate plots | Images |
|---|---|---|
| Comparison with Poisson distribution Blue bars denote a histogram of data divided into 1 sec bins. Red curve is a Poisson curve with rate = median count rate of data. |
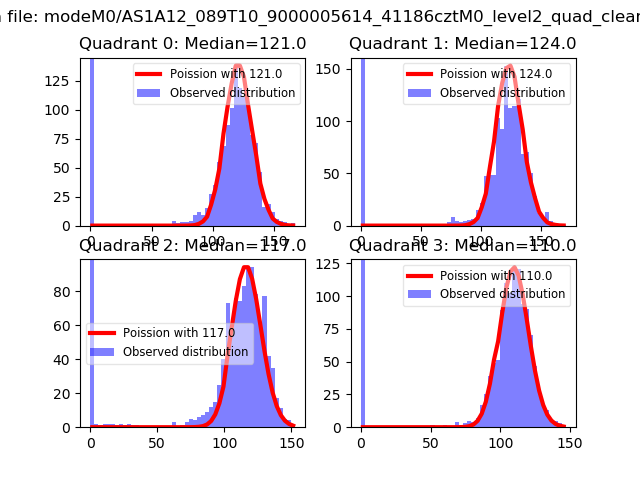 |
 |
| Quadrant-wise count rates Data is divided into 100 sec bins |
 |
|
| Module-wise count rates for Quadrant A Data is divided into 100 sec bins |
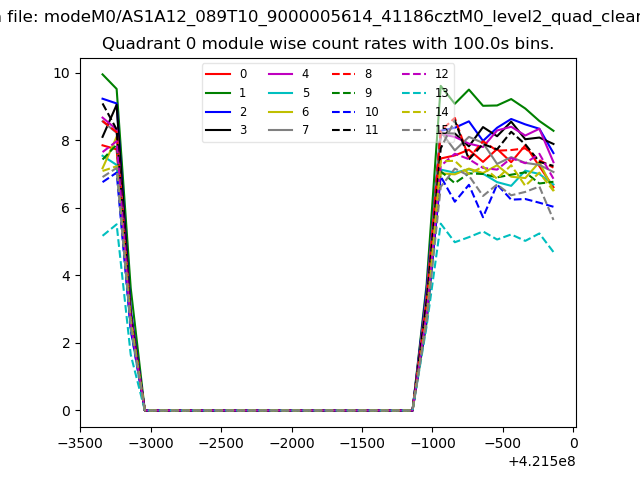 |
 |
| Module-wise count rates for Quadrant B Data is divided into 100 sec bins |
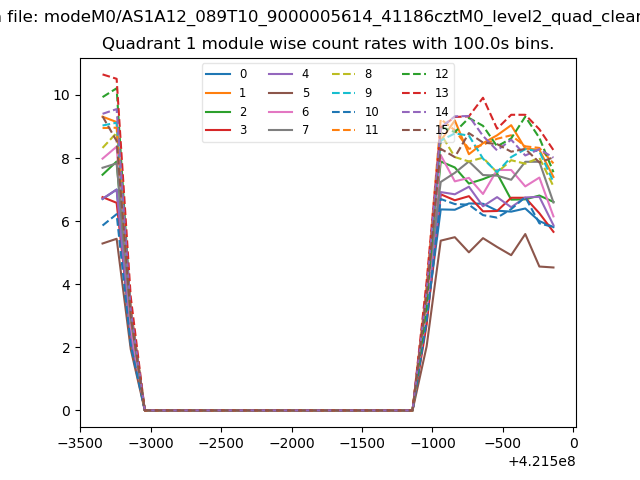 |
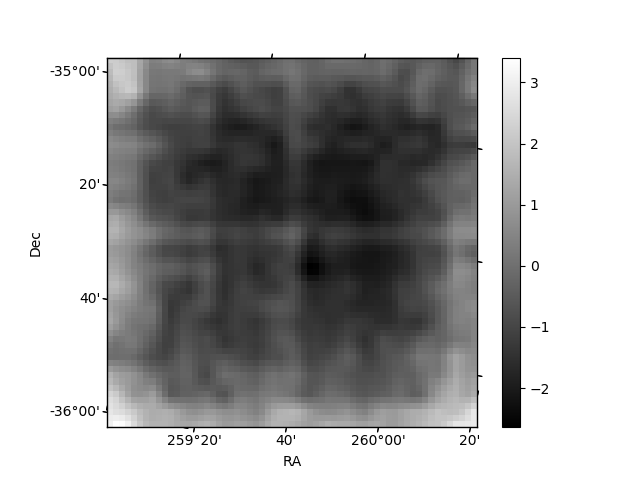 |
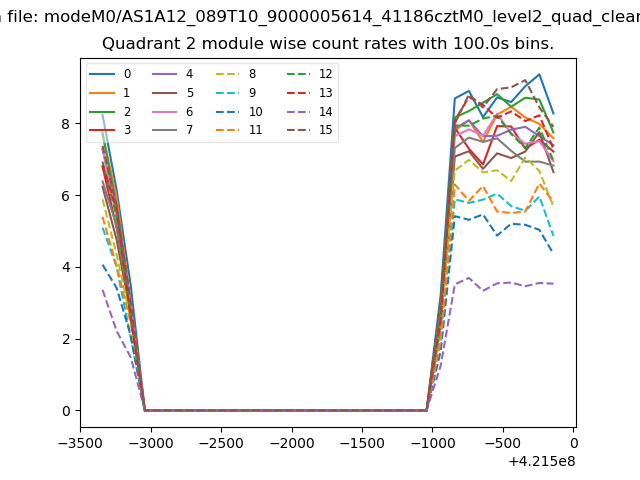
| Module-wise count rates for Quadrant C Data is divided into 100 sec bins |
 |
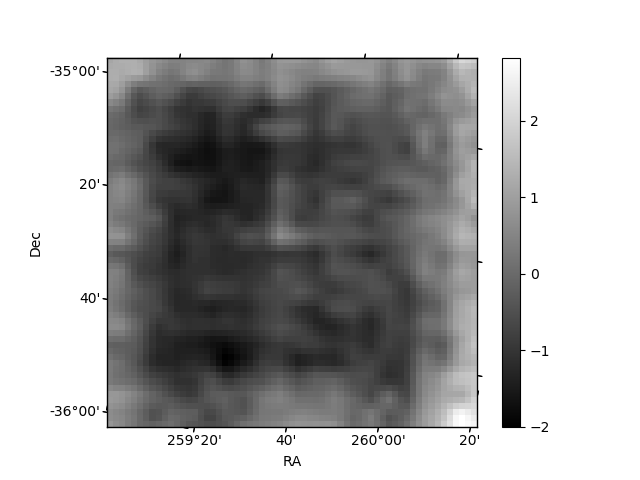 |
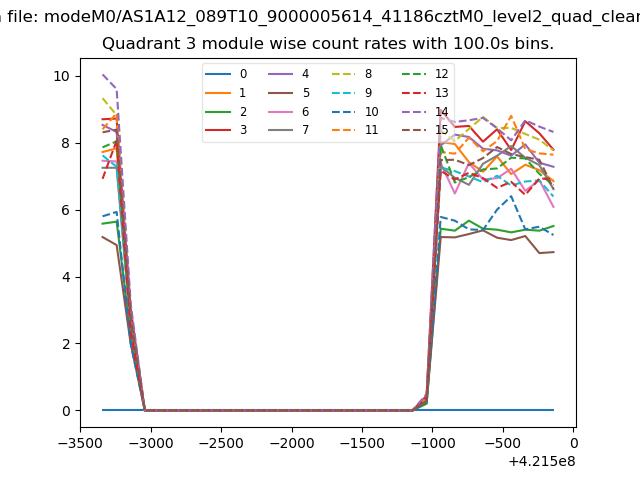
| Module-wise count rates for Quadrant D Data is divided into 100 sec bins |
 |
 |
| Parameter | Plot |
|---|---|
| CZT HV Monitor |  |
| D_VDD | 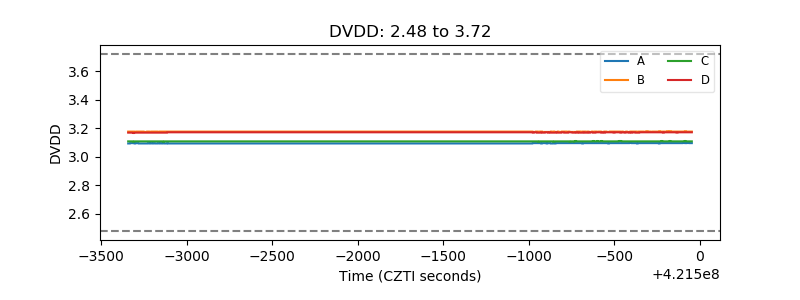 |
| Temperature 1 | 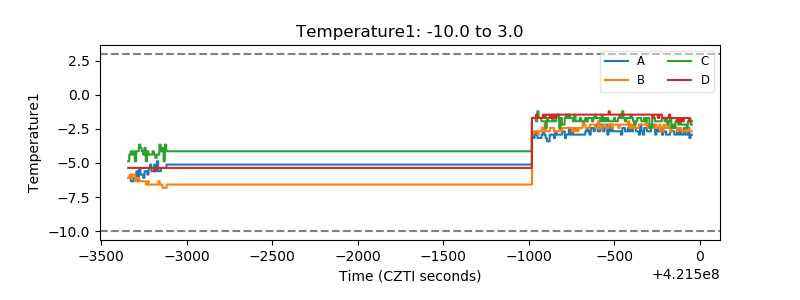 |
| Veto HV Monitor | 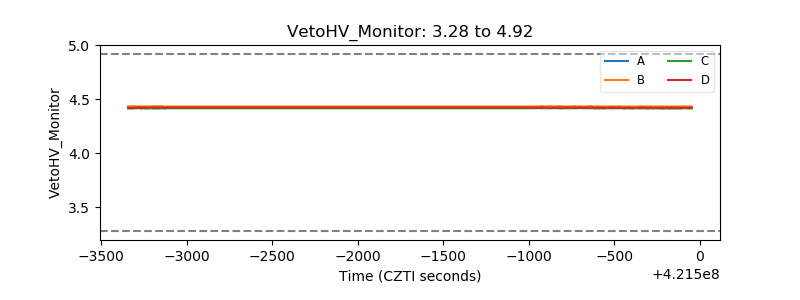 |
| Veto LLD | 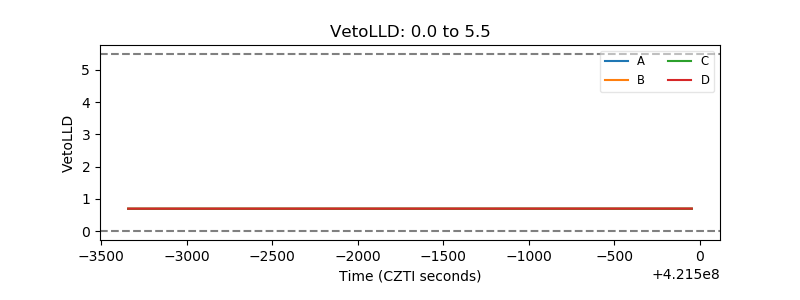 |
| Alpha Counter | 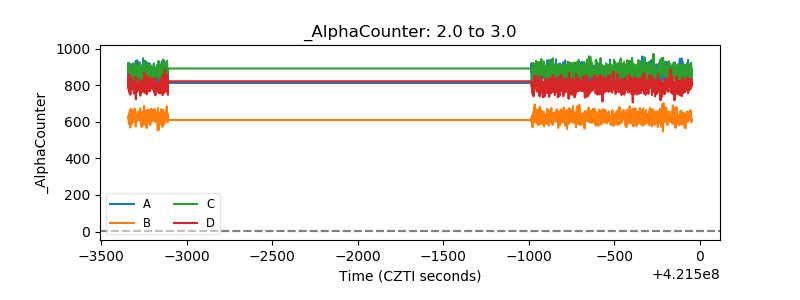 |
| _CPM_Rate | 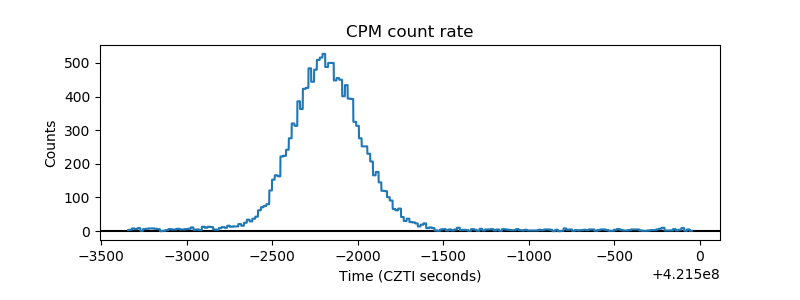 |
| CZT Counter | 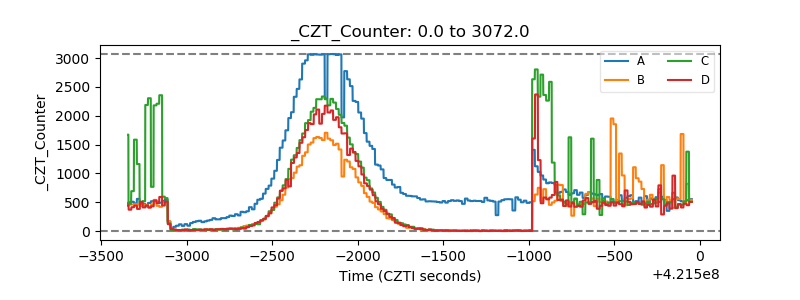 |
| +2.5 Volts monitor | 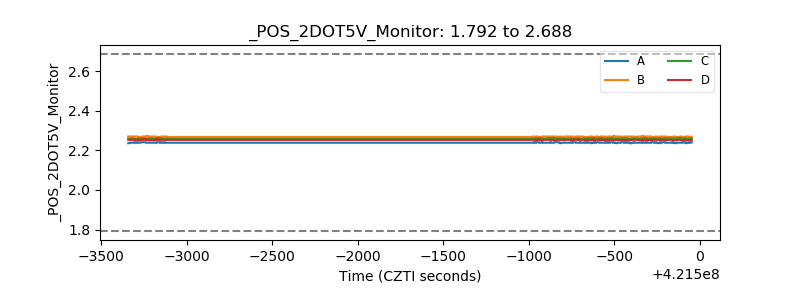 |
| +5 Volts monitor | 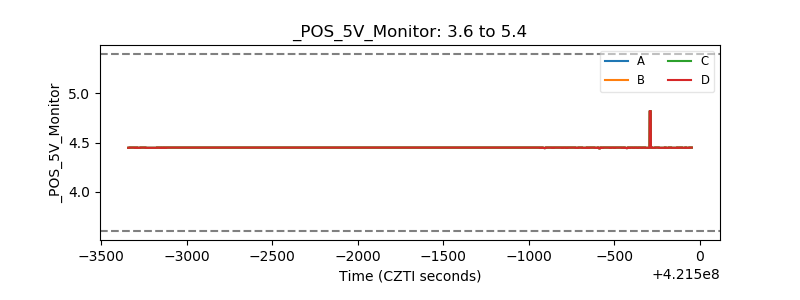 |
| _ROLL_ROT | 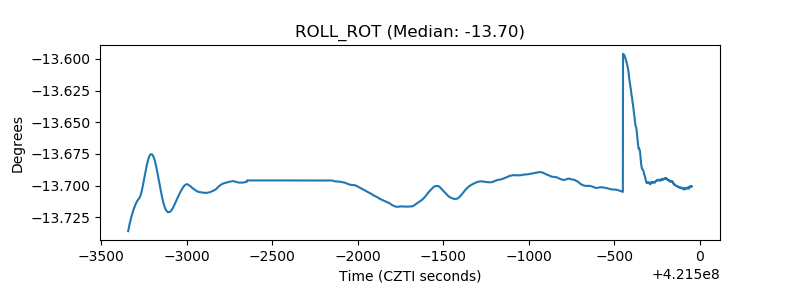 |
| _Roll_DEC | 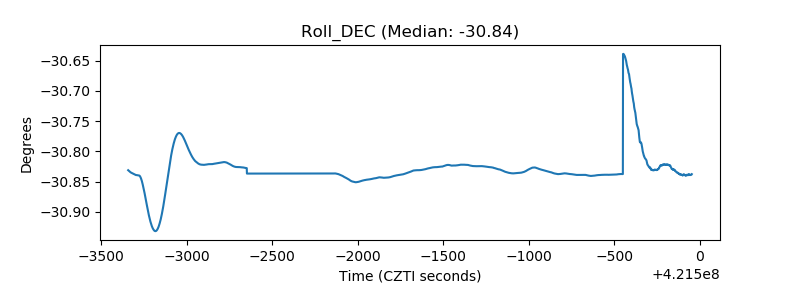 |
| _Roll_RA | 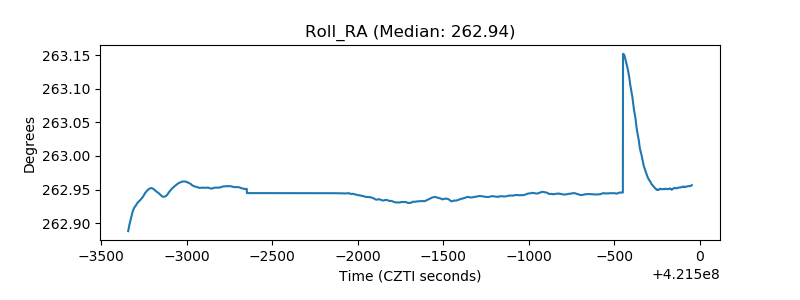 |
| Veto Counter | 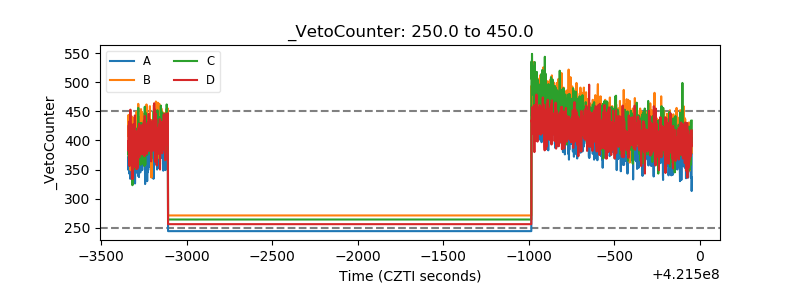 |