| Param | Original file | Final file |
|---|---|---|
| Filename | modeM0/AS1A12_089T10_9000005614_41187cztM0_level2.fits | modeM0/AS1A12_089T10_9000005614_41187cztM0_level2_quad_clean.evt |
| Size (bytes) | 277,153,920 | 71,406,720 |
| Size | 264.3 MB | 68.1 MB |
| Events in quadrant A | 2,196,696 | 491,475 |
| Events in quadrant B | 2,267,936 | 495,949 |
| Events in quadrant C | 3,449,761 | 438,257 |
| Events in quadrant D | 2,016,443 | 440,392 |
| Mode SS | |||
|---|---|---|---|
| Quadrant | BADHDUFLAG | Total packets | Discarded packets |
| A | 0 | 86 | 0 |
| B | 0 | 86 | 0 |
| C | 0 | 86 | 0 |
| D | 0 | 86 | 0 |
| Mode M0 | |||
|---|---|---|---|
| Quadrant | BADHDUFLAG | Total packets | Discarded packets |
| A | 0 | 9005 | 1 |
| B | 0 | 9614 | 1 |
| C | 0 | 12975 | 1 |
| D | 0 | 9130 | 1 |
| Mode M9 | |||
|---|---|---|---|
| Quadrant | BADHDUFLAG | Total packets | Discarded packets |
| A | 0 | 13 | 0 |
| B | 0 | 13 | 0 |
| C | 0 | 13 | 0 |
| D | 0 | 14 | 0 |
| Quadrant | Total seconds | Saturated seconds | Saturation percentage |
|---|---|---|---|
| A | 4206 | 8 | 0.190204% |
| B | 4206 | 68 | 1.616738% |
| C | 4206 | 421 | 10.009510% |
| D | 4206 | 52 | 1.236329% |
Noise dominated data is calculated using 1-second bins in cleaned event files. If a bin has >2000 counts, and if more than 50% of those come from <1% of pixels, then it is considered to be noise-dominated and hence unusable.
| Quadrant | # 1 sec bins | Bins with >0 counts | Bins with >2000 counts | High rate bins dominated by noise | Noise dominated (total time) | Noise dominated (detector-on time) | Marked lightcurve |
|---|---|---|---|---|---|---|---|
| A | 4206 | 4206 | 2 | 2 | 0.05% | 0.05% | 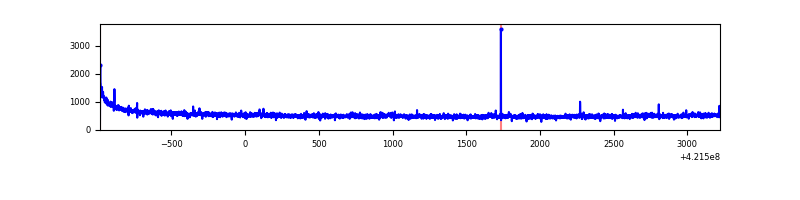 |
| B | 4206 | 4206 | 51 | 51 | 1.21% | 1.21% | 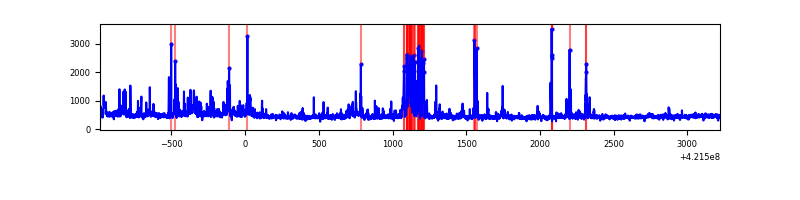 |
| C | 4205 | 4205 | 385 | 385 | 9.16% | 9.16% | 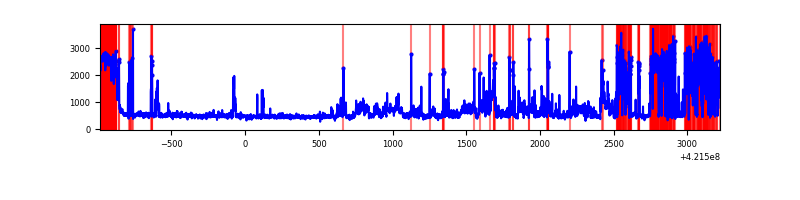 |
| D | 4206 | 4206 | 46 | 46 | 1.09% | 1.09% | 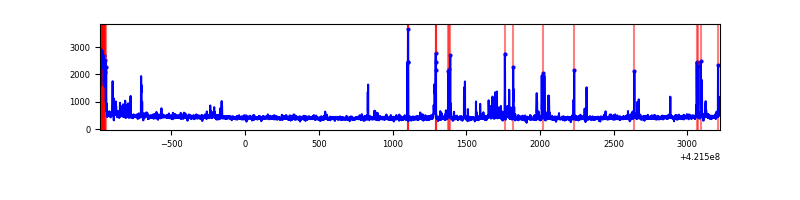 |
Top three noisy pixels from each quadrant. If the there are fewer than three noisy pixels in the level2.evt file, extra rows are filled as -1
| Pixel properties | Quadrant properties | ||||||
|---|---|---|---|---|---|---|---|
| Quadrant | DetID | PixID | Counts | Sigma | Mean | Median | Sigma |
| A | 10 | 83 | 354511 | 3706.2 | 466 | 457 | 95.5 |
| A | 12 | 189 | 17322 | 176.54 | 466 | 457 | 95.5 |
| A | 2 | 79 | 11967 | 120.49 | 466 | 457 | 95.5 |
| B | 0 | 229 | 233715 | 2602.86 | 461 | 449 | 89.6 |
| B | 5 | 255 | 166291 | 1850.52 | 461 | 449 | 89.6 |
| B | 0 | 186 | 42922 | 473.92 | 461 | 449 | 89.6 |
| C | 9 | 54 | 1297612 | 12770.26 | 436 | 439 | 101.6 |
| C | 0 | 10 | 275800 | 2710.84 | 436 | 439 | 101.6 |
| C | 15 | 214 | 171887 | 1687.85 | 436 | 439 | 101.6 |
| D | 13 | 249 | 162026 | 1460.57 | 450 | 438 | 110.6 |
| D | 2 | 249 | 86118 | 774.45 | 450 | 438 | 110.6 |
| D | 12 | 233 | 25416 | 225.77 | 450 | 438 | 110.6 |
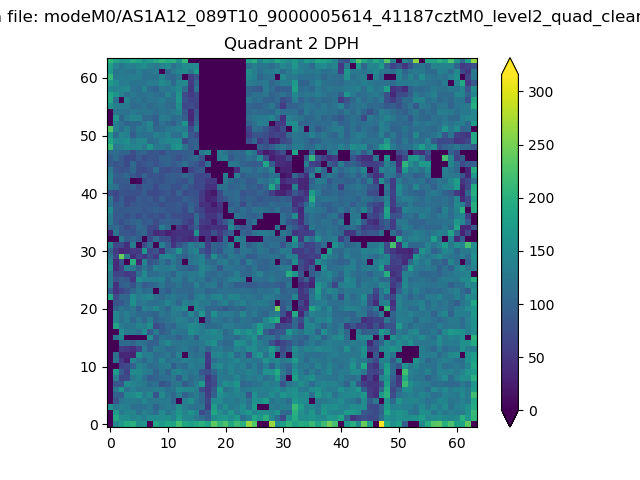
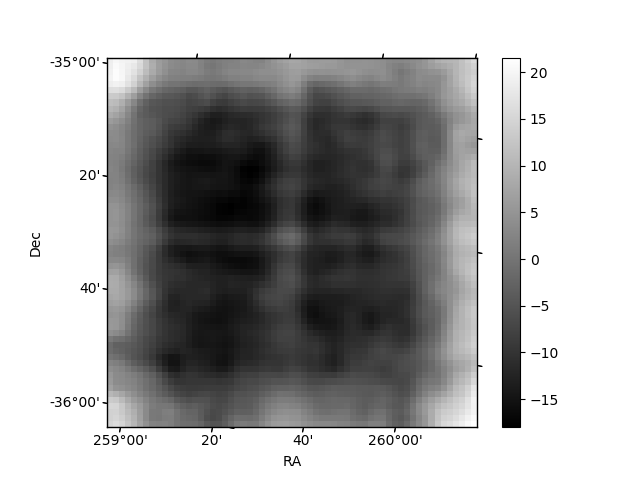
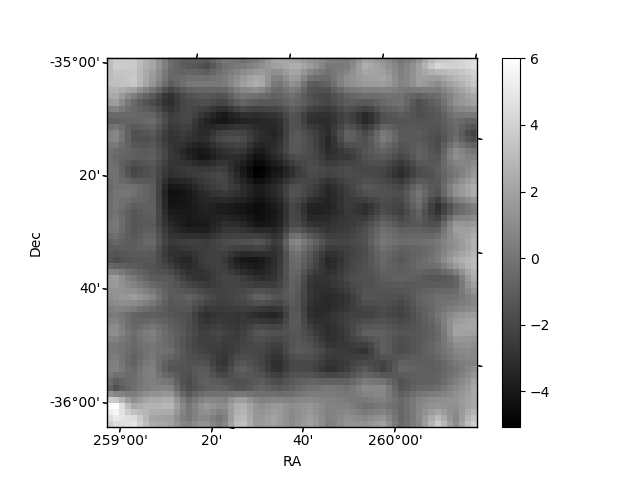
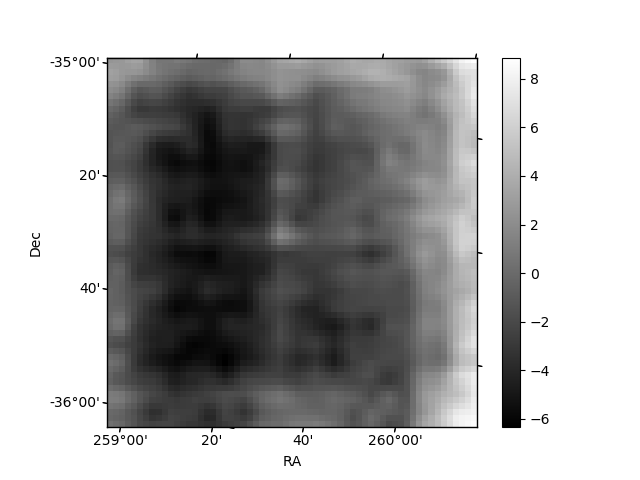
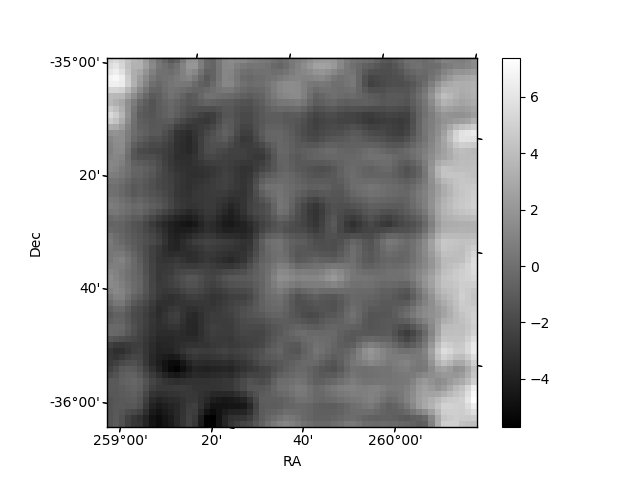
Histogram calculated using DETX and DETY for each event in the final _common_clean file
| Quadrant A | 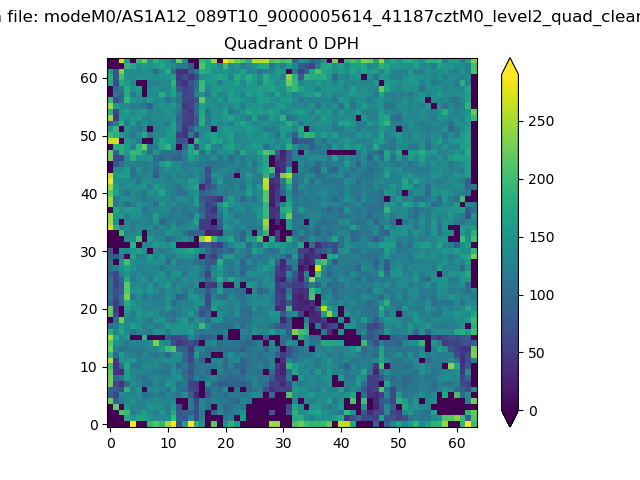 |
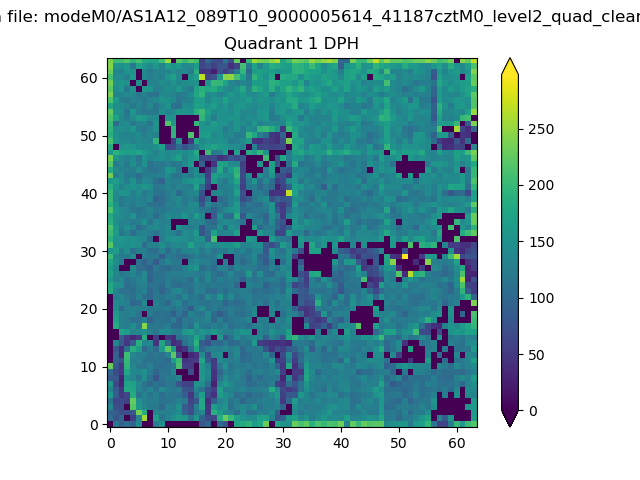 |
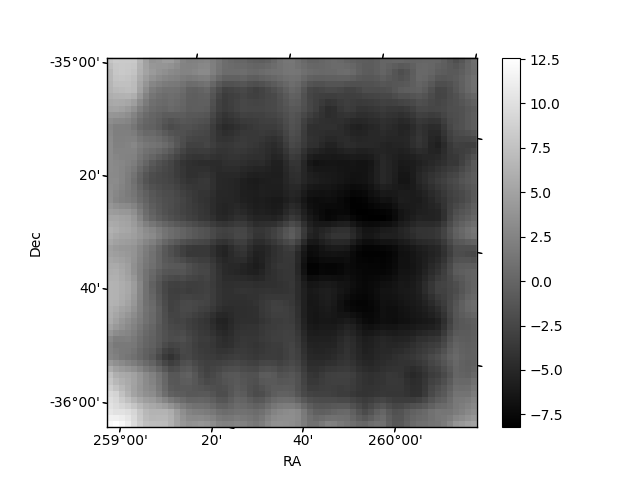
Quadrant B |
|---|---|---|---|
| Quadrant D | 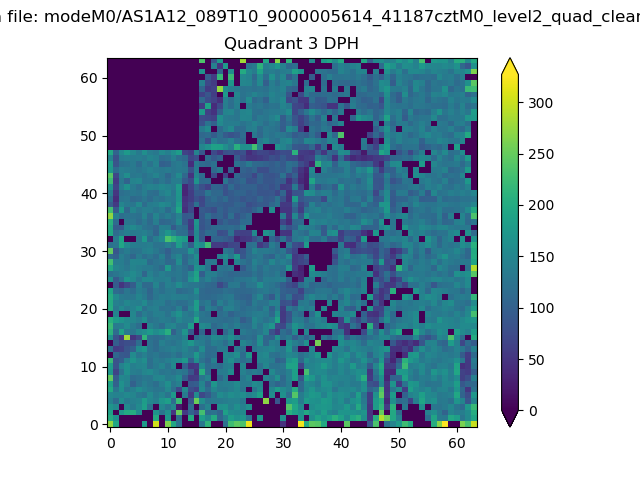 |
 |
Quadrant C |
| Plot type | Count rate plots | Images |
|---|---|---|
| Comparison with Poisson distribution Blue bars denote a histogram of data divided into 1 sec bins. Red curve is a Poisson curve with rate = median count rate of data. |
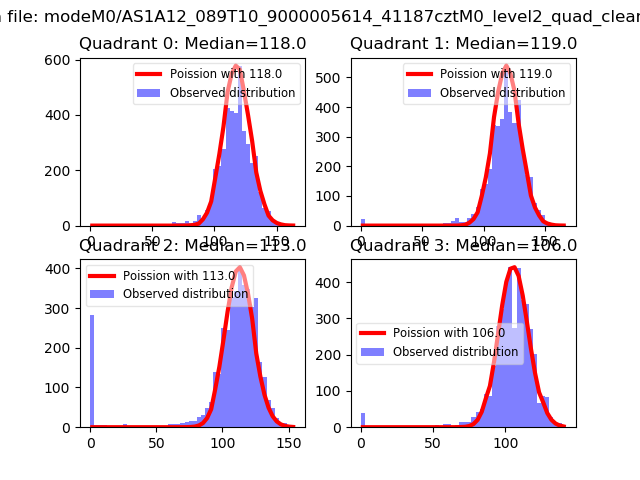 |
 |
| Quadrant-wise count rates Data is divided into 100 sec bins |
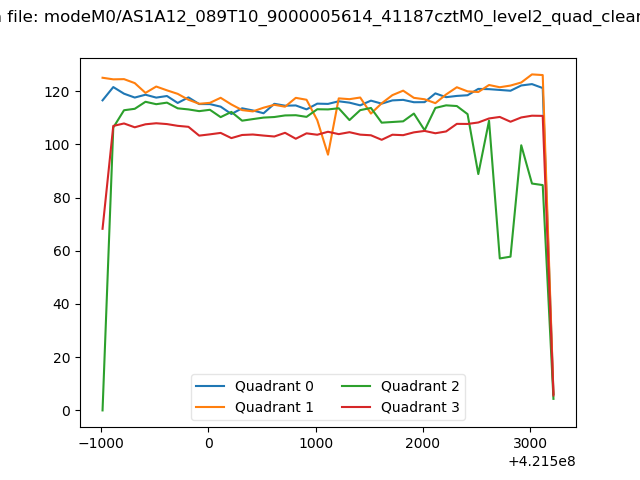 |
|
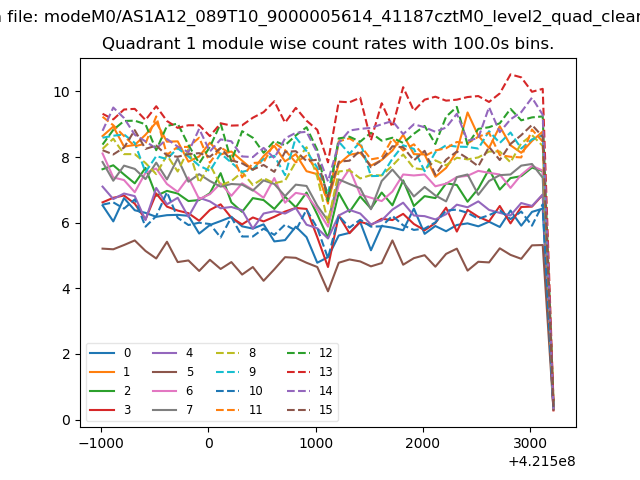
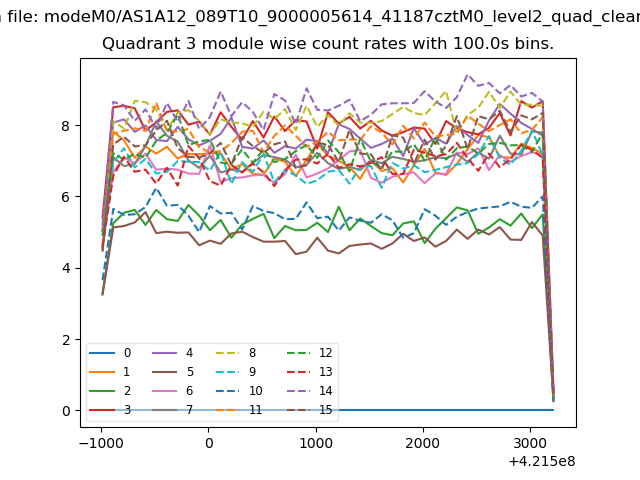
| Module-wise count rates for Quadrant A Data is divided into 100 sec bins |
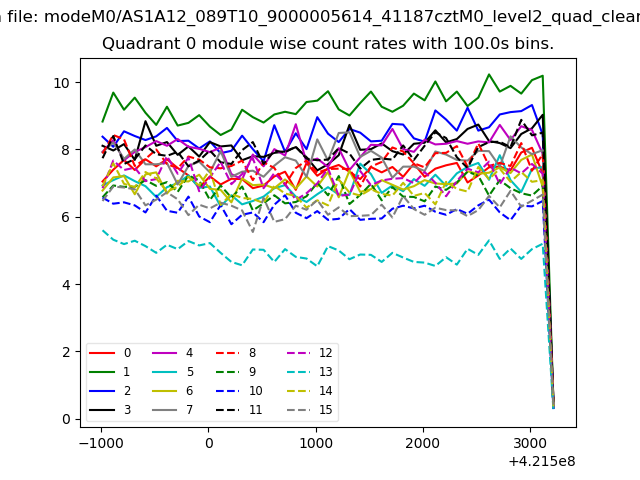 |
 |
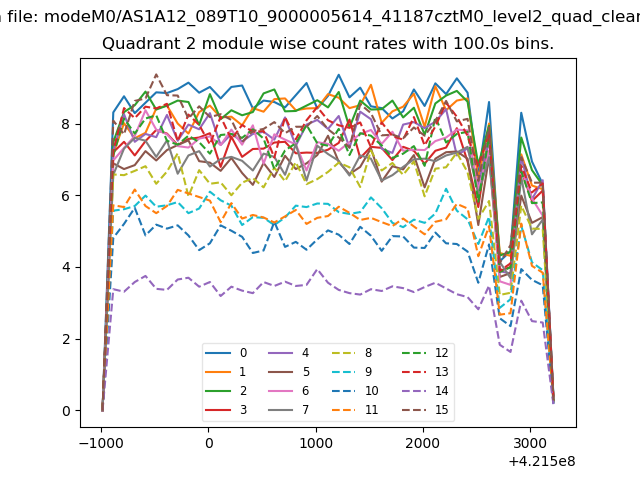
| Module-wise count rates for Quadrant B Data is divided into 100 sec bins |
 |
 |
| Module-wise count rates for Quadrant C Data is divided into 100 sec bins |
 |
 |
| Module-wise count rates for Quadrant D Data is divided into 100 sec bins |
 |
 |
| Parameter | Plot |
|---|---|
| CZT HV Monitor | 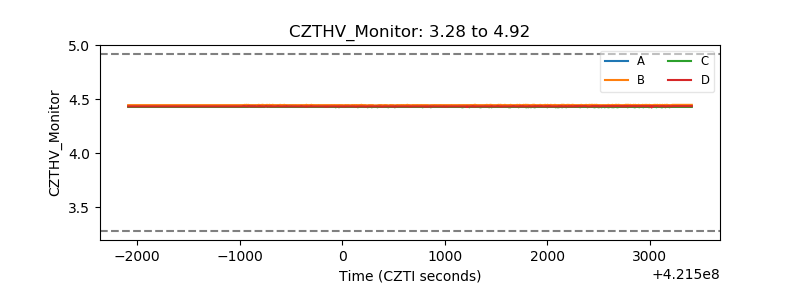 |
| D_VDD | 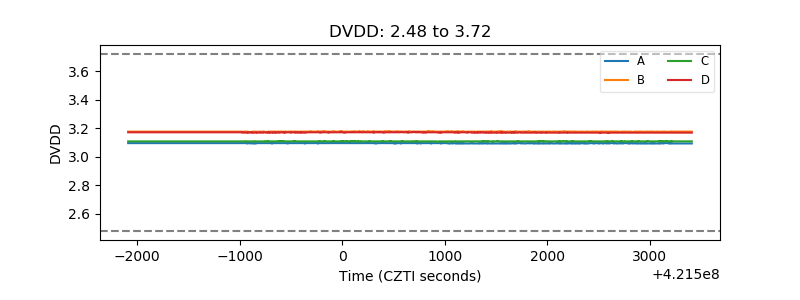 |
| Temperature 1 | 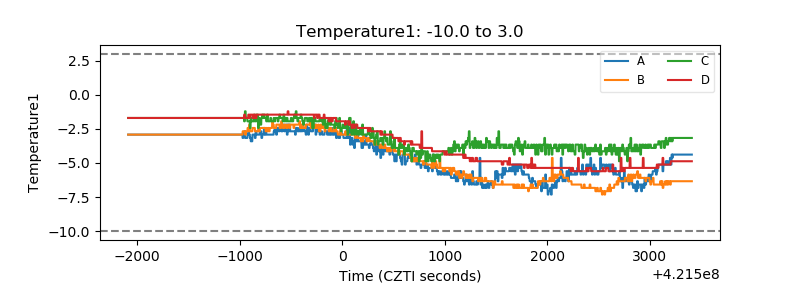 |
| Veto HV Monitor | 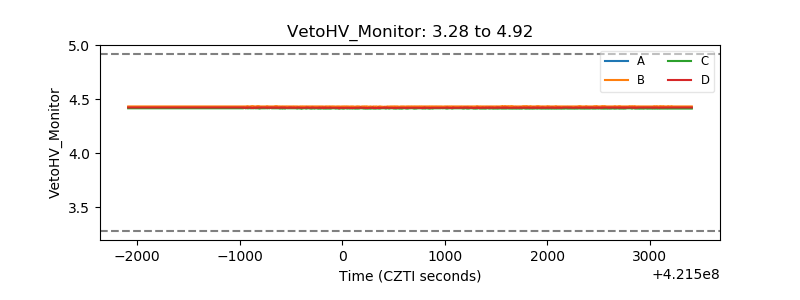 |
| Veto LLD | 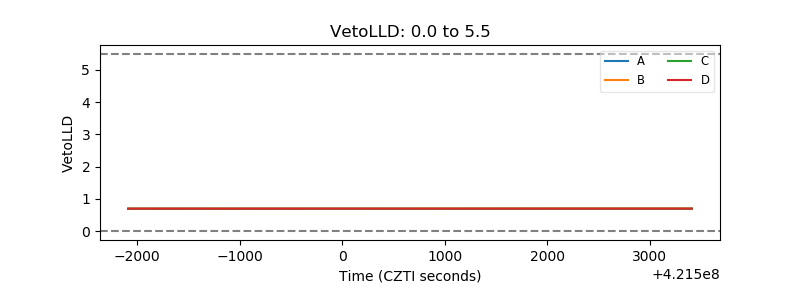 |
| Alpha Counter | 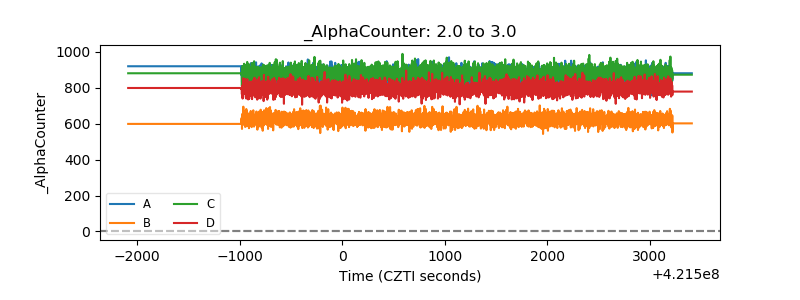 |
| _CPM_Rate | 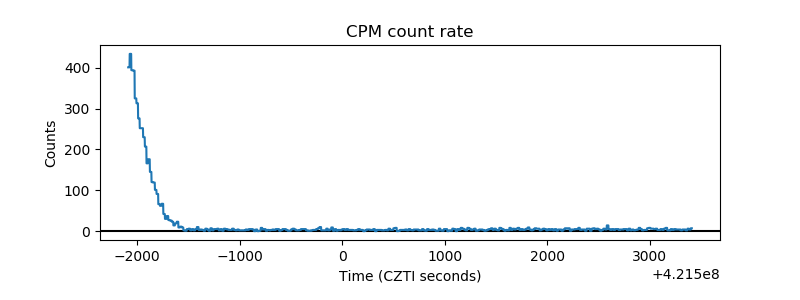 |
| CZT Counter | 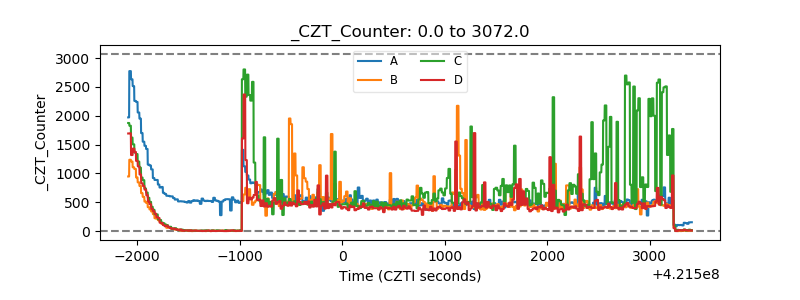 |
| +2.5 Volts monitor | 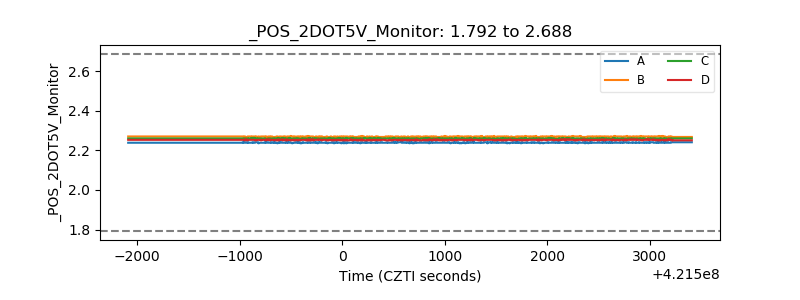 |
| +5 Volts monitor | 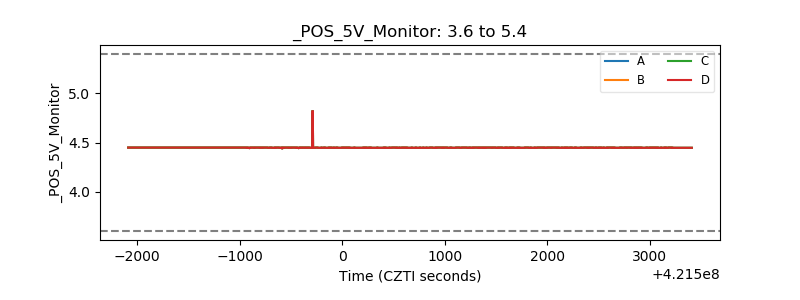 |
| _ROLL_ROT | 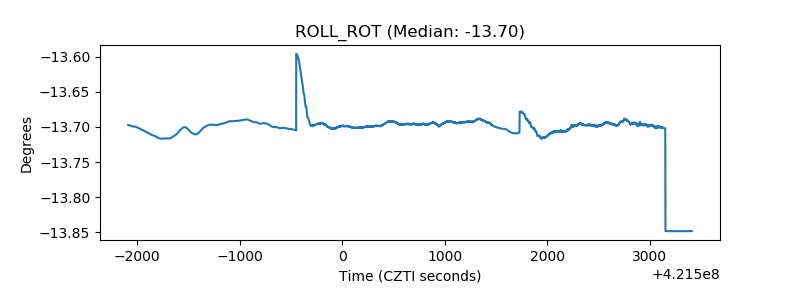 |
| _Roll_DEC | 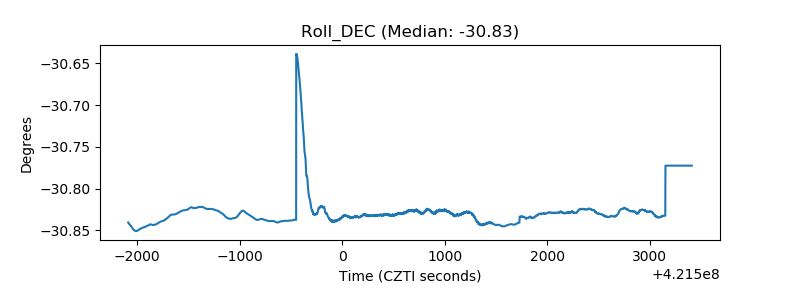 |
| _Roll_RA | 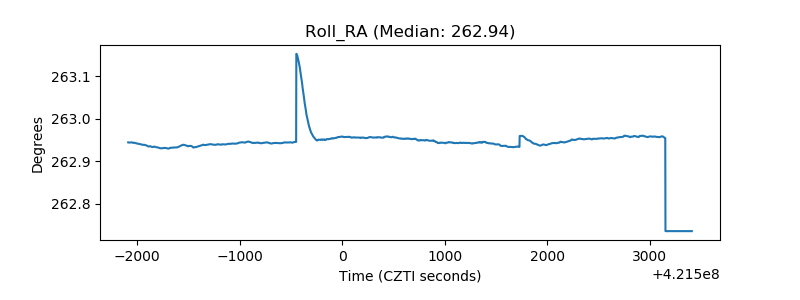 |
| Veto Counter | 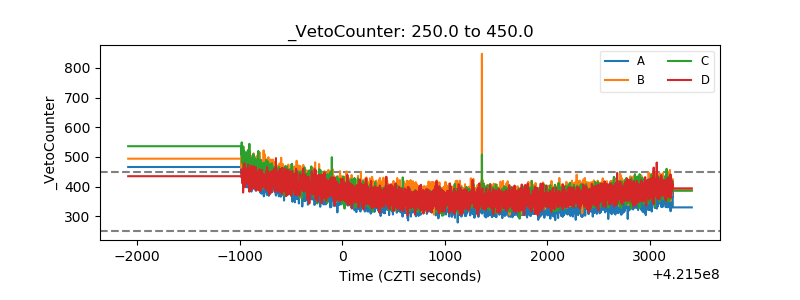 |