| Param | Original file | Final file |
|---|---|---|
| Filename | modeM0/AS1A12_089T14_9000005620_41193cztM0_level2.fits | modeM0/AS1A12_089T14_9000005620_41193cztM0_level2_quad_clean.evt |
| Size (bytes) | 350,455,680 | 101,505,600 |
| Size | 334.2 MB | 96.8 MB |
| Events in quadrant A | 3,133,974 | 674,859 |
| Events in quadrant B | 2,958,499 | 694,314 |
| Events in quadrant C | 3,212,549 | 663,720 |
| Events in quadrant D | 3,177,547 | 601,094 |
| Mode SS | |||
|---|---|---|---|
| Quadrant | BADHDUFLAG | Total packets | Discarded packets |
| A | 0 | 130 | 0 |
| B | 0 | 130 | 0 |
| C | 0 | 130 | 0 |
| D | 0 | 130 | 0 |
| Mode M9 | |||
|---|---|---|---|
| Quadrant | BADHDUFLAG | Total packets | Discarded packets |
| A | 0 | 13 | 0 |
| B | 0 | 13 | 0 |
| C | 0 | 13 | 0 |
| D | 0 | 13 | 0 |
| Mode M0 | |||
|---|---|---|---|
| Quadrant | BADHDUFLAG | Total packets | Discarded packets |
| A | 0 | 13280 | 1 |
| B | 0 | 13435 | 1 |
| C | 0 | 13553 | 1 |
| D | 0 | 14296 | 1 |
| Quadrant | Total seconds | Saturated seconds | Saturation percentage |
|---|---|---|---|
| A | 6291 | 7 | 0.111270% |
| B | 6291 | 53 | 0.842473% |
| C | 6291 | 67 | 1.065014% |
| D | 6291 | 170 | 2.702273% |
Noise dominated data is calculated using 1-second bins in cleaned event files. If a bin has >2000 counts, and if more than 50% of those come from <1% of pixels, then it is considered to be noise-dominated and hence unusable.
| Quadrant | # 1 sec bins | Bins with >0 counts | Bins with >2000 counts | High rate bins dominated by noise | Noise dominated (total time) | Noise dominated (detector-on time) | Marked lightcurve |
|---|---|---|---|---|---|---|---|
| A | 7665 | 6292 | 1 | 1 | 0.01% | 0.02% | 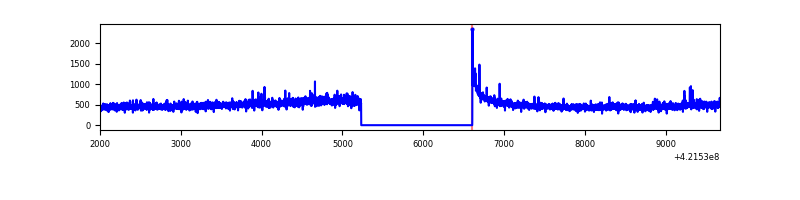 |
| B | 7665 | 6292 | 37 | 37 | 0.48% | 0.59% | 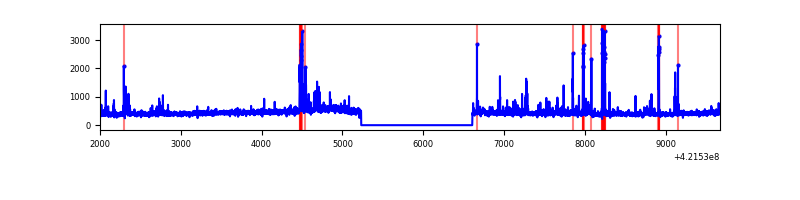 |
| C | 7665 | 6292 | 58 | 58 | 0.76% | 0.92% | 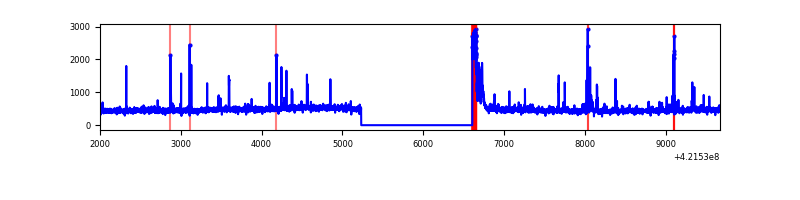 |
| D | 7665 | 6292 | 121 | 121 | 1.58% | 1.92% | 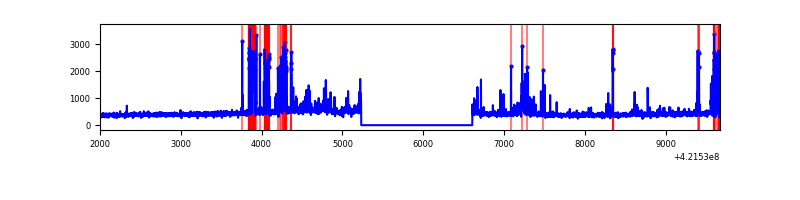 |
Top three noisy pixels from each quadrant. If the there are fewer than three noisy pixels in the level2.evt file, extra rows are filled as -1
| Pixel properties | Quadrant properties | ||||||
|---|---|---|---|---|---|---|---|
| Quadrant | DetID | PixID | Counts | Sigma | Mean | Median | Sigma |
| A | 10 | 83 | 455847 | 3315.34 | 671 | 657 | 137.3 |
| A | 12 | 189 | 43086 | 309.03 | 671 | 657 | 137.3 |
| A | 2 | 79 | 22807 | 161.33 | 671 | 657 | 137.3 |
| B | 5 | 255 | 261920 | 1989.21 | 662 | 644 | 131.3 |
| B | 0 | 229 | 37900 | 283.65 | 662 | 644 | 131.3 |
| B | 0 | 186 | 21537 | 159.07 | 662 | 644 | 131.3 |
| C | 15 | 214 | 263895 | 1697.65 | 658 | 663 | 155.1 |
| C | 0 | 10 | 231151 | 1486.48 | 658 | 663 | 155.1 |
| C | 9 | 54 | 113173 | 725.61 | 658 | 663 | 155.1 |
| D | 13 | 249 | 433055 | 2714.6 | 651 | 630 | 159.3 |
| D | 12 | 16 | 163306 | 1021.22 | 651 | 630 | 159.3 |
| D | 2 | 249 | 48493 | 300.47 | 651 | 630 | 159.3 |
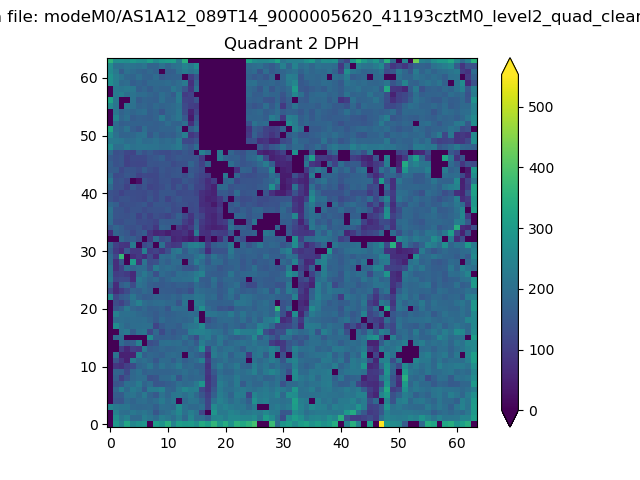
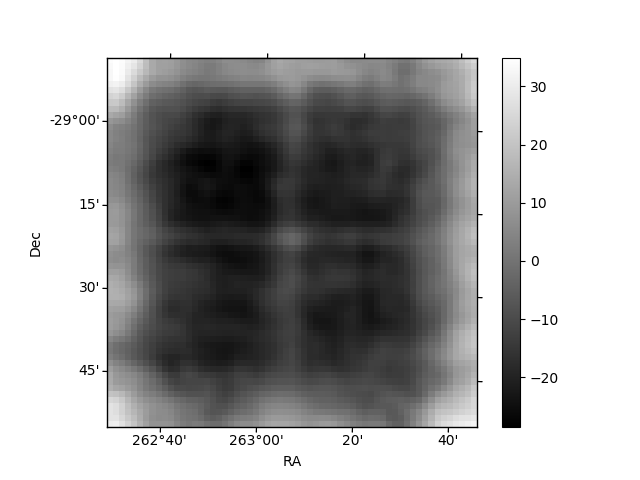
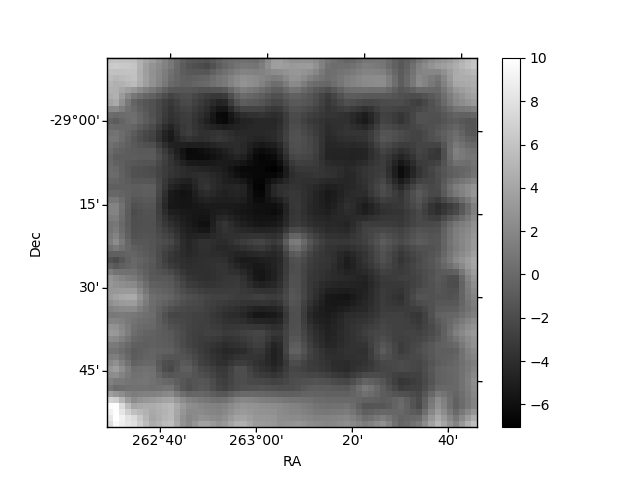
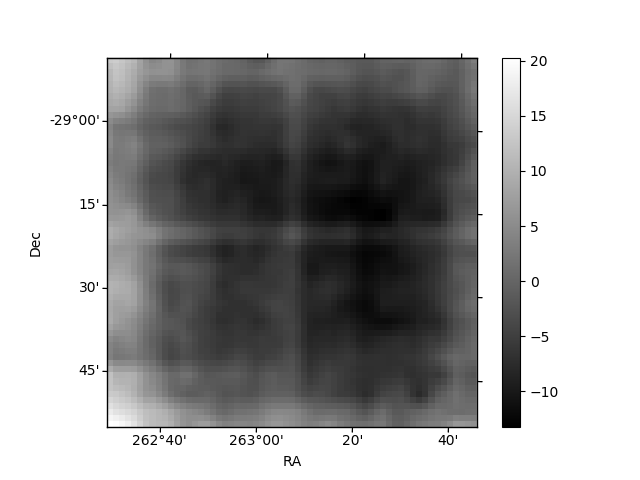
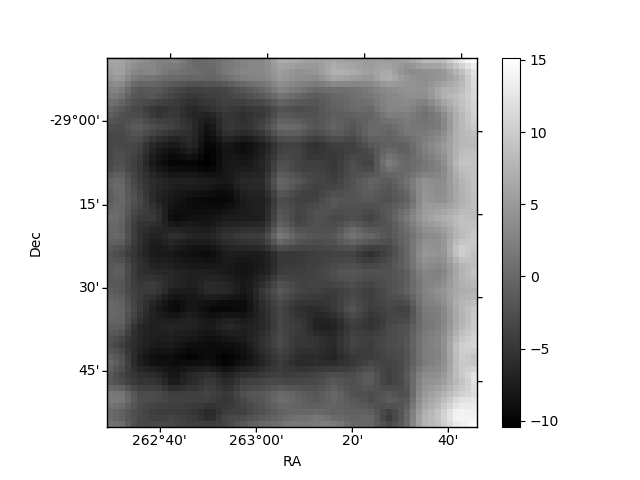
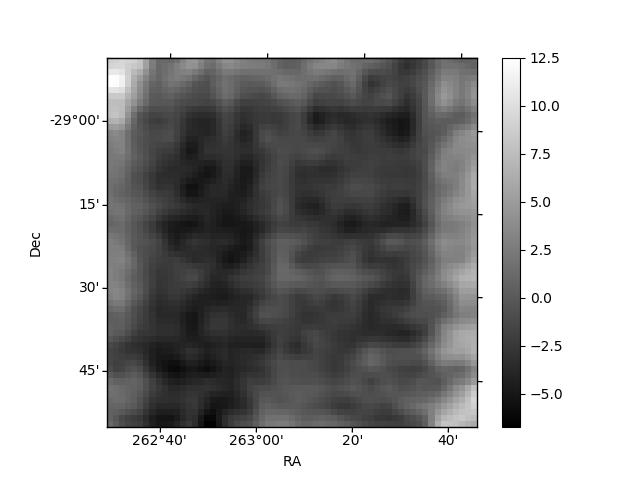
Histogram calculated using DETX and DETY for each event in the final _common_clean file
| Quadrant A | 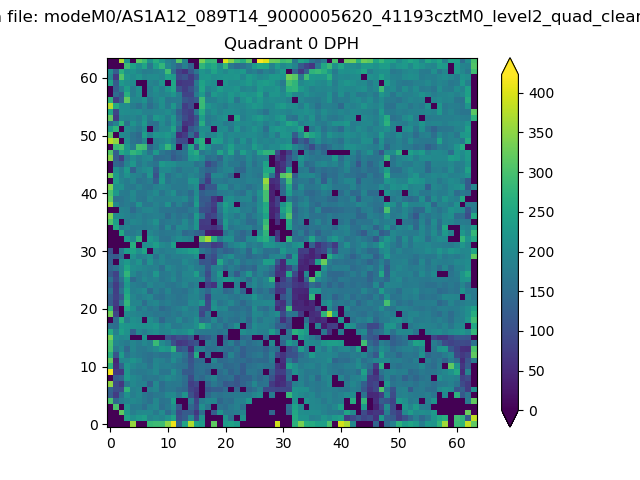 |
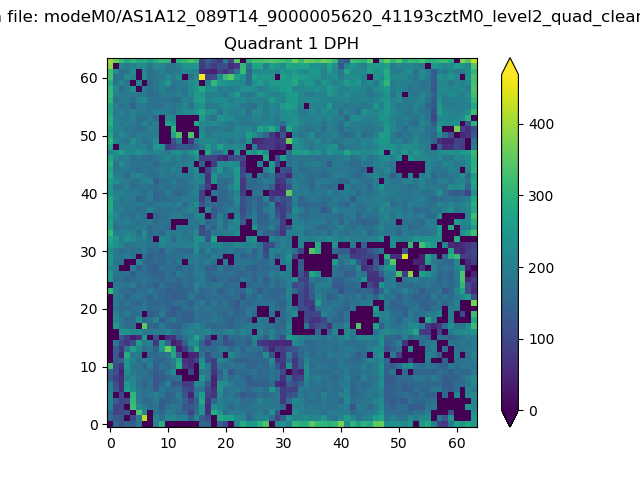 |
Quadrant B |
|---|---|---|---|
| Quadrant D | 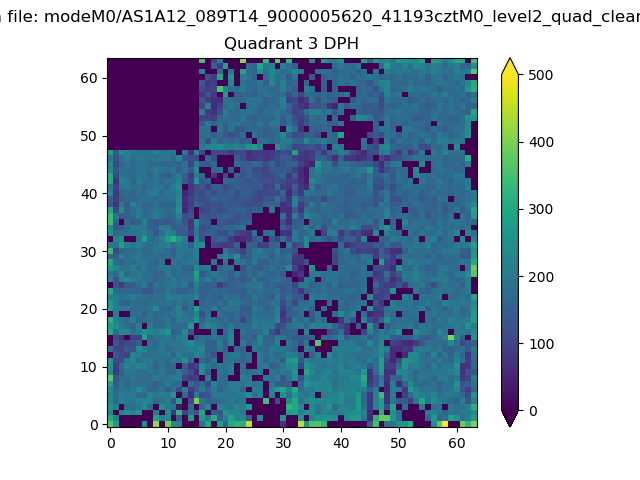 |
 |
Quadrant C |
| Plot type | Count rate plots | Images |
|---|---|---|
| Comparison with Poisson distribution Blue bars denote a histogram of data divided into 1 sec bins. Red curve is a Poisson curve with rate = median count rate of data. |
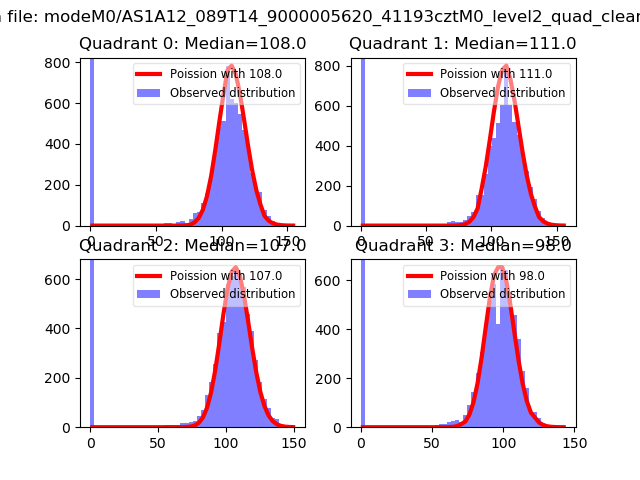 |
 |
| Quadrant-wise count rates Data is divided into 100 sec bins |
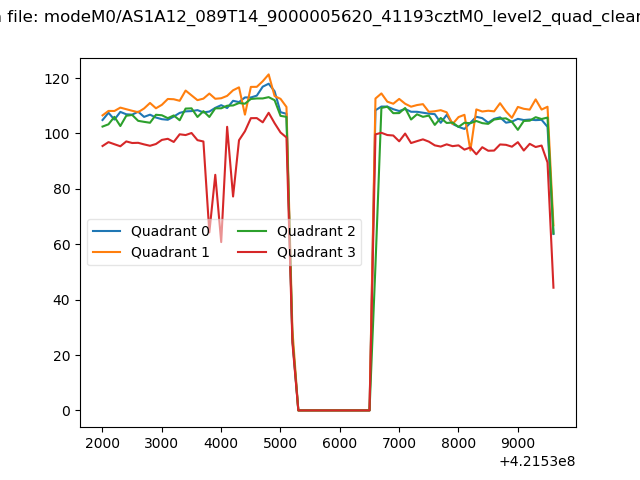 |
|
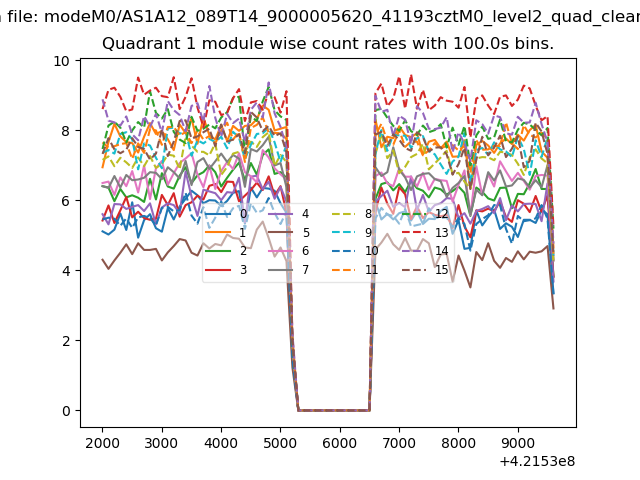
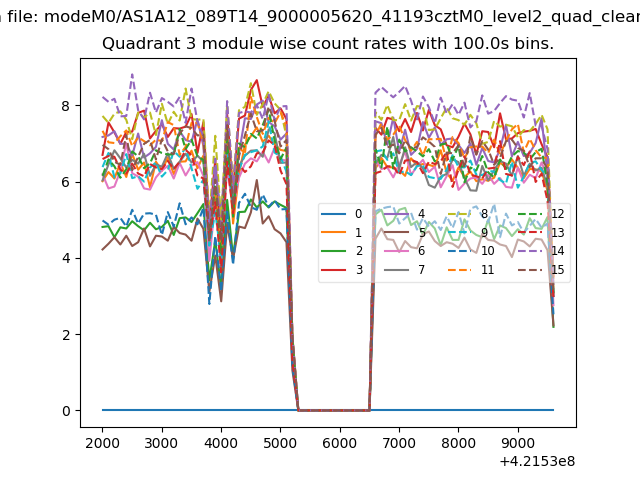
| Module-wise count rates for Quadrant A Data is divided into 100 sec bins |
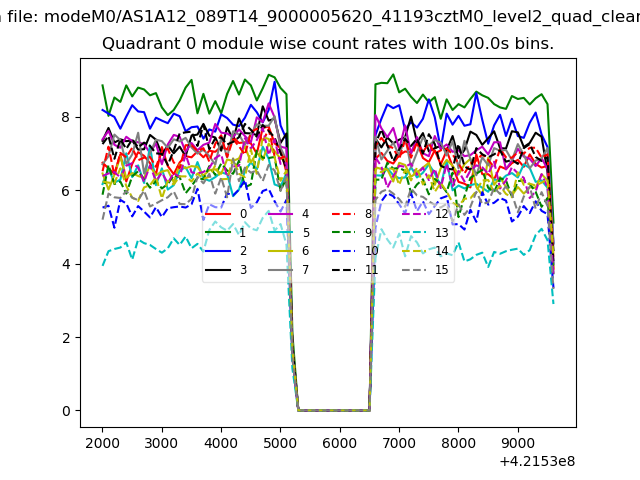 |
 |
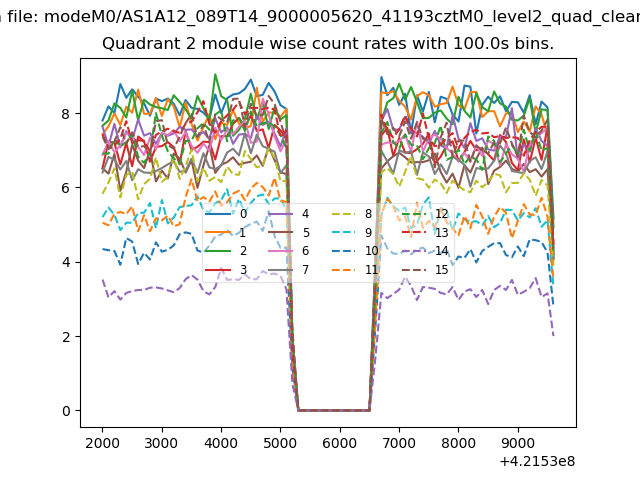
| Module-wise count rates for Quadrant B Data is divided into 100 sec bins |
 |
 |
| Module-wise count rates for Quadrant C Data is divided into 100 sec bins |
 |
 |
| Module-wise count rates for Quadrant D Data is divided into 100 sec bins |
 |
 |
| Parameter | Plot |
|---|---|
| CZT HV Monitor | 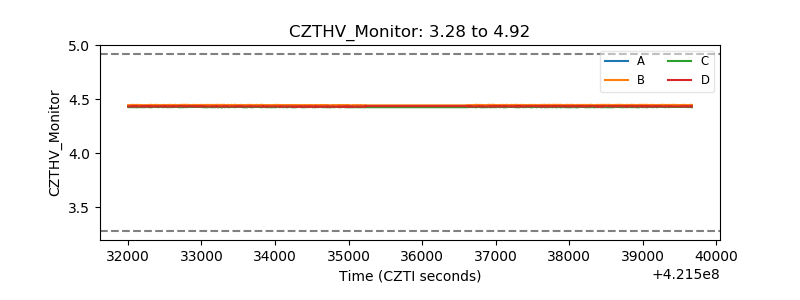 |
| D_VDD | 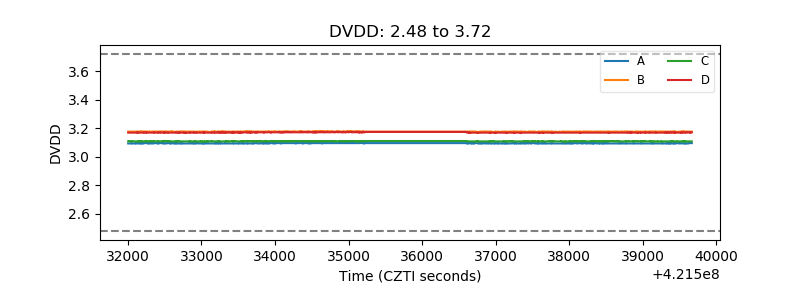 |
| Temperature 1 | 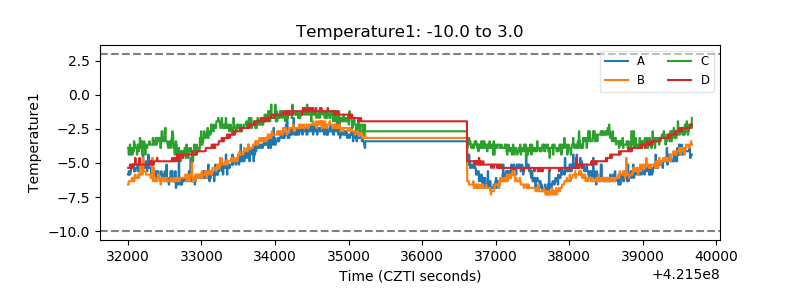 |
| Veto HV Monitor | 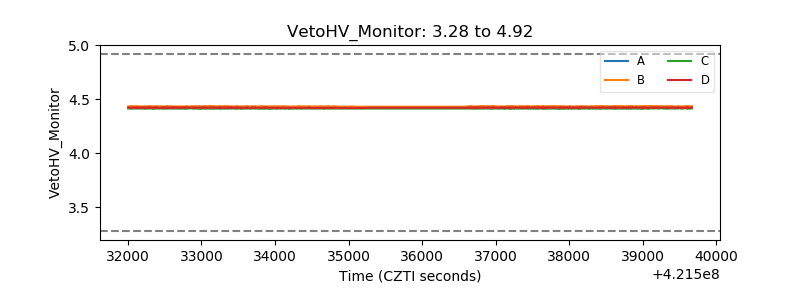 |
| Veto LLD | 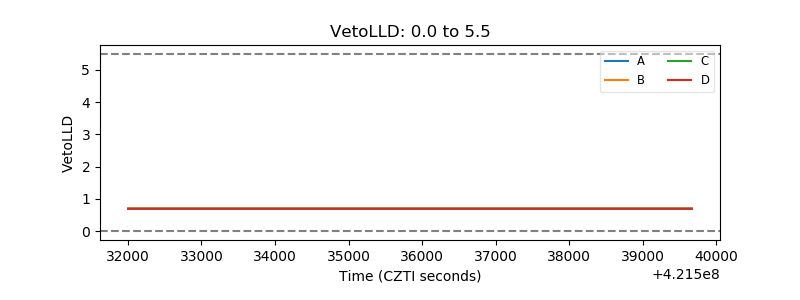 |
| Alpha Counter | 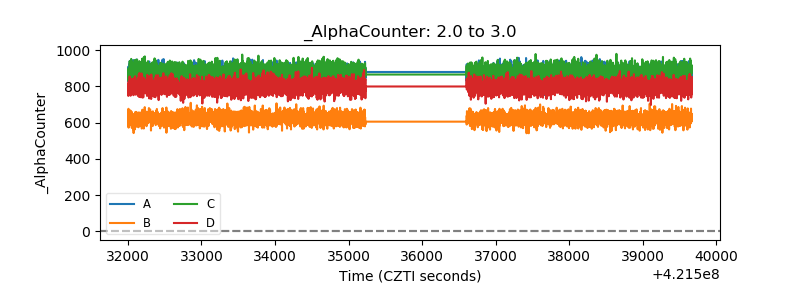 |
| _CPM_Rate | 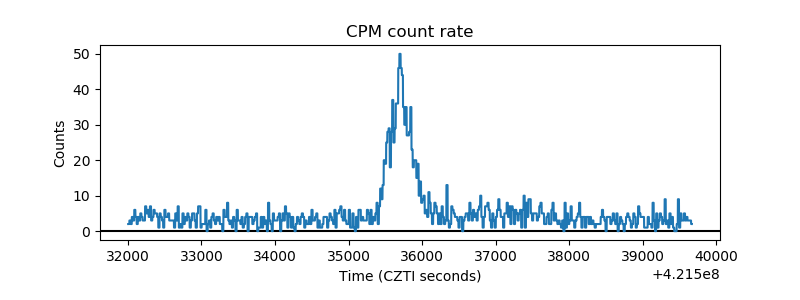 |
| CZT Counter |  |
| +2.5 Volts monitor | 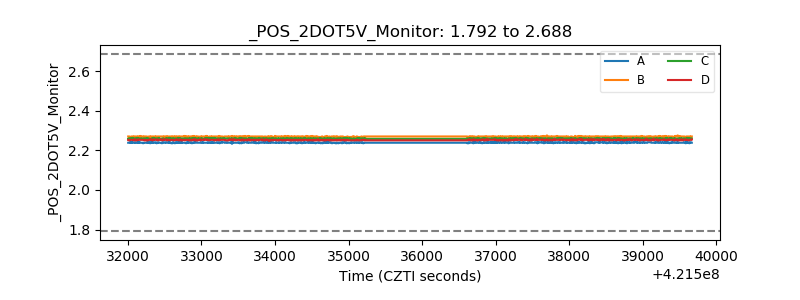 |
| +5 Volts monitor | 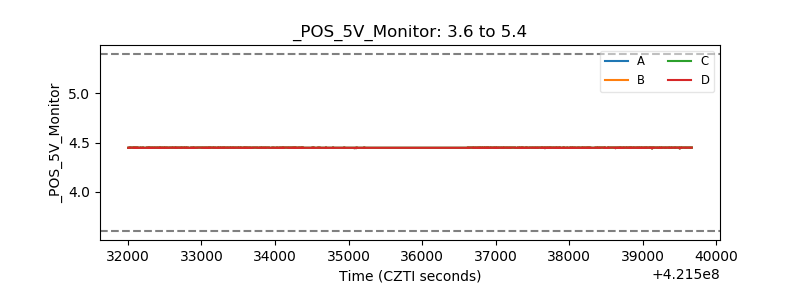 |
| _ROLL_ROT | 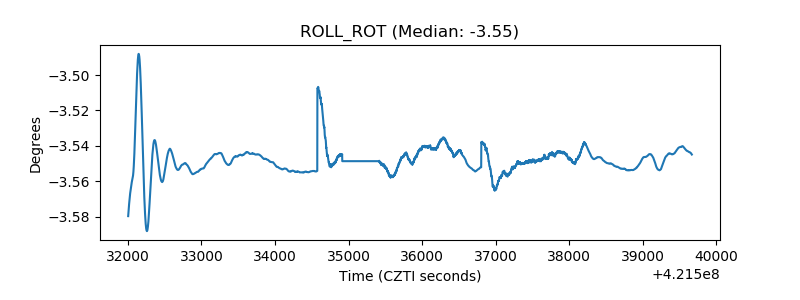 |
| _Roll_DEC | 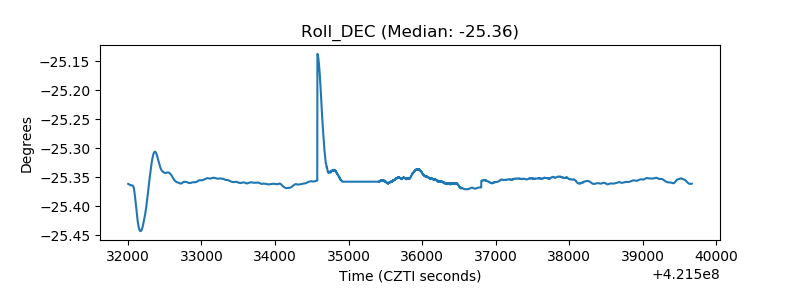 |
| _Roll_RA | 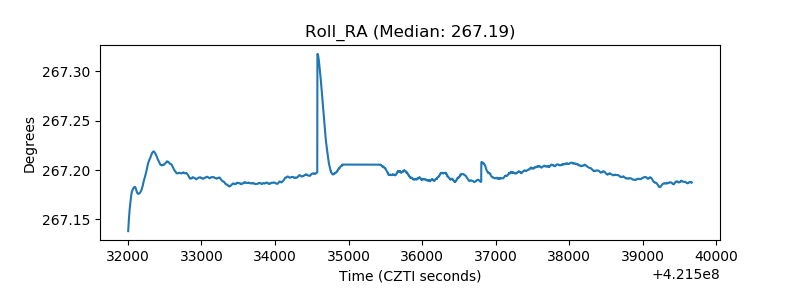 |
| Veto Counter | 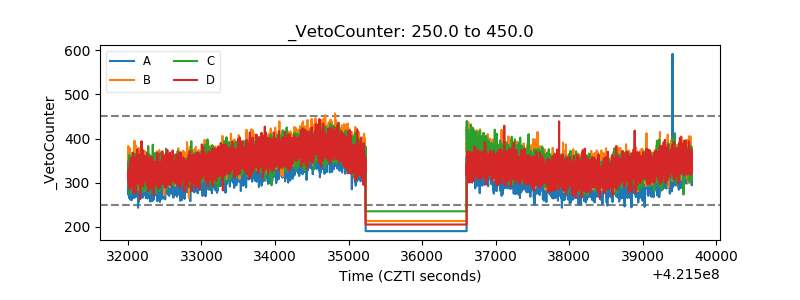 |