| Param | Original file | Final file |
|---|---|---|
| Filename | modeM0/AS1A12_089T15_9000005616_41187cztM0_level2.fits | modeM0/AS1A12_089T15_9000005616_41187cztM0_level2_quad_clean.evt |
| Size (bytes) | 86,955,840 | 16,790,400 |
| Size | 82.9 MB | 16.0 MB |
| Events in quadrant A | 643,970 | 115,295 |
| Events in quadrant B | 944,043 | 109,139 |
| Events in quadrant C | 933,671 | 100,068 |
| Events in quadrant D | 612,994 | 103,977 |
| Mode SS | |||
|---|---|---|---|
| Quadrant | BADHDUFLAG | Total packets | Discarded packets |
| A | 0 | 22 | 0 |
| B | 0 | 22 | 0 |
| C | 0 | 22 | 0 |
| D | 0 | 22 | 0 |
| Mode M0 | |||
|---|---|---|---|
| Quadrant | BADHDUFLAG | Total packets | Discarded packets |
| A | 0 | 2561 | 2 |
| B | 0 | 3524 | 1 |
| C | 0 | 3438 | 1 |
| D | 0 | 2536 | 1 |
| Mode M9 | |||
|---|---|---|---|
| Quadrant | BADHDUFLAG | Total packets | Discarded packets |
| A | 0 | 14 | 0 |
| B | 0 | 14 | 0 |
| C | 0 | 14 | 0 |
| D | 0 | 14 | 0 |
| Quadrant | Total seconds | Saturated seconds | Saturation percentage |
|---|---|---|---|
| A | 1043 | 5 | 0.479386% |
| B | 1043 | 96 | 9.204219% |
| C | 1043 | 145 | 13.902205% |
| D | 1043 | 32 | 3.068073% |
Noise dominated data is calculated using 1-second bins in cleaned event files. If a bin has >2000 counts, and if more than 50% of those come from <1% of pixels, then it is considered to be noise-dominated and hence unusable.
| Quadrant | # 1 sec bins | Bins with >0 counts | Bins with >2000 counts | High rate bins dominated by noise | Noise dominated (total time) | Noise dominated (detector-on time) | Marked lightcurve |
|---|---|---|---|---|---|---|---|
| A | 1043 | 1043 | 2 | 2 | 0.19% | 0.19% | 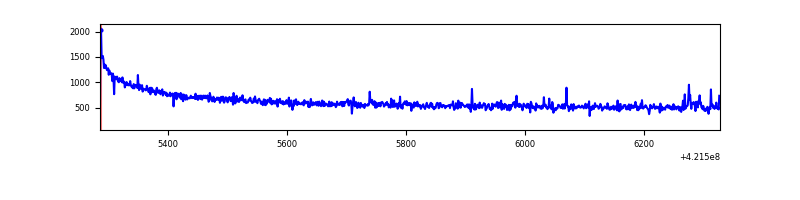 |
| B | 1043 | 1043 | 68 | 68 | 6.52% | 6.52% | 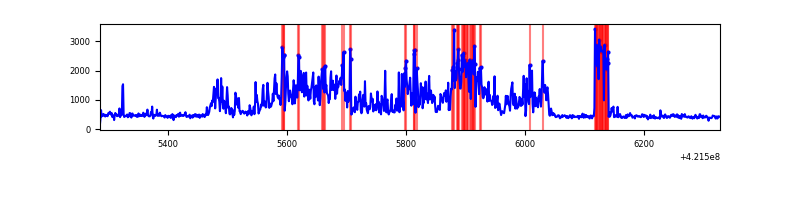 |
| C | 1043 | 1043 | 139 | 139 | 13.33% | 13.33% | 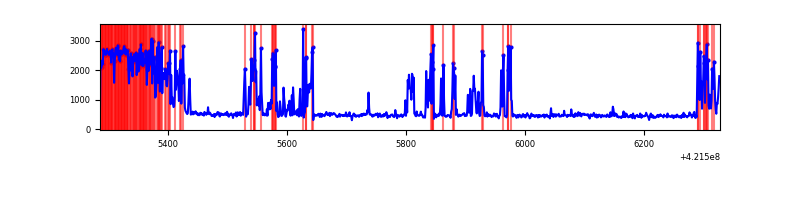 |
| D | 1043 | 1043 | 31 | 31 | 2.97% | 2.97% | 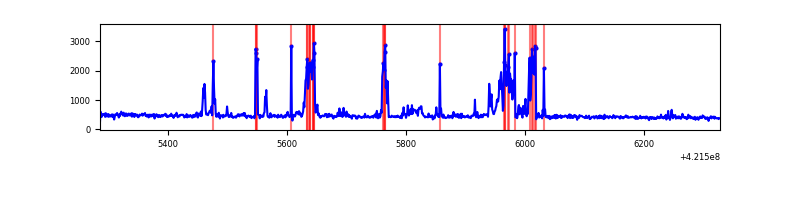 |
Top three noisy pixels from each quadrant. If the there are fewer than three noisy pixels in the level2.evt file, extra rows are filled as -1
| Pixel properties | Quadrant properties | ||||||
|---|---|---|---|---|---|---|---|
| Quadrant | DetID | PixID | Counts | Sigma | Mean | Median | Sigma |
| A | 10 | 83 | 168621 | 6302.05 | 119 | 116 | 26.7 |
| A | 2 | 79 | 9428 | 348.27 | 119 | 116 | 26.7 |
| A | 13 | 6 | 2610 | 93.27 | 119 | 116 | 26.7 |
| B | 0 | 186 | 434062 | 17965.03 | 113 | 110 | 24.2 |
| B | 0 | 229 | 61694 | 2549.5 | 113 | 110 | 24.2 |
| B | 12 | 111 | 2721 | 108.09 | 113 | 110 | 24.2 |
| C | 9 | 54 | 274748 | 10249.52 | 106 | 106 | 26.8 |
| C | 0 | 10 | 197497 | 7366.55 | 106 | 106 | 26.8 |
| C | 15 | 214 | 45382 | 1689.68 | 106 | 106 | 26.8 |
| D | 13 | 249 | 158748 | 5253.4 | 115 | 111 | 30.2 |
| D | 2 | 234 | 5420 | 175.81 | 115 | 111 | 30.2 |
| D | 7 | 39 | 3489 | 111.87 | 115 | 111 | 30.2 |
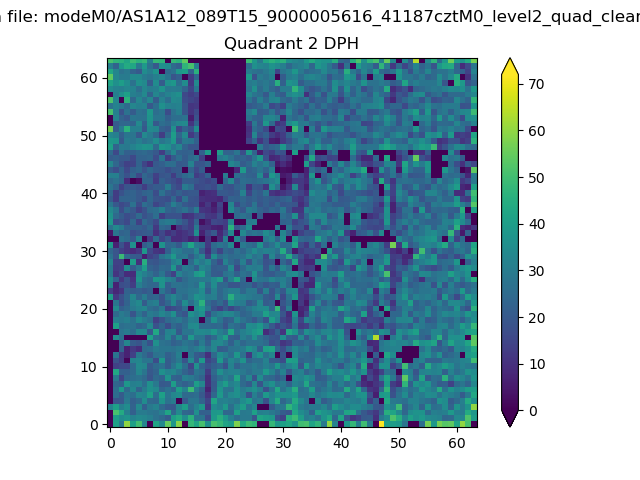
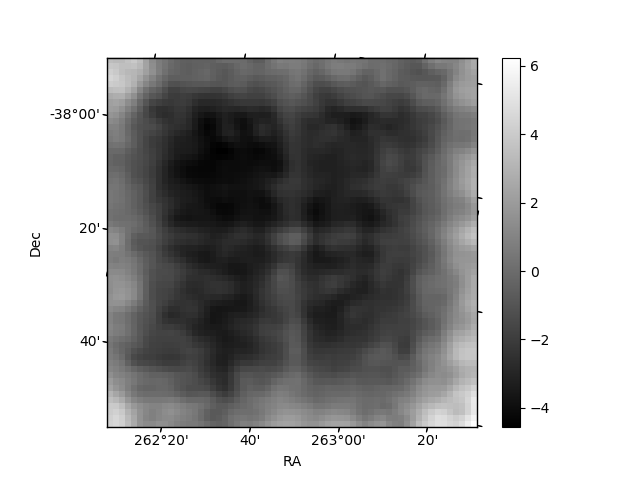
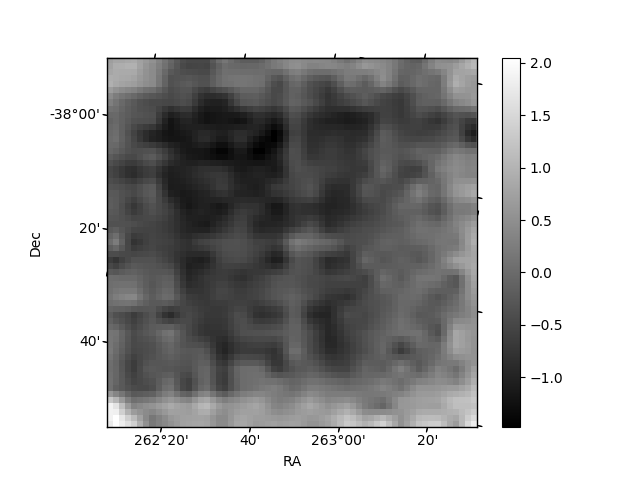
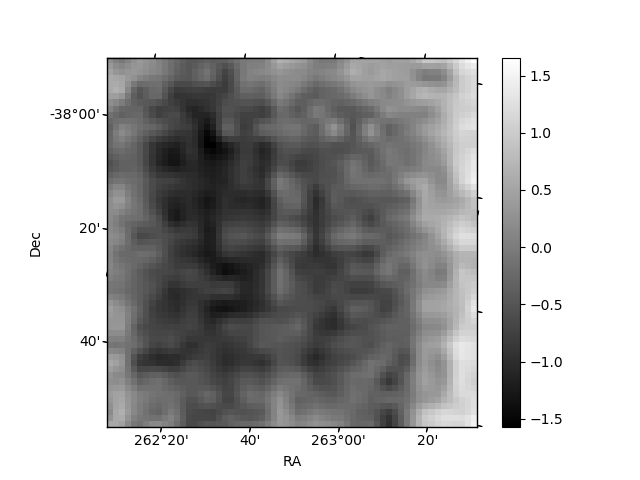
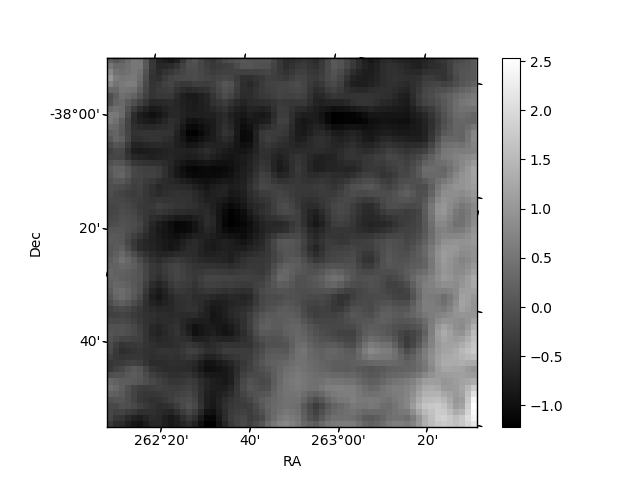
Histogram calculated using DETX and DETY for each event in the final _common_clean file
| Quadrant A | 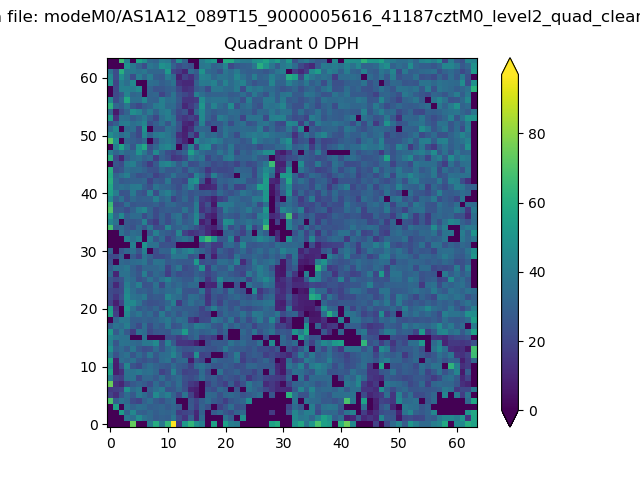 |
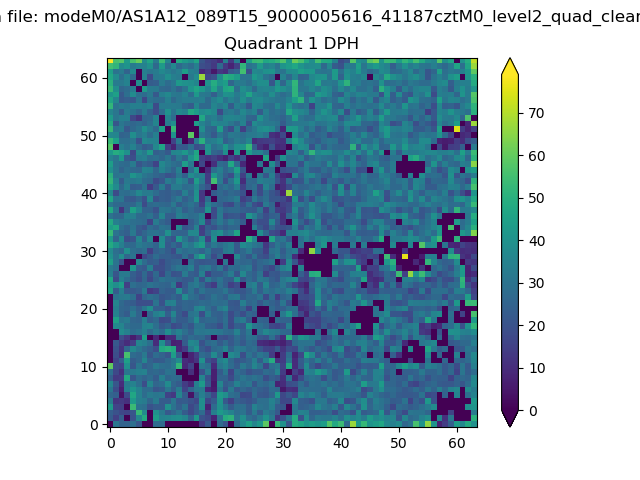 |
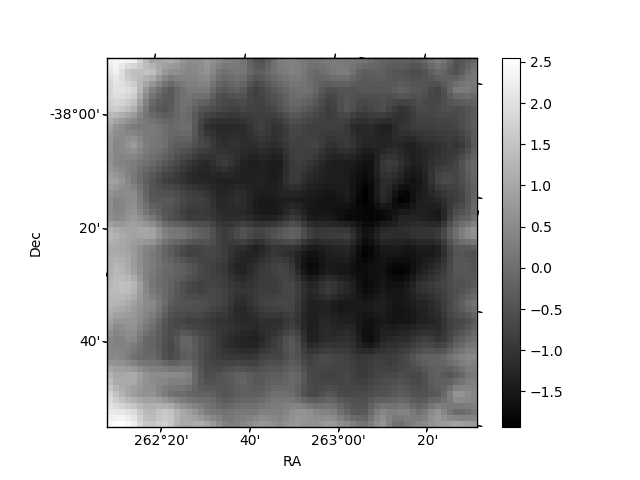
Quadrant B |
|---|---|---|---|
| Quadrant D | 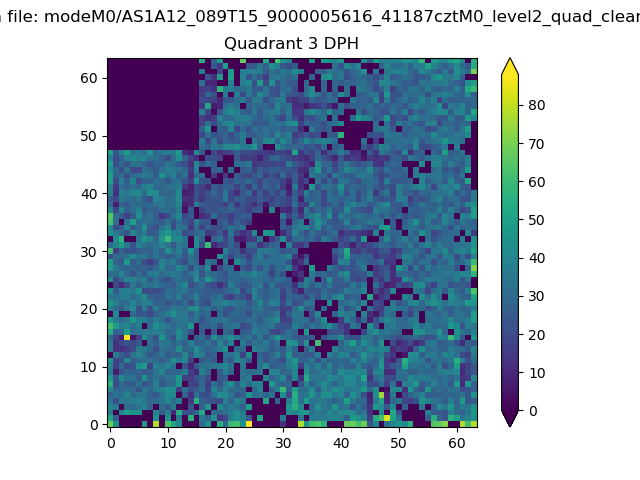 |
 |
Quadrant C |
| Plot type | Count rate plots | Images |
|---|---|---|
| Comparison with Poisson distribution Blue bars denote a histogram of data divided into 1 sec bins. Red curve is a Poisson curve with rate = median count rate of data. |
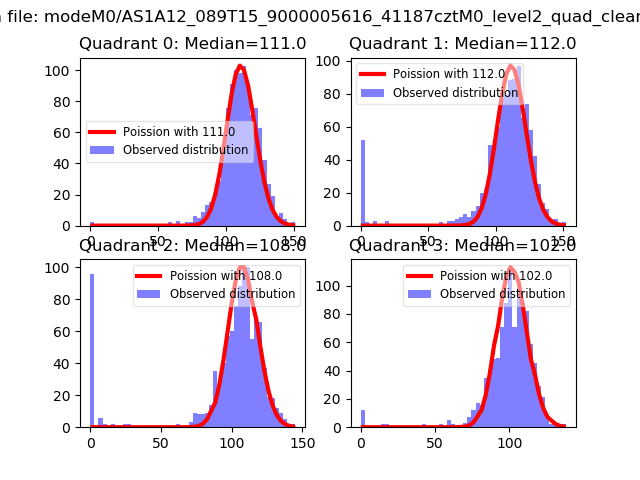 |
 |
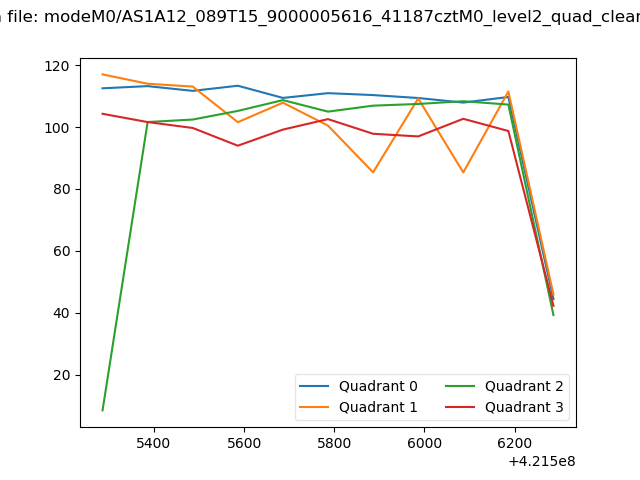
| Quadrant-wise count rates Data is divided into 100 sec bins |
 |
|
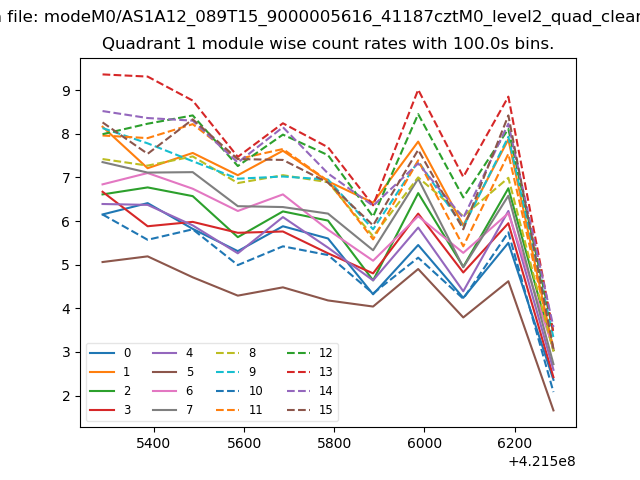
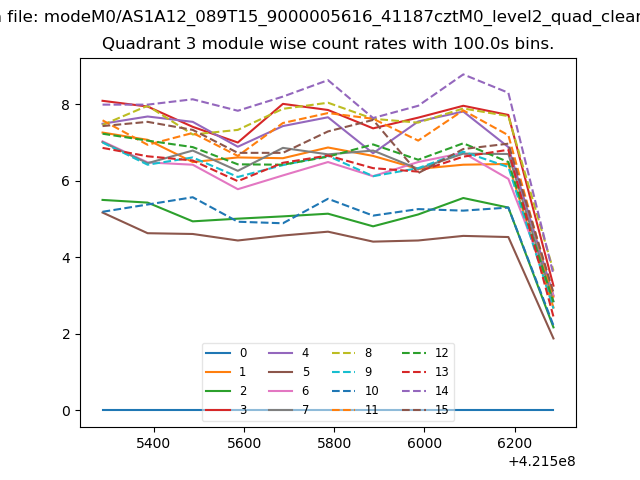
| Module-wise count rates for Quadrant A Data is divided into 100 sec bins |
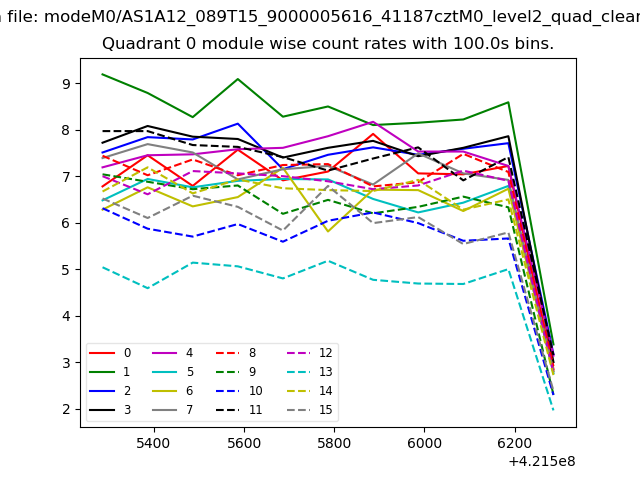 |
 |
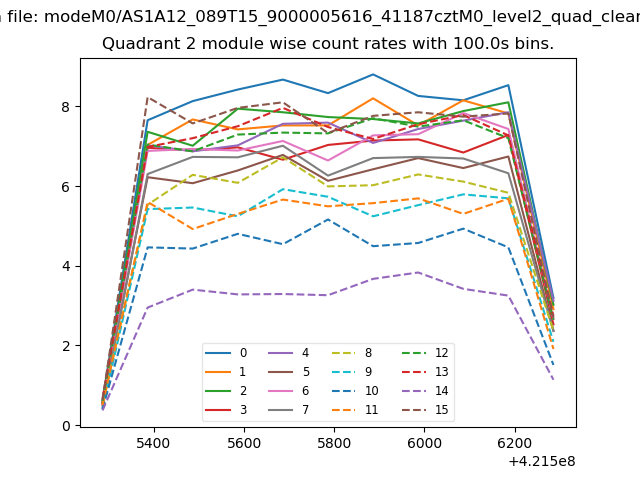
| Module-wise count rates for Quadrant B Data is divided into 100 sec bins |
 |
 |
| Module-wise count rates for Quadrant C Data is divided into 100 sec bins |
 |
 |
| Module-wise count rates for Quadrant D Data is divided into 100 sec bins |
 |
 |
| Parameter | Plot |
|---|---|
| CZT HV Monitor | 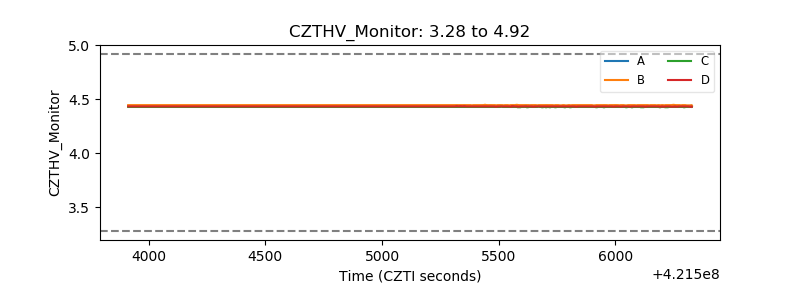 |
| D_VDD | 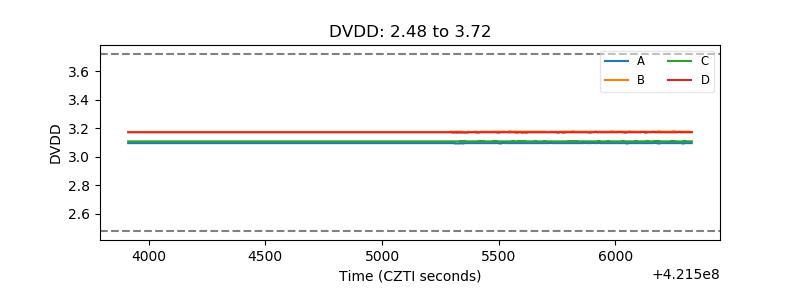 |
| Temperature 1 | 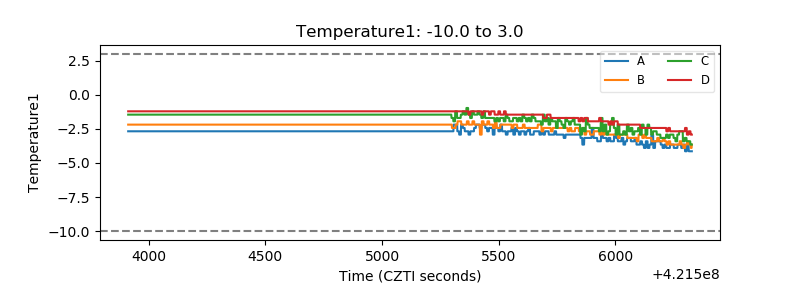 |
| Veto HV Monitor | 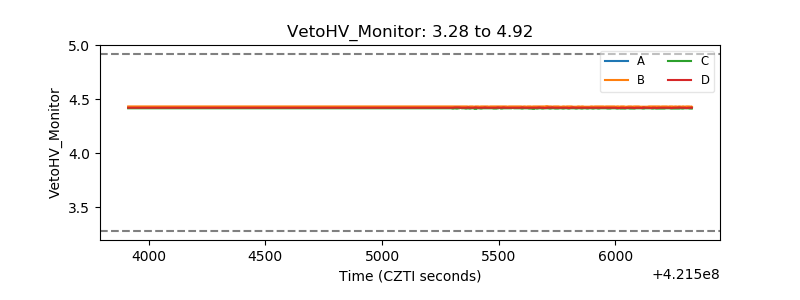 |
| Veto LLD | 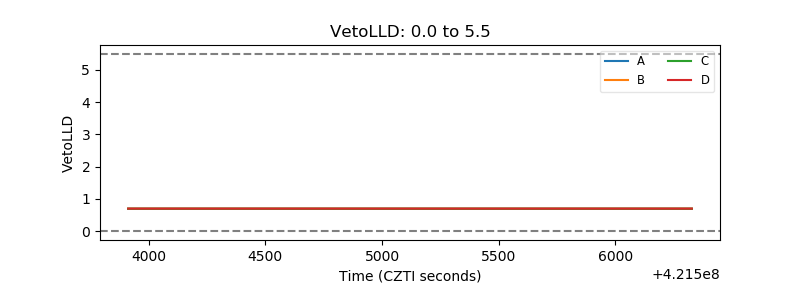 |
| Alpha Counter | 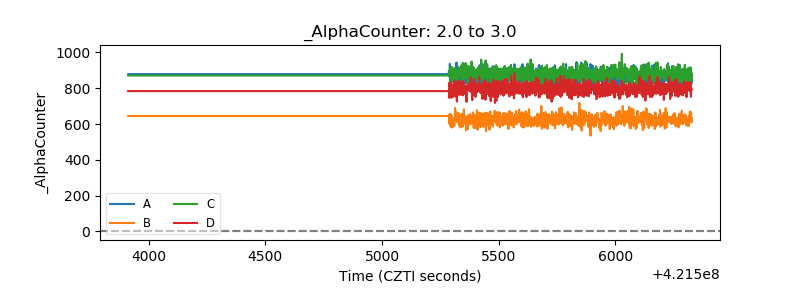 |
| _CPM_Rate | 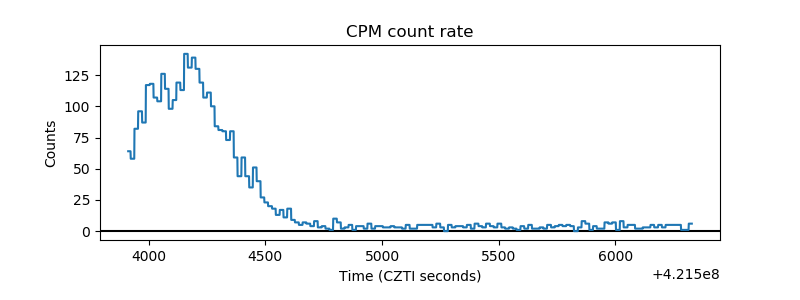 |
| CZT Counter | 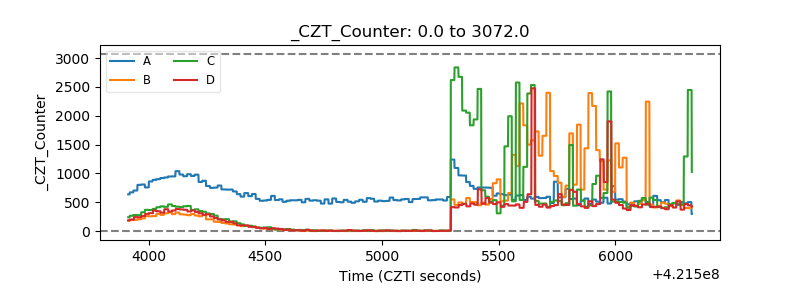 |
| +2.5 Volts monitor | 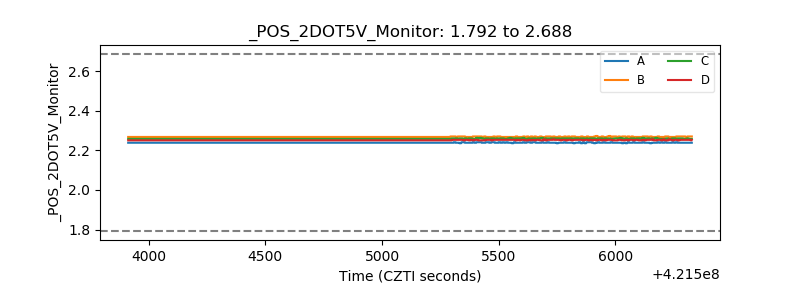 |
| +5 Volts monitor | 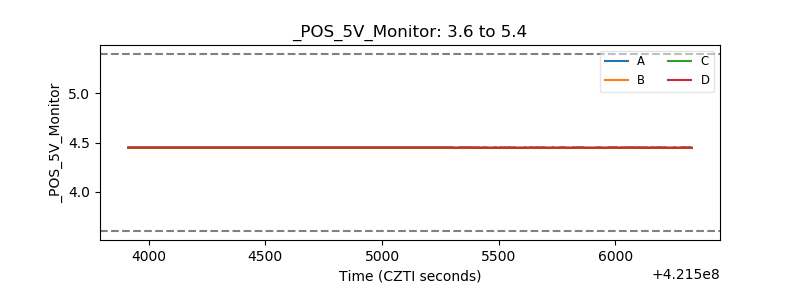 |
| _ROLL_ROT | 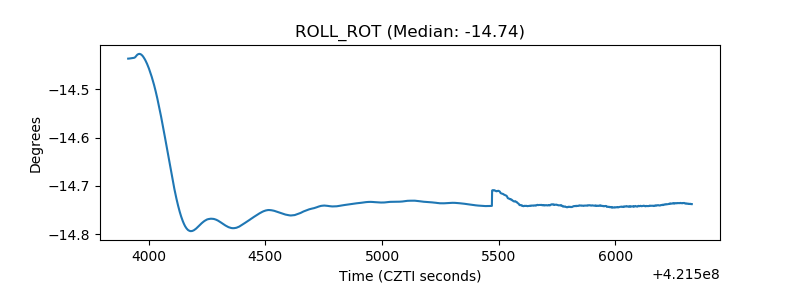 |
| _Roll_DEC | 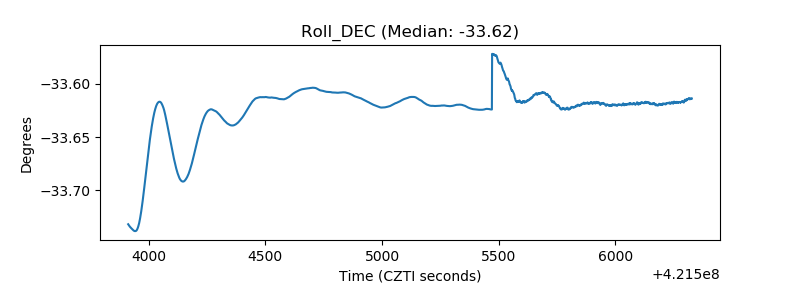 |
| _Roll_RA | 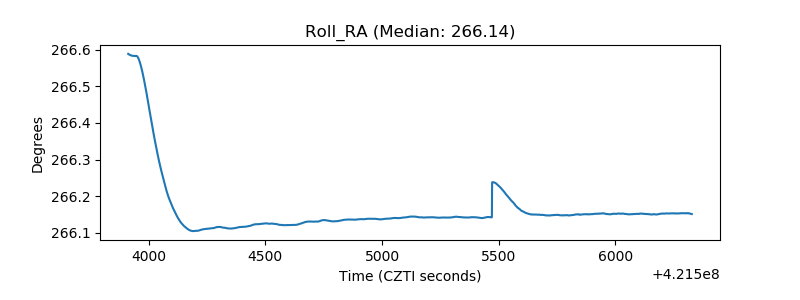 |
| Veto Counter | 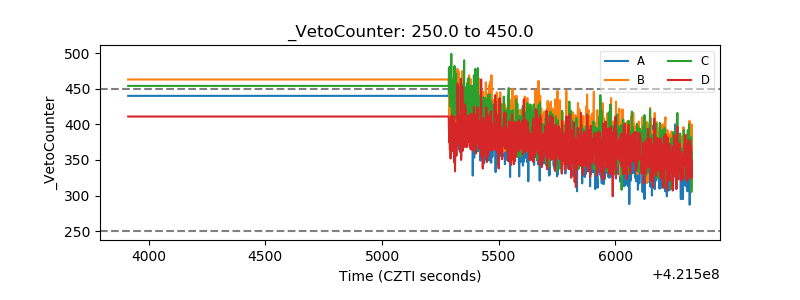 |