| Param | Original file | Final file |
|---|---|---|
| Filename | modeM0/AS1A12_101T02_9000005622_41193cztM0_level2.fits | modeM0/AS1A12_101T02_9000005622_41193cztM0_level2_quad_clean.evt |
| Size (bytes) | 94,536,000 | 24,062,400 |
| Size | 90.2 MB | 22.9 MB |
| Events in quadrant A | 835,893 | 162,826 |
| Events in quadrant B | 773,031 | 163,168 |
| Events in quadrant C | 962,037 | 149,382 |
| Events in quadrant D | 811,004 | 144,089 |
| Mode M9 | |||
|---|---|---|---|
| Quadrant | BADHDUFLAG | Total packets | Discarded packets |
| A | 0 | 15 | 0 |
| B | 0 | 15 | 0 |
| C | 0 | 15 | 0 |
| D | 0 | 15 | 0 |
| Mode M0 | |||
|---|---|---|---|
| Quadrant | BADHDUFLAG | Total packets | Discarded packets |
| A | 0 | 3423 | 2 |
| B | 0 | 3316 | 1 |
| C | 0 | 3797 | 1 |
| D | 0 | 3488 | 1 |
| Mode SS | |||
|---|---|---|---|
| Quadrant | BADHDUFLAG | Total packets | Discarded packets |
| A | 0 | 32 | 0 |
| B | 0 | 32 | 0 |
| C | 0 | 32 | 0 |
| D | 0 | 32 | 0 |
| Quadrant | Total seconds | Saturated seconds | Saturation percentage |
|---|---|---|---|
| A | 1470 | 3 | 0.204082% |
| B | 1470 | 25 | 1.700680% |
| C | 1470 | 87 | 5.918367% |
| D | 1470 | 37 | 2.517007% |
Noise dominated data is calculated using 1-second bins in cleaned event files. If a bin has >2000 counts, and if more than 50% of those come from <1% of pixels, then it is considered to be noise-dominated and hence unusable.
| Quadrant | # 1 sec bins | Bins with >0 counts | Bins with >2000 counts | High rate bins dominated by noise | Noise dominated (total time) | Noise dominated (detector-on time) | Marked lightcurve |
|---|---|---|---|---|---|---|---|
| A | 2963 | 1471 | 1 | 1 | 0.03% | 0.07% | 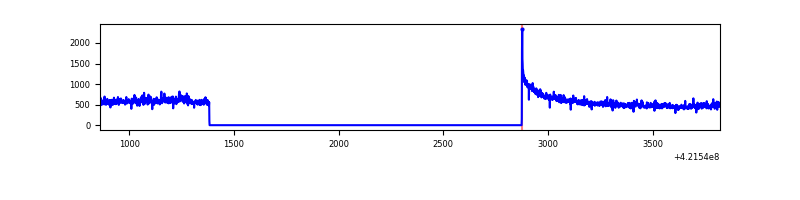 |
| B | 2963 | 1471 | 20 | 20 | 0.67% | 1.36% | 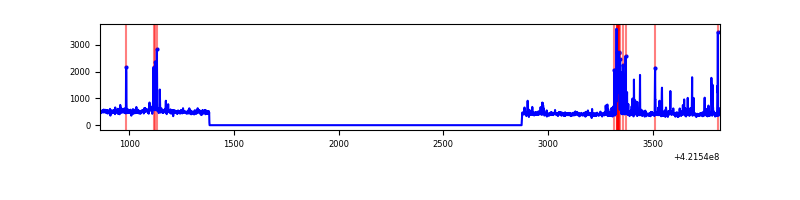 |
| C | 2963 | 1471 | 81 | 81 | 2.73% | 5.51% | 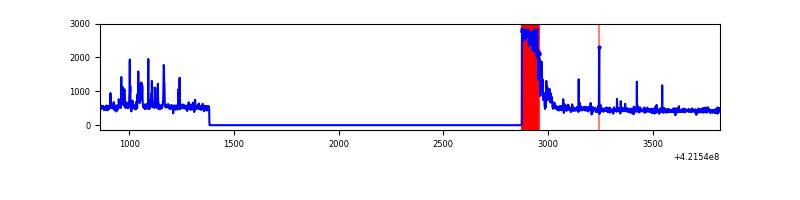 |
| D | 2963 | 1471 | 27 | 27 | 0.91% | 1.84% | 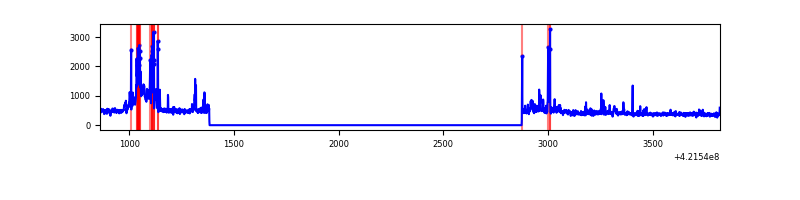 |
Top three noisy pixels from each quadrant. If the there are fewer than three noisy pixels in the level2.evt file, extra rows are filled as -1
| Pixel properties | Quadrant properties | ||||||
|---|---|---|---|---|---|---|---|
| Quadrant | DetID | PixID | Counts | Sigma | Mean | Median | Sigma |
| A | 10 | 83 | 186148 | 5348.92 | 160 | 157 | 34.8 |
| A | 12 | 189 | 16947 | 482.86 | 160 | 157 | 34.8 |
| A | 15 | 235 | 6333 | 177.62 | 160 | 157 | 34.8 |
| B | 5 | 255 | 101651 | 3030.41 | 160 | 156 | 33.5 |
| B | 0 | 229 | 29690 | 881.82 | 160 | 156 | 33.5 |
| B | 0 | 245 | 4808 | 138.9 | 160 | 156 | 33.5 |
| C | 0 | 10 | 234420 | 6137.37 | 155 | 156 | 38.2 |
| C | 15 | 214 | 65043 | 1699.94 | 155 | 156 | 38.2 |
| C | 9 | 54 | 49635 | 1296.28 | 155 | 156 | 38.2 |
| D | 13 | 249 | 115856 | 2849.39 | 157 | 152 | 40.6 |
| D | 12 | 16 | 52944 | 1300.08 | 157 | 152 | 40.6 |
| D | 2 | 249 | 13318 | 324.23 | 157 | 152 | 40.6 |
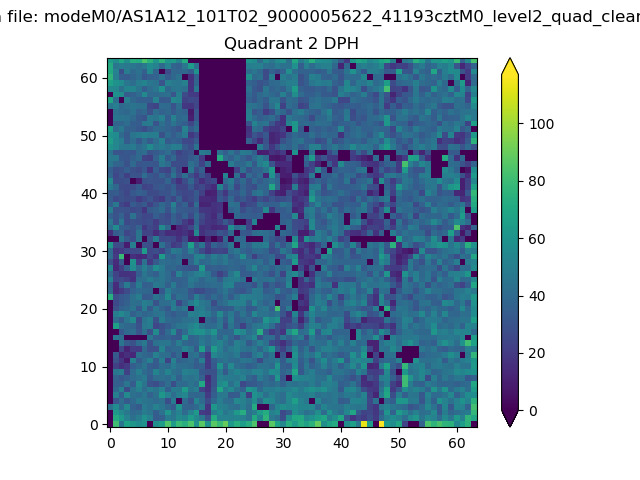
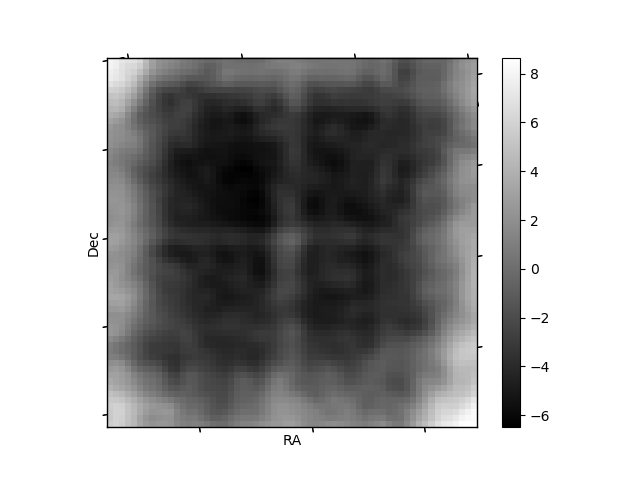
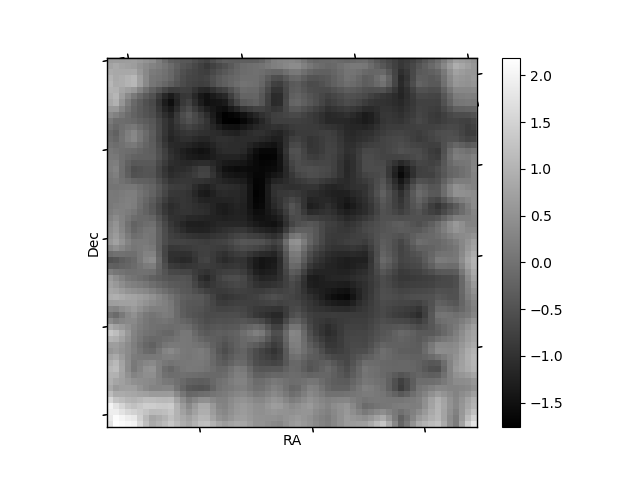
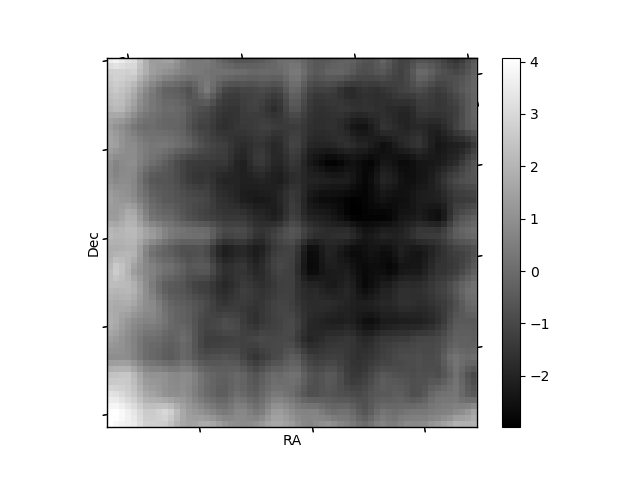
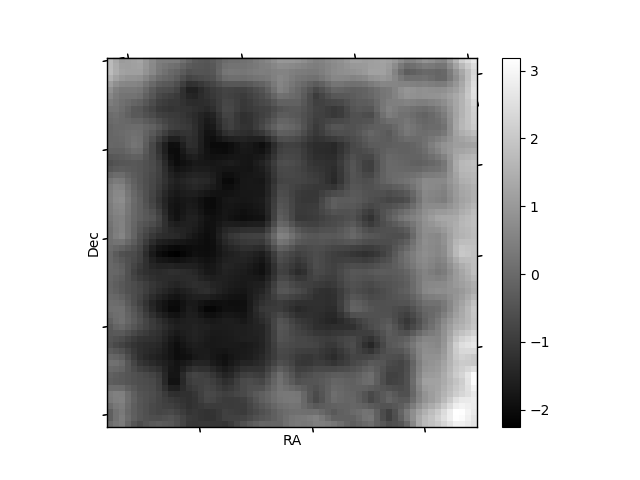
Histogram calculated using DETX and DETY for each event in the final _common_clean file
| Quadrant A | 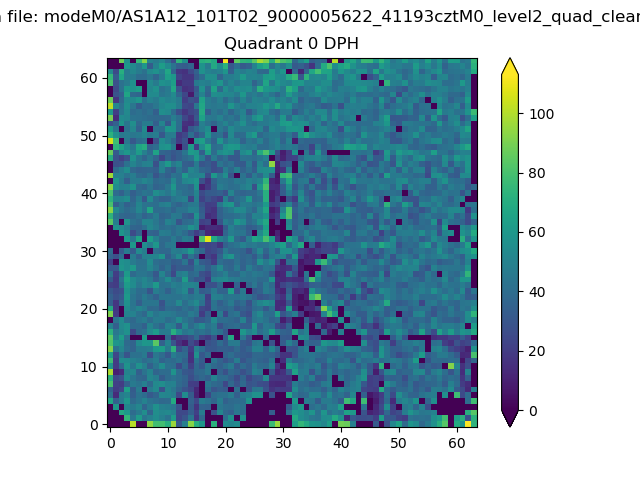 |
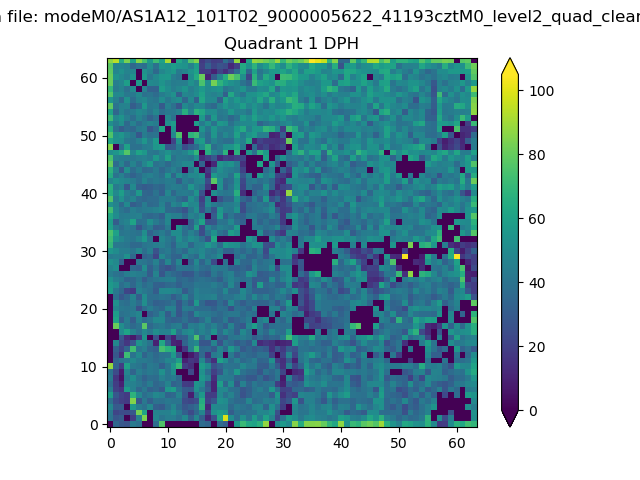 |
Quadrant B |
|---|---|---|---|
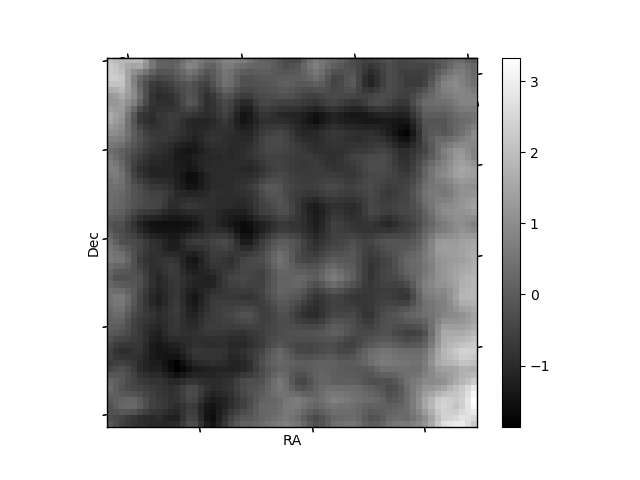
| Quadrant D | 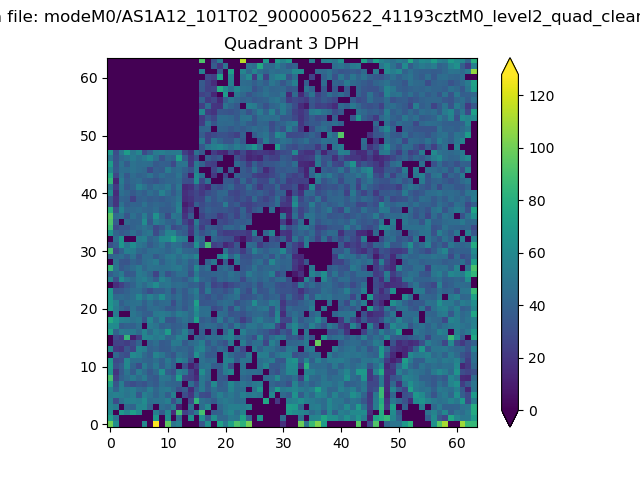 |
 |
Quadrant C |
| Plot type | Count rate plots | Images |
|---|---|---|
| Comparison with Poisson distribution Blue bars denote a histogram of data divided into 1 sec bins. Red curve is a Poisson curve with rate = median count rate of data. |
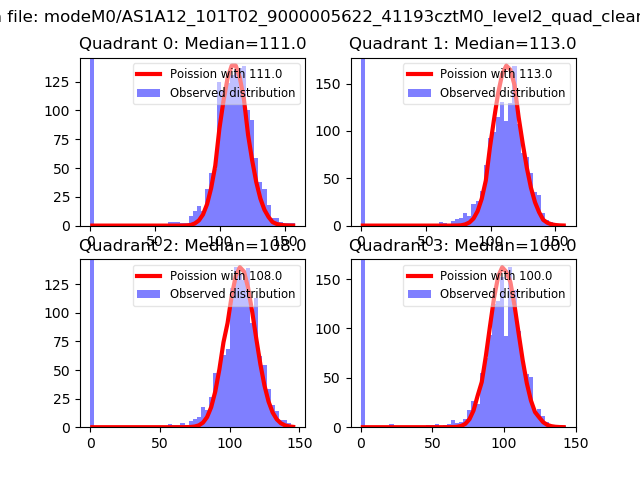 |
 |
| Quadrant-wise count rates Data is divided into 100 sec bins |
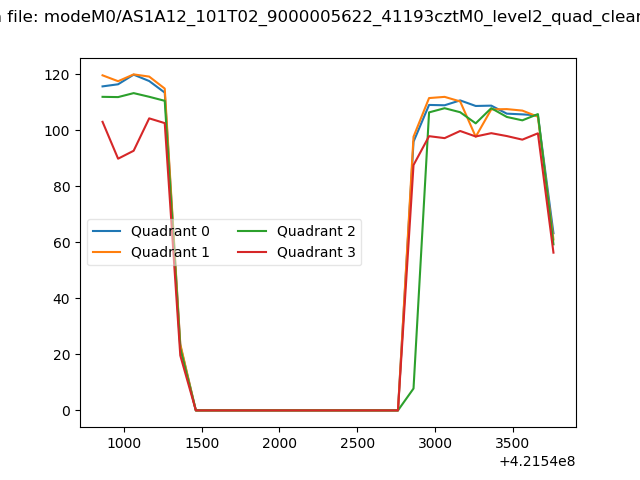 |
|
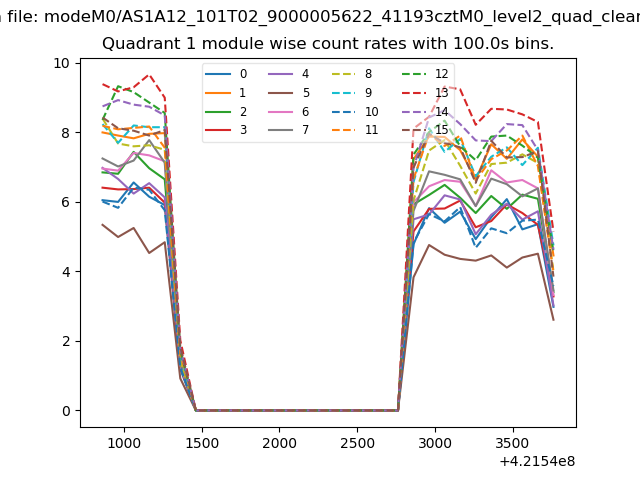
| Module-wise count rates for Quadrant A Data is divided into 100 sec bins |
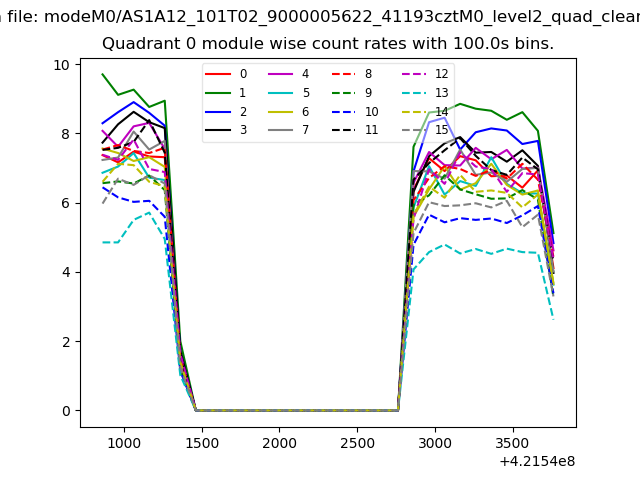 |
 |
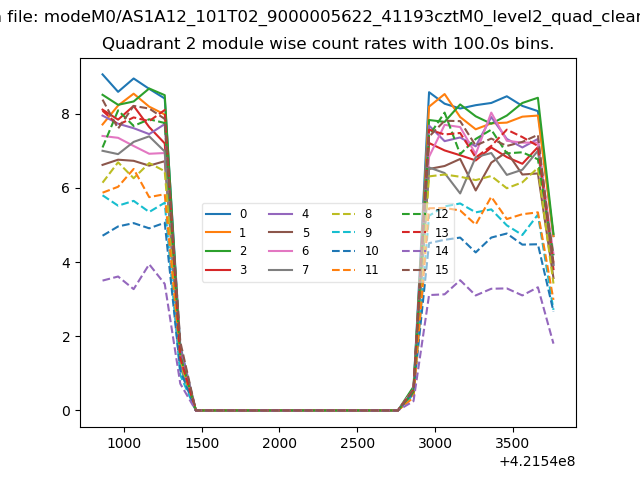
| Module-wise count rates for Quadrant B Data is divided into 100 sec bins |
 |
 |
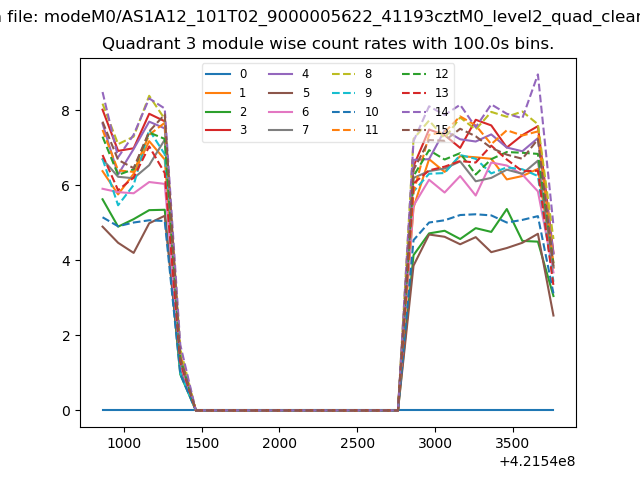
| Module-wise count rates for Quadrant C Data is divided into 100 sec bins |
 |
 |
| Module-wise count rates for Quadrant D Data is divided into 100 sec bins |
 |
 |
| Parameter | Plot |
|---|---|
| CZT HV Monitor | 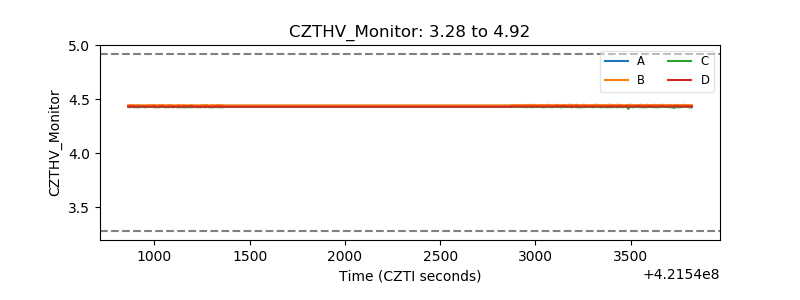 |
| D_VDD | 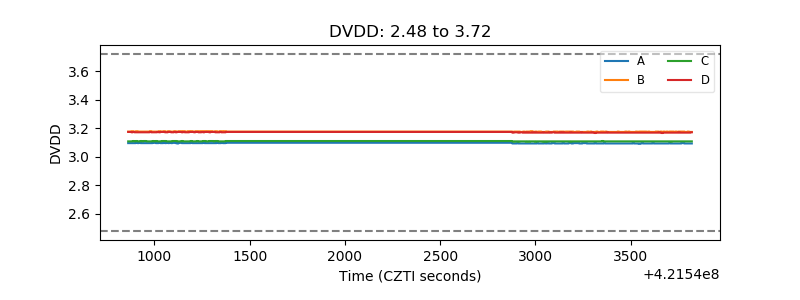 |
| Temperature 1 | 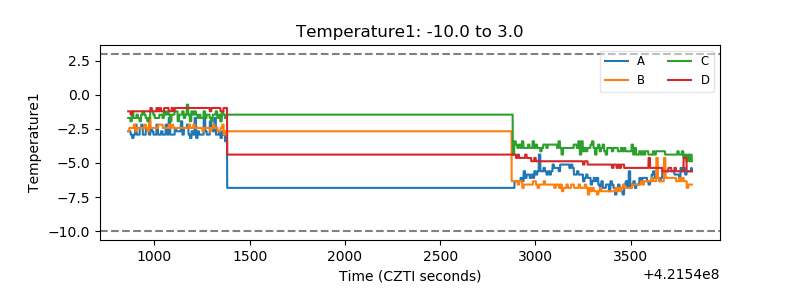 |
| Veto HV Monitor | 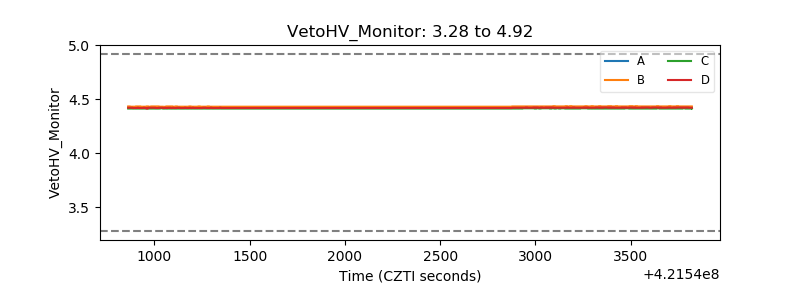 |
| Veto LLD | 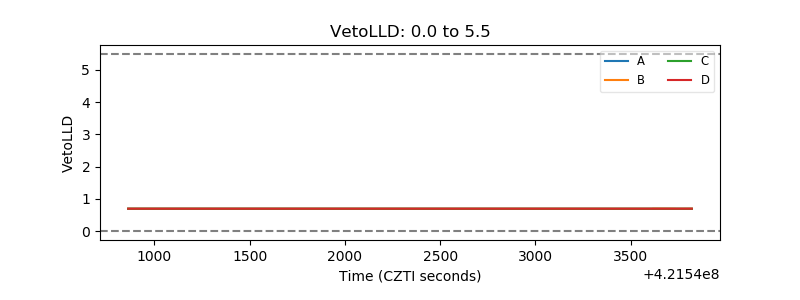 |
| Alpha Counter | 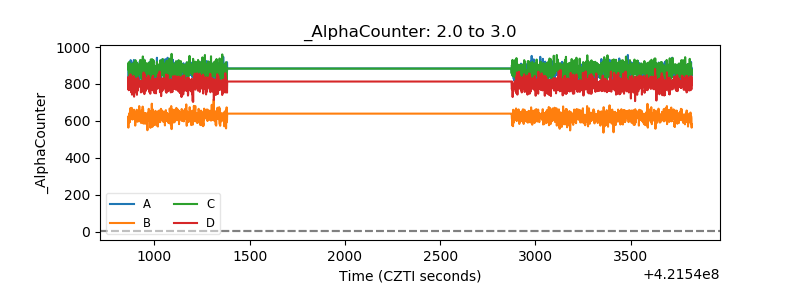 |
| _CPM_Rate | 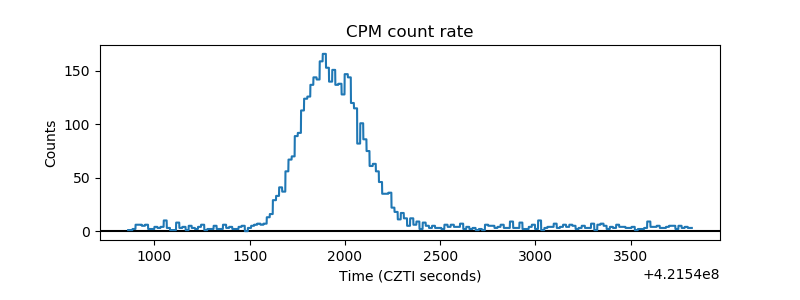 |
| CZT Counter | 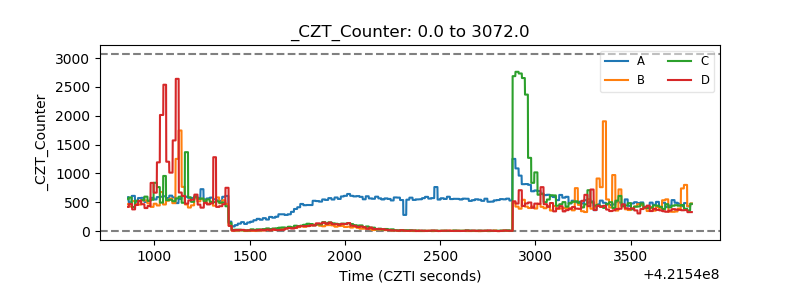 |
| +2.5 Volts monitor | 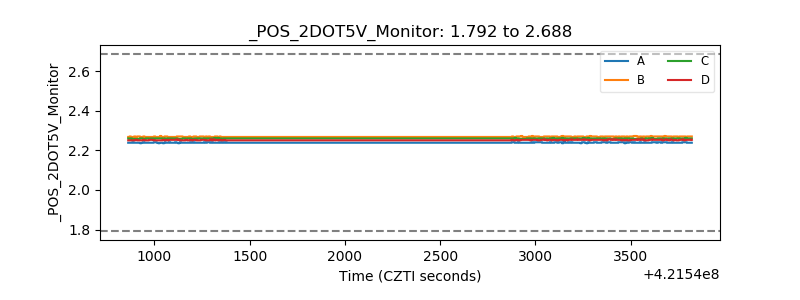 |
| +5 Volts monitor | 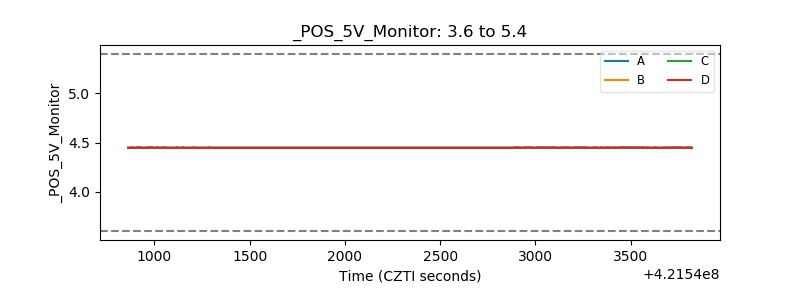 |
| _ROLL_ROT | 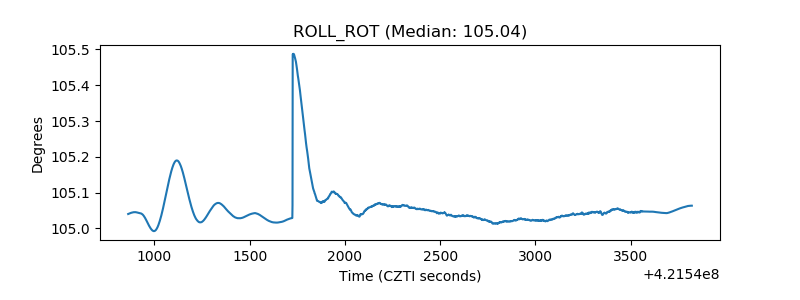 |
| _Roll_DEC | 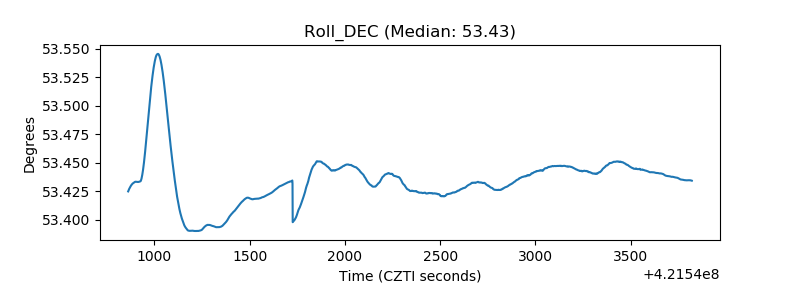 |
| _Roll_RA | 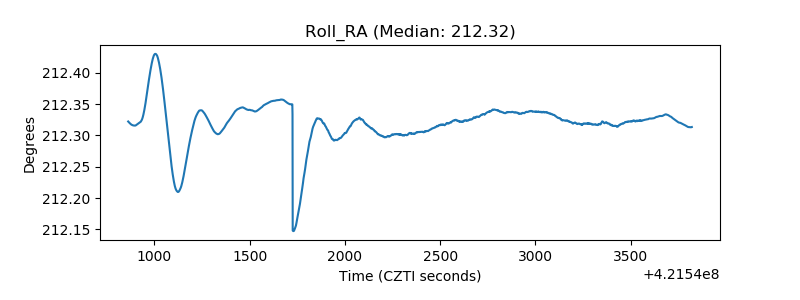 |
| Veto Counter | 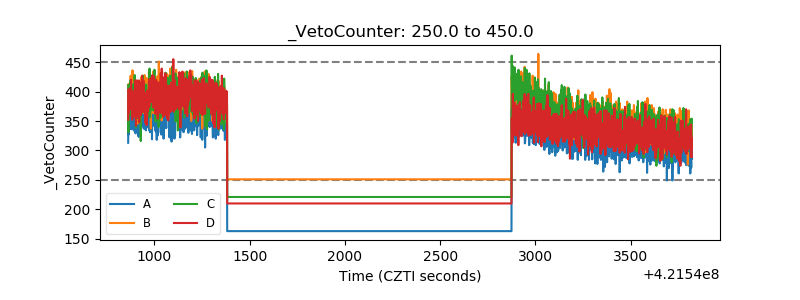 |