| Param | Original file | Final file |
|---|---|---|
| Filename | modeM0/AS1A12_101T02_9000005622_41196cztM0_level2.fits | modeM0/AS1A12_101T02_9000005622_41196cztM0_level2_quad_clean.evt |
| Size (bytes) | 326,093,760 | 86,299,200 |
| Size | 311.0 MB | 82.3 MB |
| Events in quadrant A | 2,798,358 | 579,549 |
| Events in quadrant B | 2,486,248 | 595,956 |
| Events in quadrant C | 3,629,300 | 537,405 |
| Events in quadrant D | 2,737,224 | 523,133 |
| Mode M9 | |||
|---|---|---|---|
| Quadrant | BADHDUFLAG | Total packets | Discarded packets |
| A | 0 | 29 | 0 |
| B | 0 | 29 | 0 |
| C | 0 | 29 | 0 |
| D | 0 | 30 | 0 |
| Mode M0 | |||
|---|---|---|---|
| Quadrant | BADHDUFLAG | Total packets | Discarded packets |
| A | 0 | 11614 | 3 |
| B | 0 | 11142 | 2 |
| C | 0 | 14361 | 2 |
| D | 0 | 12359 | 2 |
| Mode SS | |||
|---|---|---|---|
| Quadrant | BADHDUFLAG | Total packets | Discarded packets |
| A | 0 | 110 | 0 |
| B | 0 | 110 | 0 |
| C | 0 | 110 | 0 |
| D | 0 | 110 | 0 |
| Quadrant | Total seconds | Saturated seconds | Saturation percentage |
|---|---|---|---|
| A | 5383 | 7 | 0.130039% |
| B | 5383 | 13 | 0.241501% |
| C | 5383 | 390 | 7.245031% |
| D | 5383 | 97 | 1.801969% |
Noise dominated data is calculated using 1-second bins in cleaned event files. If a bin has >2000 counts, and if more than 50% of those come from <1% of pixels, then it is considered to be noise-dominated and hence unusable.
| Quadrant | # 1 sec bins | Bins with >0 counts | Bins with >2000 counts | High rate bins dominated by noise | Noise dominated (total time) | Noise dominated (detector-on time) | Marked lightcurve |
|---|---|---|---|---|---|---|---|
| A | 7117 | 5384 | 3 | 3 | 0.04% | 0.06% | 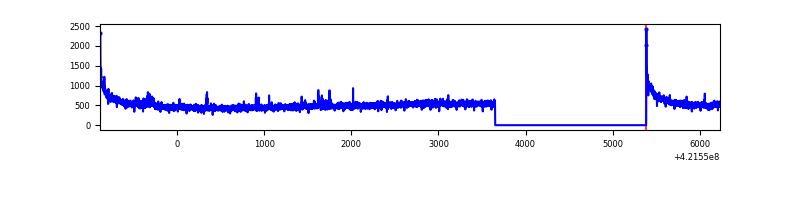 |
| B | 7117 | 5384 | 6 | 6 | 0.08% | 0.11% | 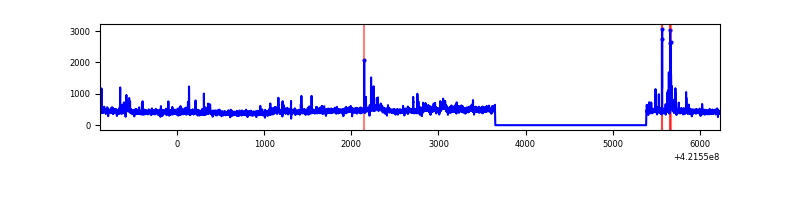 |
| C | 7117 | 5384 | 363 | 363 | 5.10% | 6.74% | 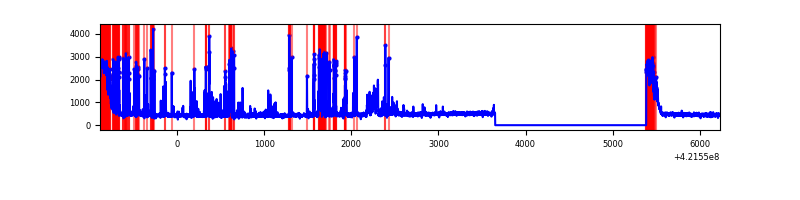 |
| D | 7117 | 5383 | 88 | 88 | 1.24% | 1.63% | 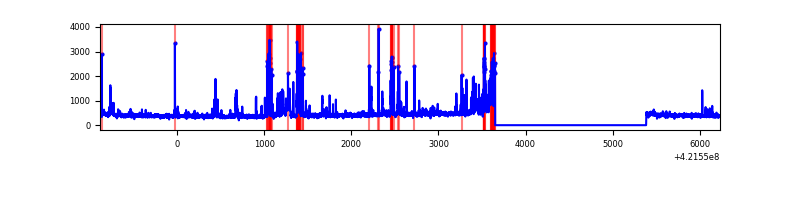 |
Top three noisy pixels from each quadrant. If the there are fewer than three noisy pixels in the level2.evt file, extra rows are filled as -1
| Pixel properties | Quadrant properties | ||||||
|---|---|---|---|---|---|---|---|
| Quadrant | DetID | PixID | Counts | Sigma | Mean | Median | Sigma |
| A | 10 | 83 | 521602 | 4405.4 | 571 | 559 | 118.3 |
| A | 2 | 79 | 25391 | 209.95 | 571 | 559 | 118.3 |
| A | 12 | 189 | 24339 | 201.06 | 571 | 559 | 118.3 |
| B | 0 | 229 | 126585 | 1144.52 | 568 | 554 | 110.1 |
| B | 5 | 255 | 60302 | 542.59 | 568 | 554 | 110.1 |
| B | 5 | 185 | 36219 | 323.88 | 568 | 554 | 110.1 |
| C | 9 | 54 | 813222 | 6507.15 | 535 | 537 | 124.9 |
| C | 0 | 10 | 500519 | 4003.34 | 535 | 537 | 124.9 |
| C | 15 | 214 | 226603 | 1810.11 | 535 | 537 | 124.9 |
| D | 2 | 249 | 451234 | 3341.38 | 550 | 535 | 134.9 |
| D | 13 | 249 | 131355 | 969.87 | 550 | 535 | 134.9 |
| D | 2 | 234 | 27299 | 198.42 | 550 | 535 | 134.9 |
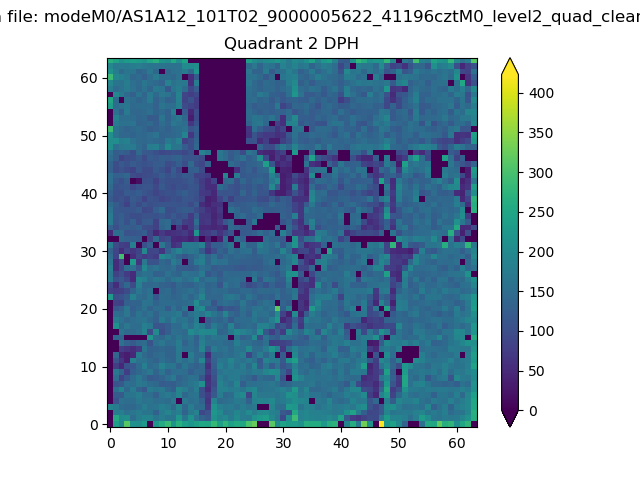
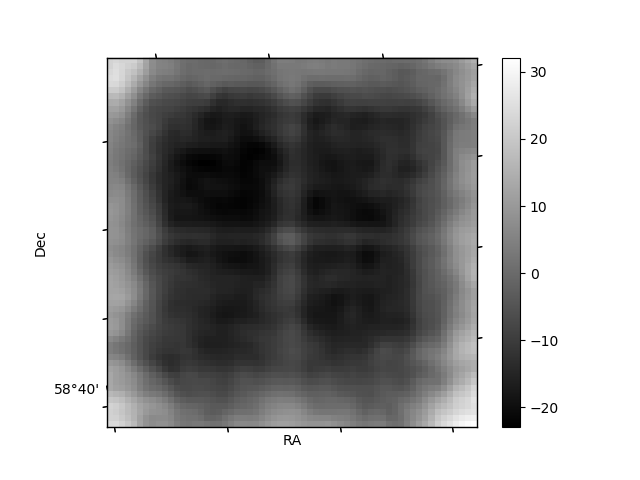
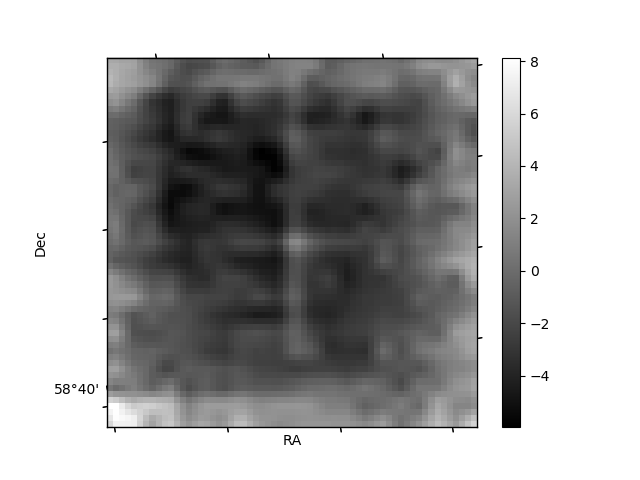
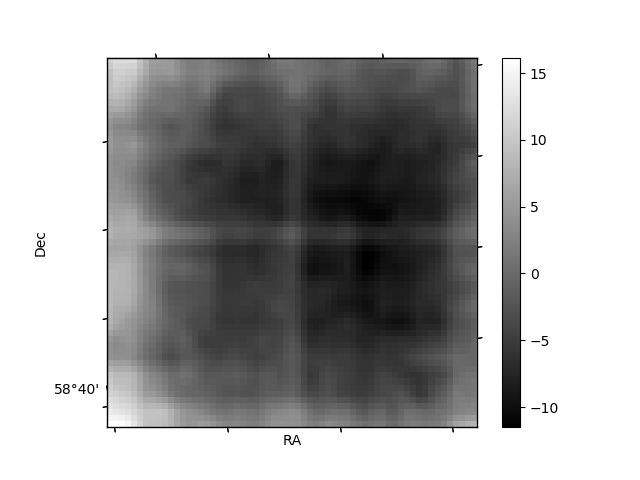
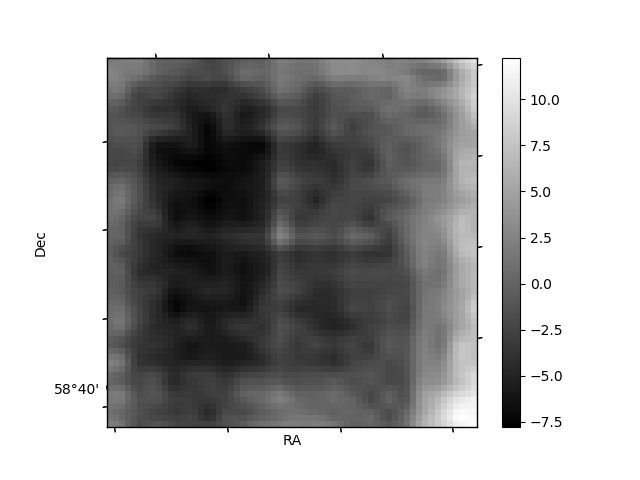
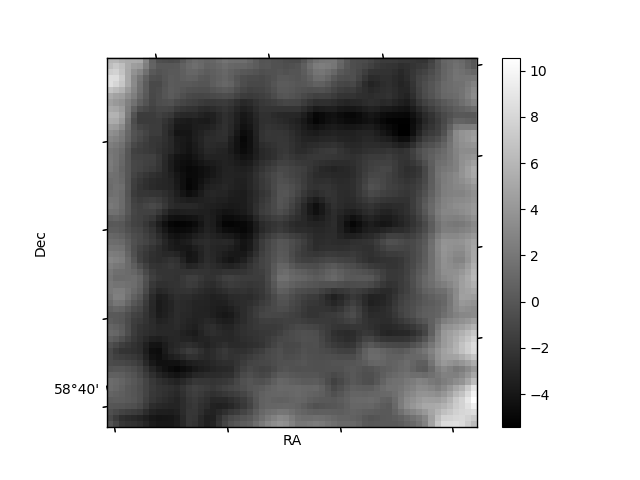
Histogram calculated using DETX and DETY for each event in the final _common_clean file
| Quadrant A | 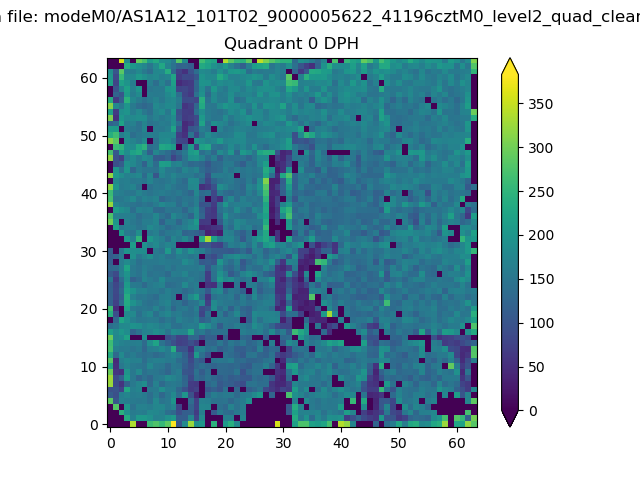 |
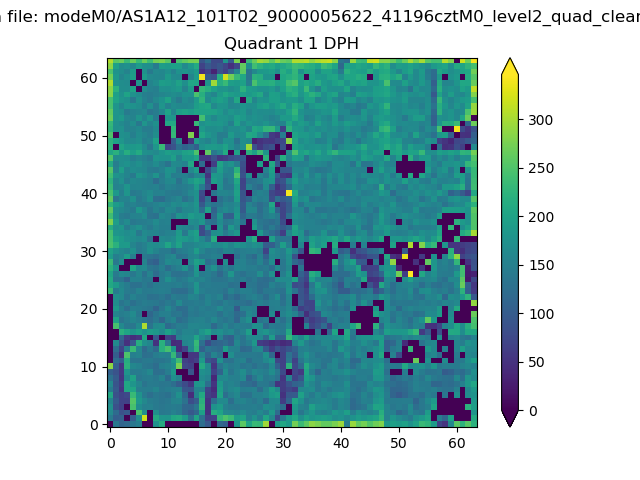 |
Quadrant B |
|---|---|---|---|
| Quadrant D | 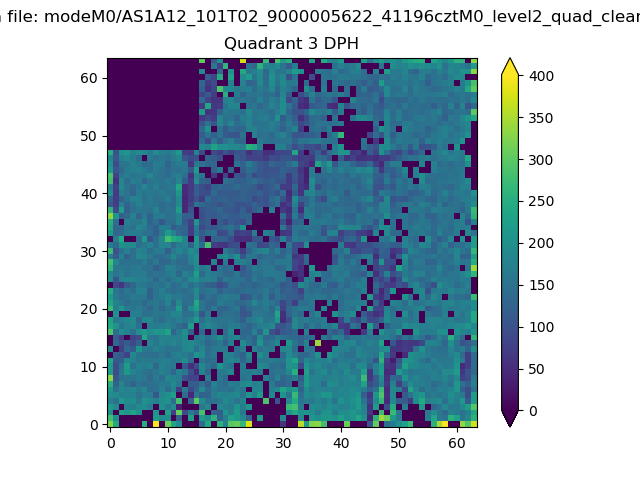 |
 |
Quadrant C |
| Plot type | Count rate plots | Images |
|---|---|---|
| Comparison with Poisson distribution Blue bars denote a histogram of data divided into 1 sec bins. Red curve is a Poisson curve with rate = median count rate of data. |
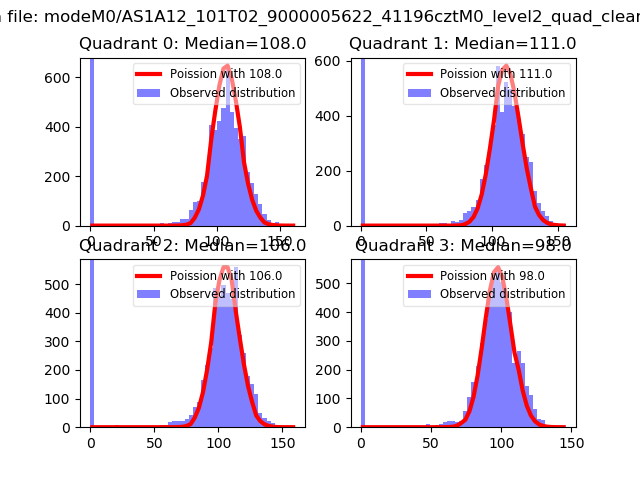 |
 |
| Quadrant-wise count rates Data is divided into 100 sec bins |
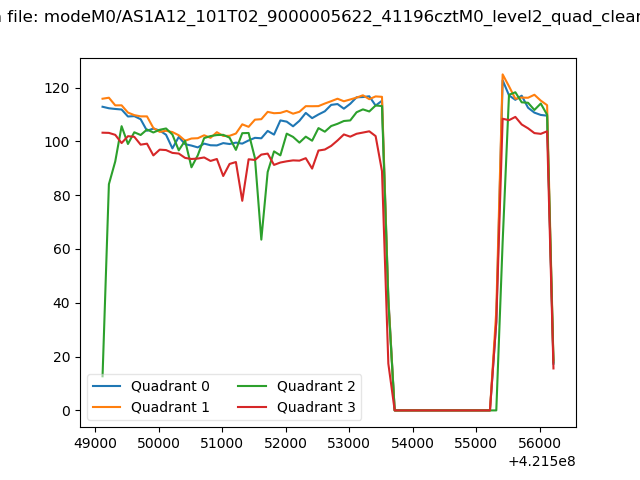 |
|
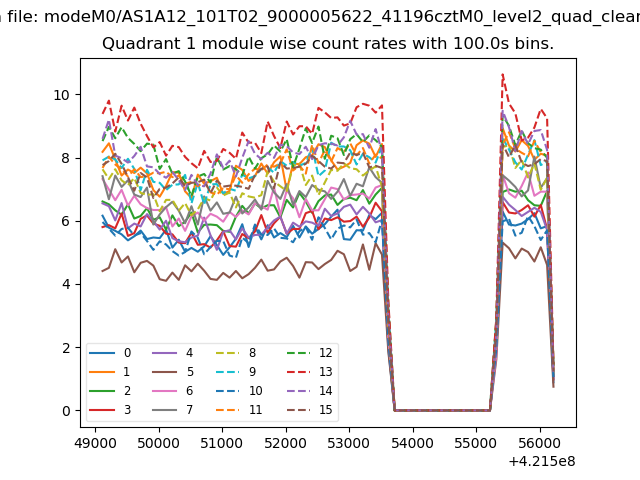
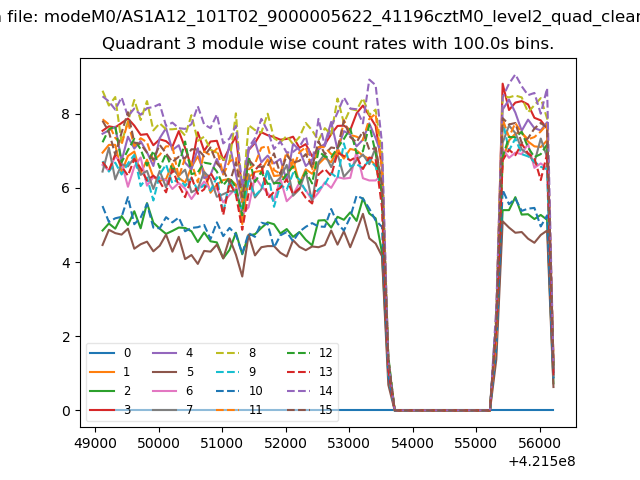
| Module-wise count rates for Quadrant A Data is divided into 100 sec bins |
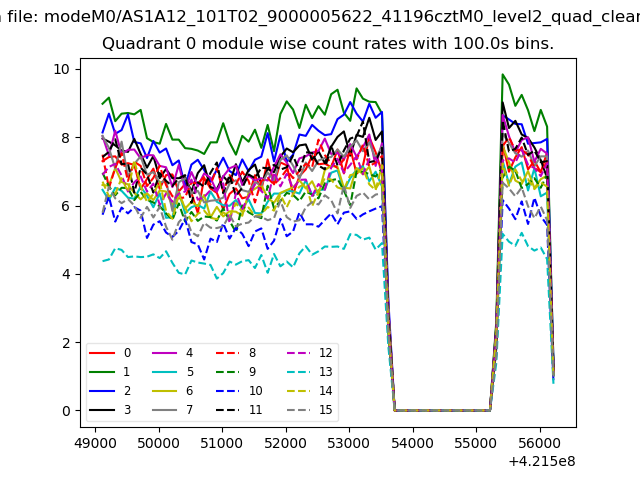 |
 |
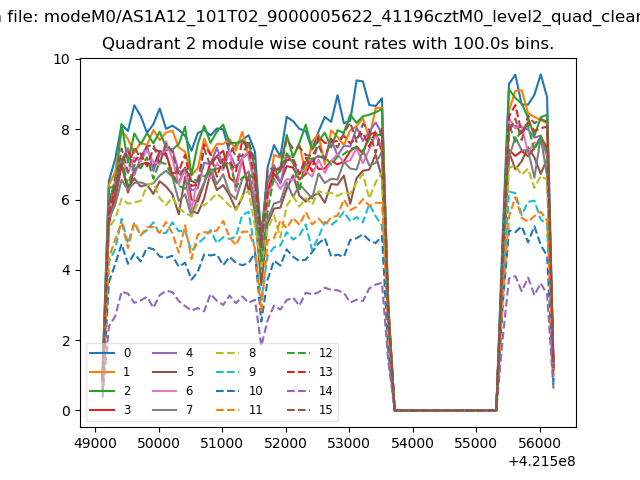
| Module-wise count rates for Quadrant B Data is divided into 100 sec bins |
 |
 |
| Module-wise count rates for Quadrant C Data is divided into 100 sec bins |
 |
 |
| Module-wise count rates for Quadrant D Data is divided into 100 sec bins |
 |
 |
| Parameter | Plot |
|---|---|
| CZT HV Monitor |  |
| D_VDD | 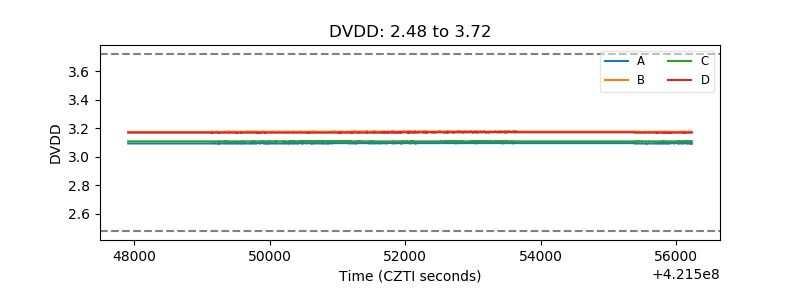 |
| Temperature 1 | 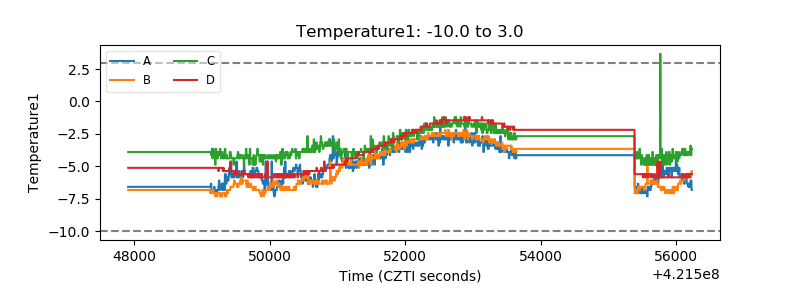 |
| Veto HV Monitor | 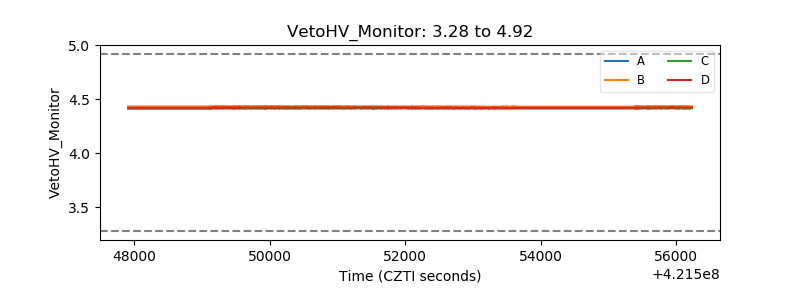 |
| Veto LLD | 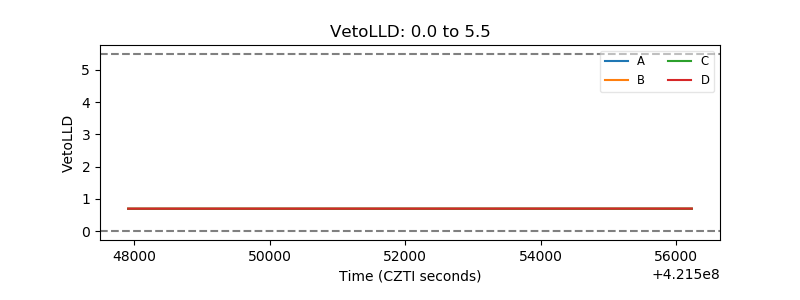 |
| Alpha Counter | 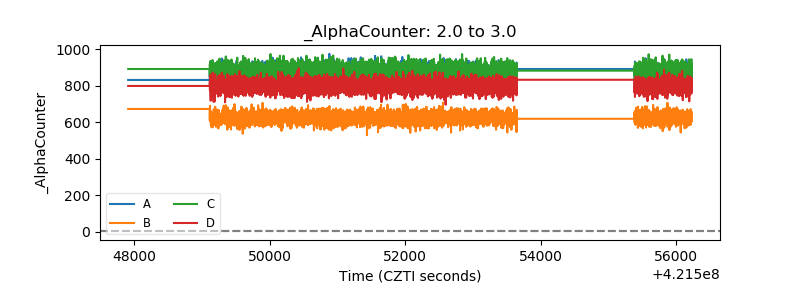 |
| _CPM_Rate | 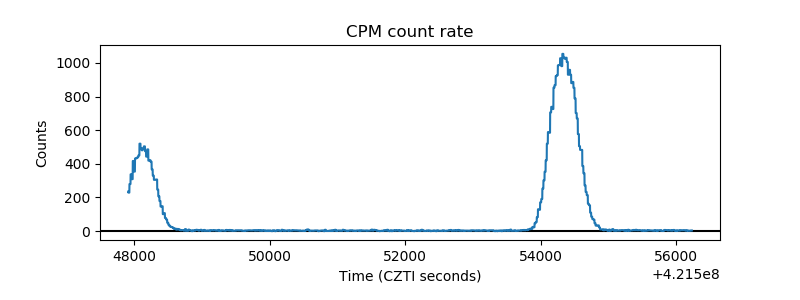 |
| CZT Counter | 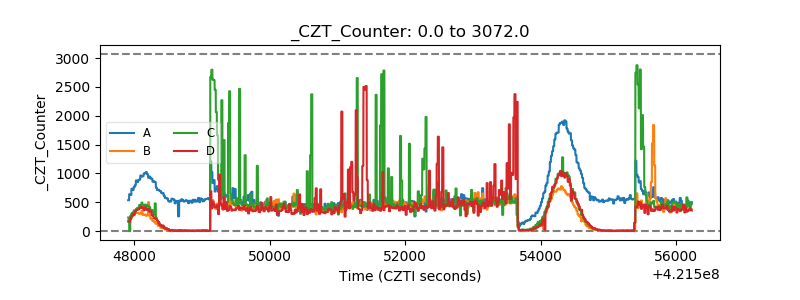 |
| +2.5 Volts monitor |  |
| +5 Volts monitor | 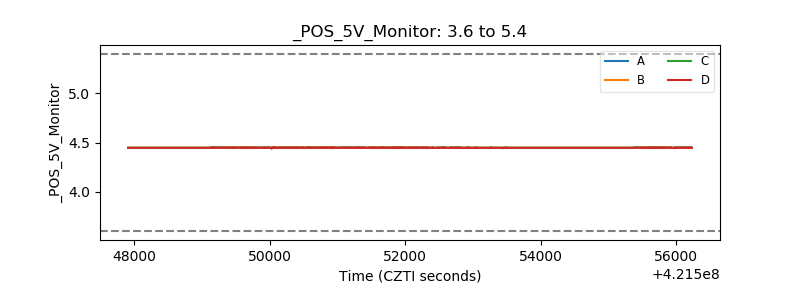 |
| _ROLL_ROT | 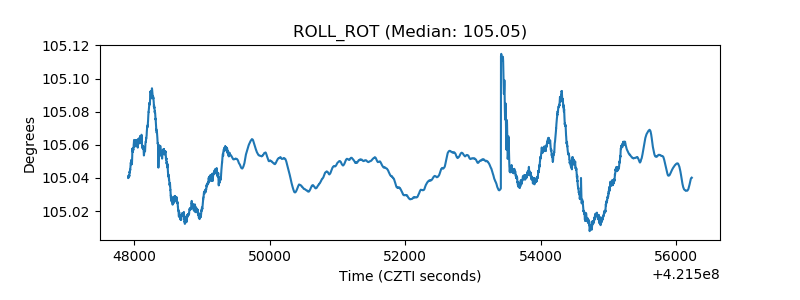 |
| _Roll_DEC | 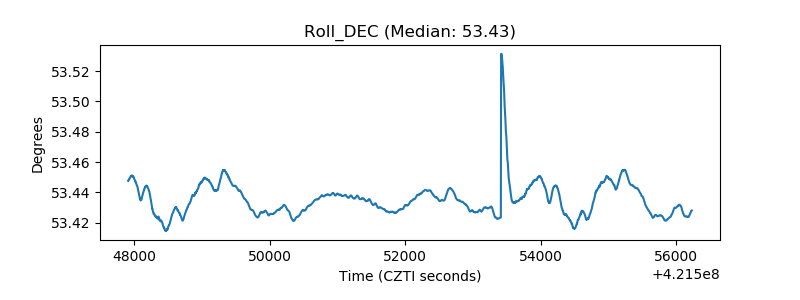 |
| _Roll_RA | 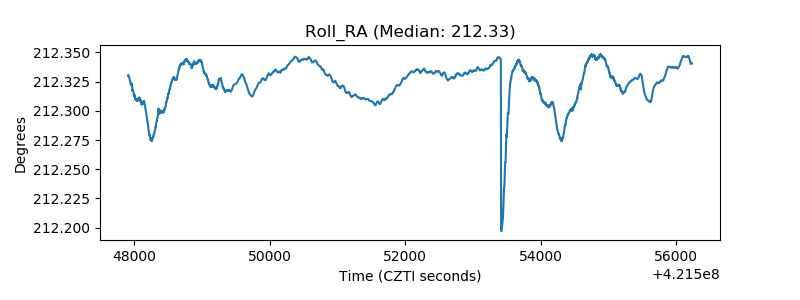 |
| Veto Counter | 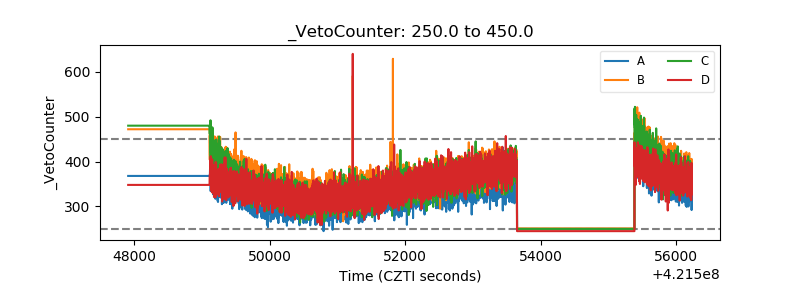 |