| Param | Original file | Final file |
|---|---|---|
| Filename | modeM0/AS1A12_101T02_9000005622_41197cztM0_level2.fits | modeM0/AS1A12_101T02_9000005622_41197cztM0_level2_quad_clean.evt |
| Size (bytes) | 313,012,800 | 84,931,200 |
| Size | 298.5 MB | 81.0 MB |
| Events in quadrant A | 2,717,559 | 575,260 |
| Events in quadrant B | 2,465,610 | 591,842 |
| Events in quadrant C | 2,898,211 | 538,613 |
| Events in quadrant D | 3,106,943 | 508,134 |
| Mode M9 | |||
|---|---|---|---|
| Quadrant | BADHDUFLAG | Total packets | Discarded packets |
| A | 0 | 28 | 0 |
| B | 0 | 28 | 0 |
| C | 0 | 28 | 0 |
| D | 0 | 29 | 0 |
| Mode M0 | |||
|---|---|---|---|
| Quadrant | BADHDUFLAG | Total packets | Discarded packets |
| A | 0 | 11098 | 3 |
| B | 0 | 10844 | 2 |
| C | 0 | 11897 | 2 |
| D | 0 | 13139 | 2 |
| Mode SS | |||
|---|---|---|---|
| Quadrant | BADHDUFLAG | Total packets | Discarded packets |
| A | 0 | 104 | 0 |
| B | 0 | 104 | 0 |
| C | 0 | 104 | 0 |
| D | 0 | 104 | 0 |
| Quadrant | Total seconds | Saturated seconds | Saturation percentage |
|---|---|---|---|
| A | 5108 | 8 | 0.156617% |
| B | 5108 | 23 | 0.450274% |
| C | 5108 | 207 | 4.052467% |
| D | 5108 | 158 | 3.093187% |
Noise dominated data is calculated using 1-second bins in cleaned event files. If a bin has >2000 counts, and if more than 50% of those come from <1% of pixels, then it is considered to be noise-dominated and hence unusable.
| Quadrant | # 1 sec bins | Bins with >0 counts | Bins with >2000 counts | High rate bins dominated by noise | Noise dominated (total time) | Noise dominated (detector-on time) | Marked lightcurve |
|---|---|---|---|---|---|---|---|
| A | 6960 | 5109 | 3 | 3 | 0.04% | 0.06% | 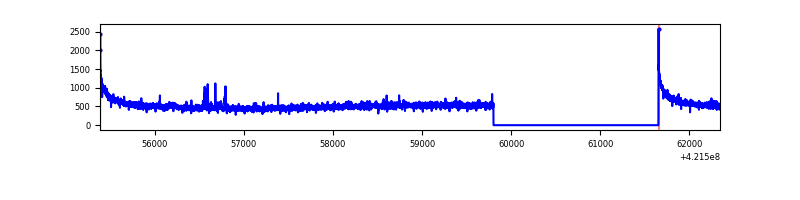 |
| B | 6960 | 5109 | 12 | 12 | 0.17% | 0.23% | 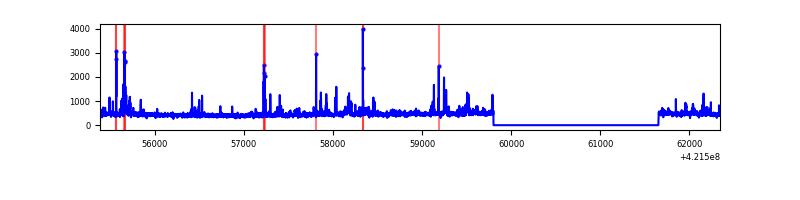 |
| C | 6960 | 5109 | 207 | 207 | 2.97% | 4.05% | 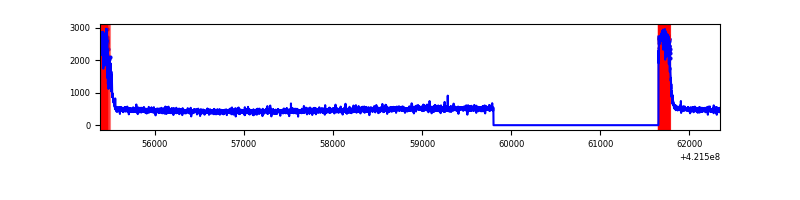 |
| D | 6960 | 5109 | 132 | 132 | 1.90% | 2.58% | 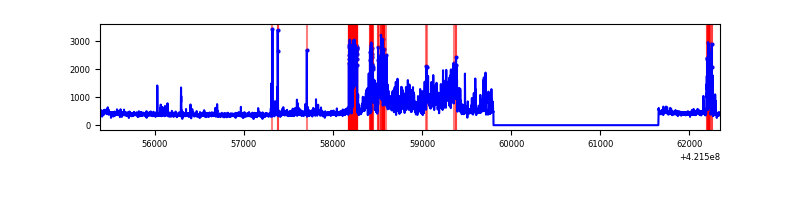 |
Top three noisy pixels from each quadrant. If the there are fewer than three noisy pixels in the level2.evt file, extra rows are filled as -1
| Pixel properties | Quadrant properties | ||||||
|---|---|---|---|---|---|---|---|
| Quadrant | DetID | PixID | Counts | Sigma | Mean | Median | Sigma |
| A | 10 | 83 | 501135 | 4383.06 | 558 | 548 | 114.2 |
| A | 10 | 255 | 20868 | 177.92 | 558 | 548 | 114.2 |
| A | 12 | 189 | 14190 | 119.45 | 558 | 548 | 114.2 |
| B | 5 | 255 | 134908 | 1256.21 | 553 | 538 | 107.0 |
| B | 0 | 229 | 69980 | 649.2 | 553 | 538 | 107.0 |
| B | 5 | 185 | 35951 | 331.07 | 553 | 538 | 107.0 |
| C | 0 | 10 | 626389 | 5111.61 | 526 | 529 | 122.4 |
| C | 15 | 214 | 216980 | 1767.83 | 526 | 529 | 122.4 |
| C | 13 | 61 | 3572 | 24.85 | 526 | 529 | 122.4 |
| D | 12 | 217 | 593799 | 4482.61 | 533 | 519 | 132.4 |
| D | 13 | 249 | 379493 | 2863.39 | 533 | 519 | 132.4 |
| D | 2 | 249 | 49679 | 371.43 | 533 | 519 | 132.4 |
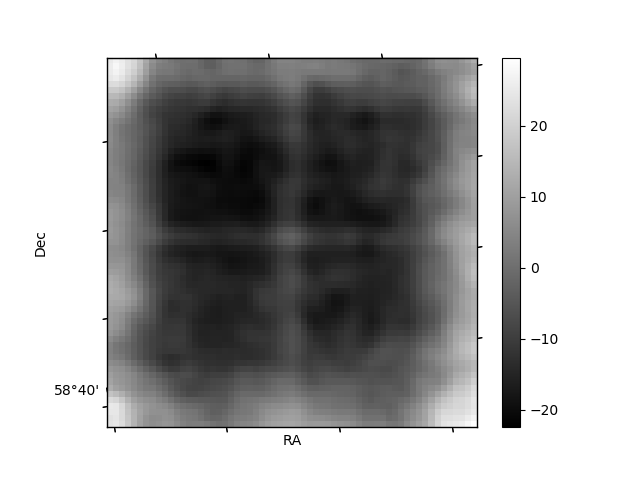
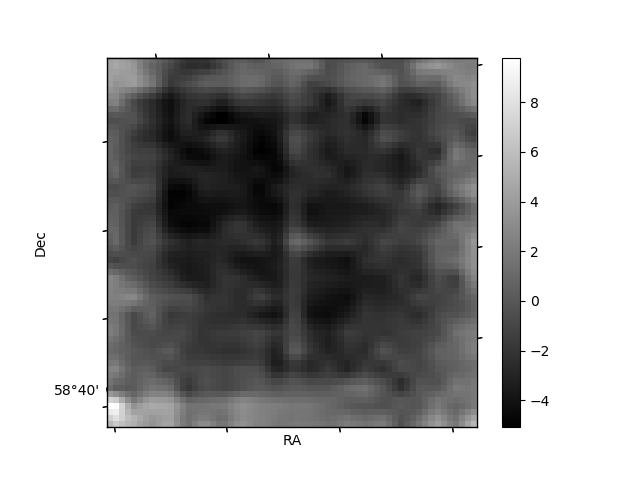
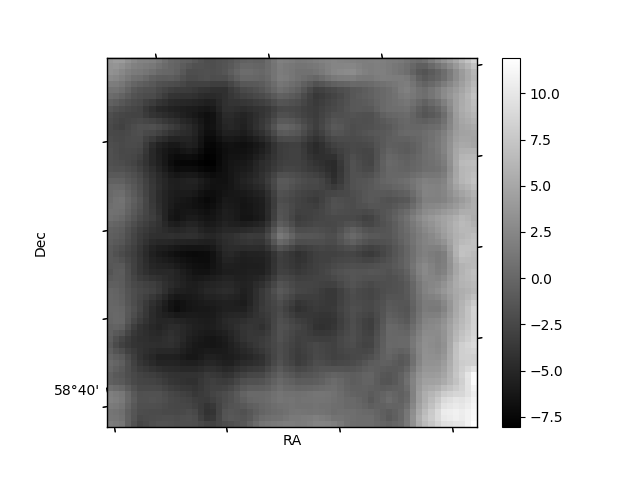
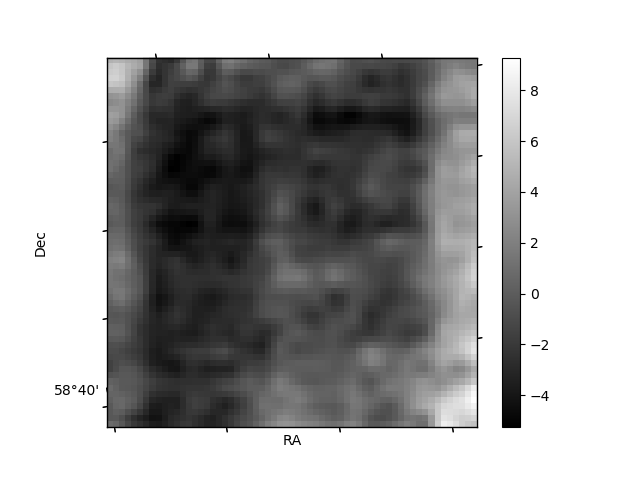
Histogram calculated using DETX and DETY for each event in the final _common_clean file
| Quadrant A | 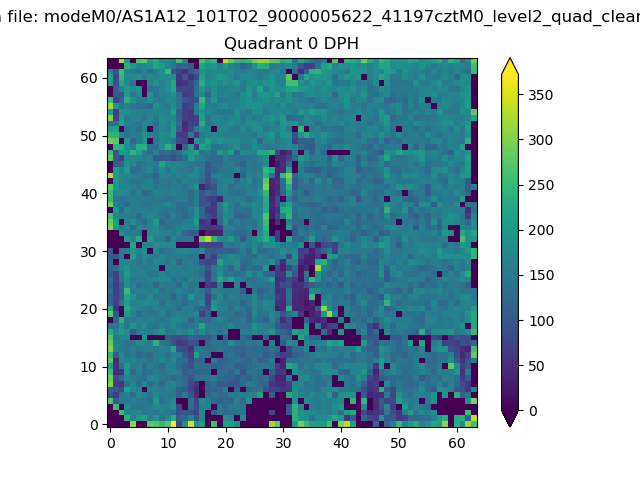 |
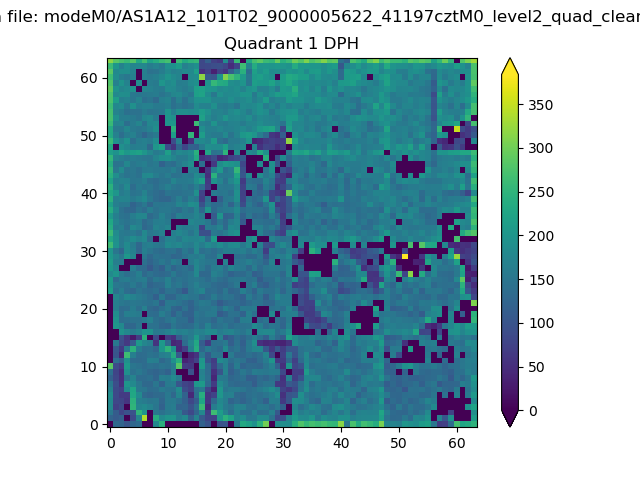 |
Quadrant B |
|---|---|---|---|
| Quadrant D | 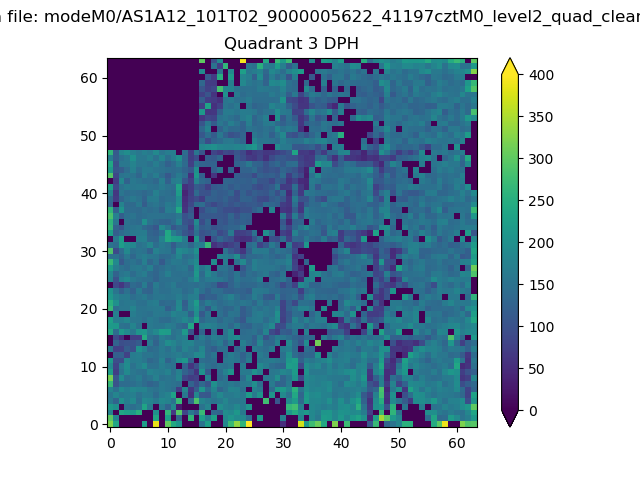 |
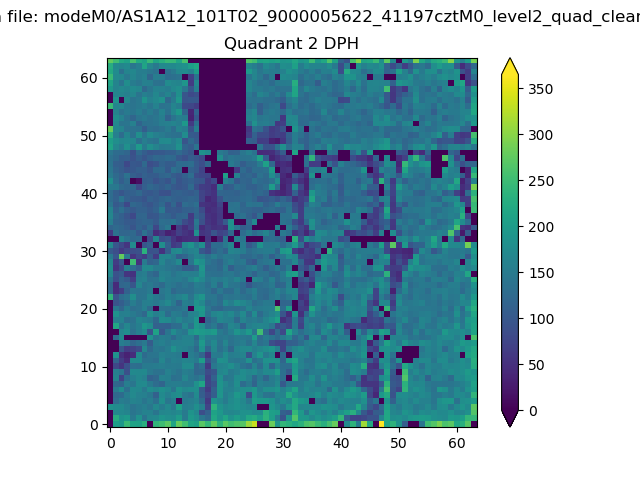 |
Quadrant C |
| Plot type | Count rate plots | Images |
|---|---|---|
| Comparison with Poisson distribution Blue bars denote a histogram of data divided into 1 sec bins. Red curve is a Poisson curve with rate = median count rate of data. |
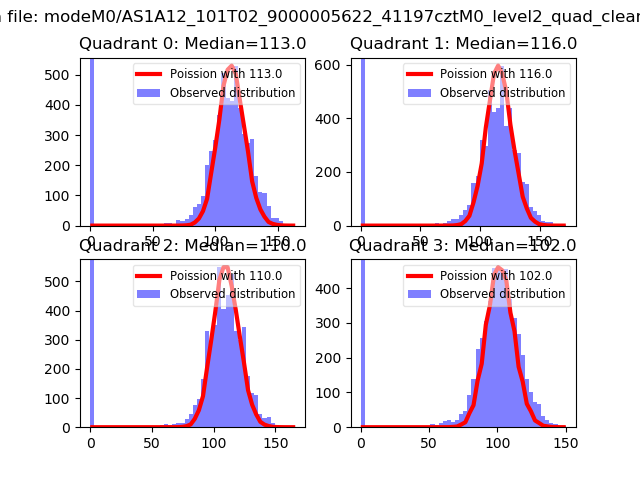 |
 |
| Quadrant-wise count rates Data is divided into 100 sec bins |
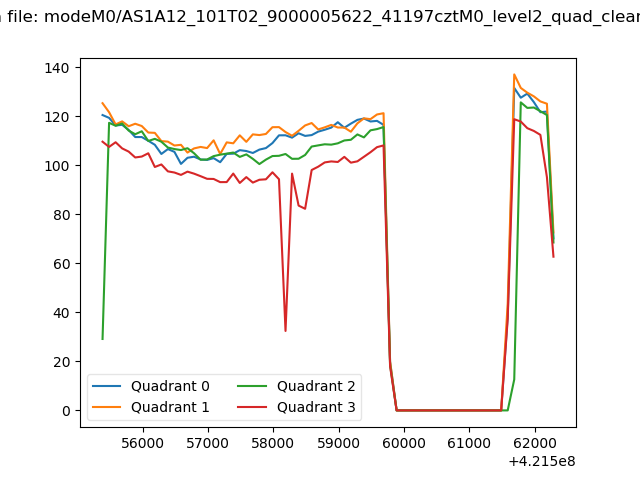 |
|
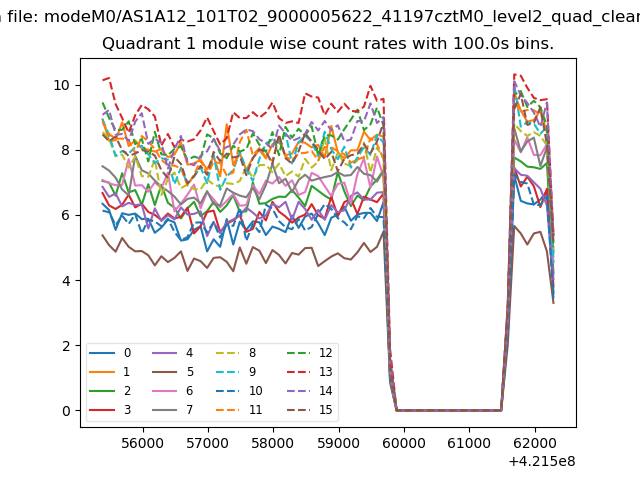
| Module-wise count rates for Quadrant A Data is divided into 100 sec bins |
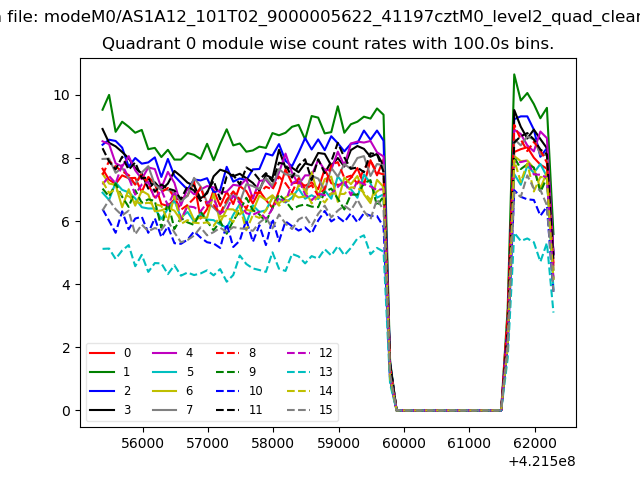 |
 |
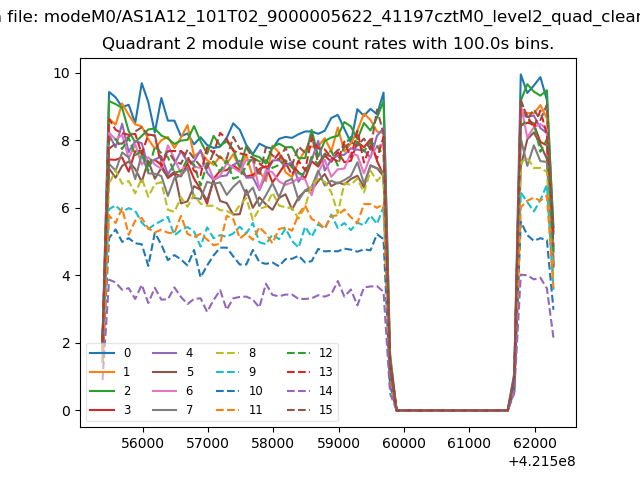
| Module-wise count rates for Quadrant B Data is divided into 100 sec bins |
 |
 |
| Module-wise count rates for Quadrant C Data is divided into 100 sec bins |
 |
 |
| Module-wise count rates for Quadrant D Data is divided into 100 sec bins |
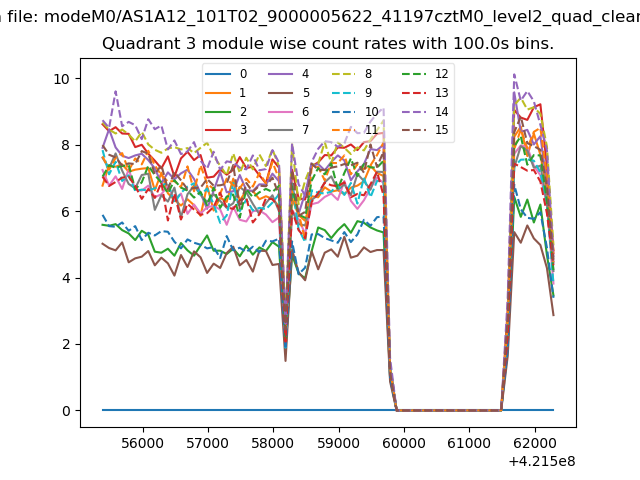 |
 |
| Parameter | Plot |
|---|---|
| CZT HV Monitor | 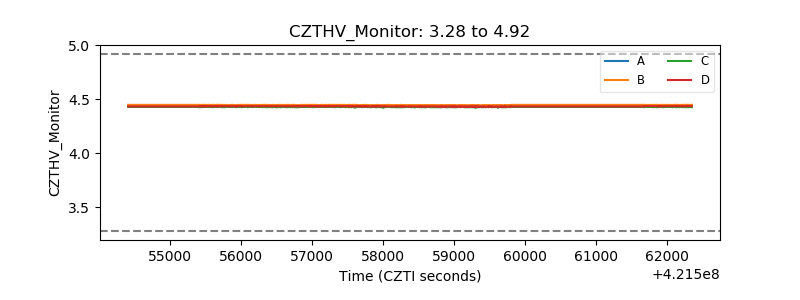 |
| D_VDD | 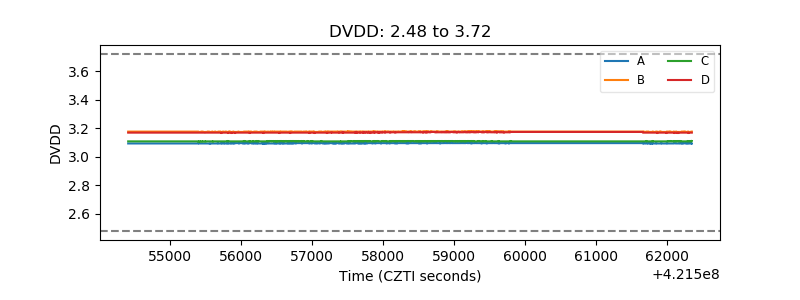 |
| Temperature 1 | 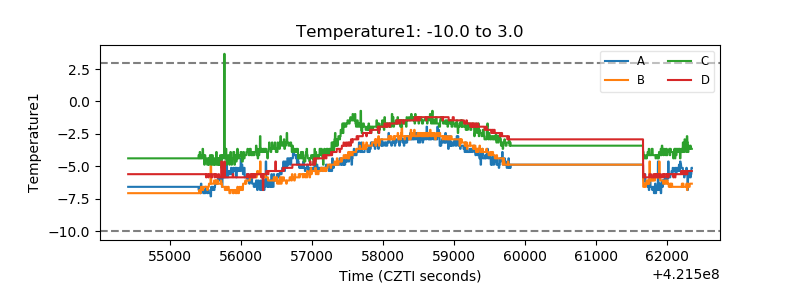 |
| Veto HV Monitor | 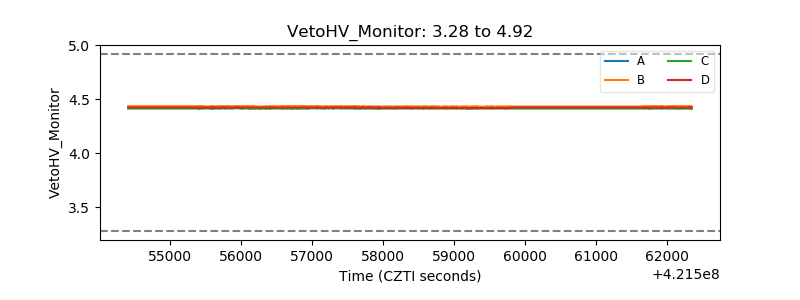 |
| Veto LLD | 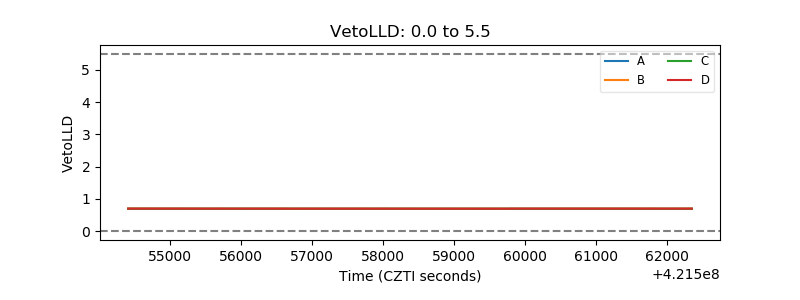 |
| Alpha Counter | 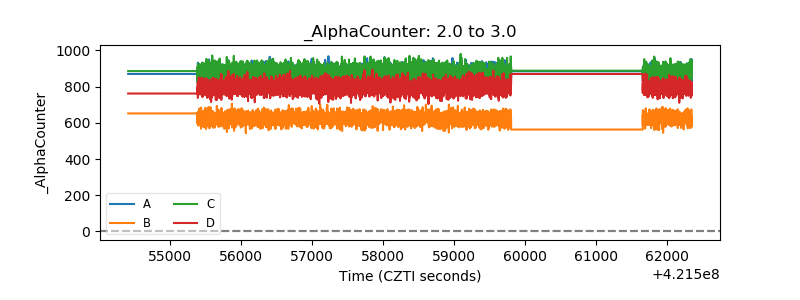 |
| _CPM_Rate | 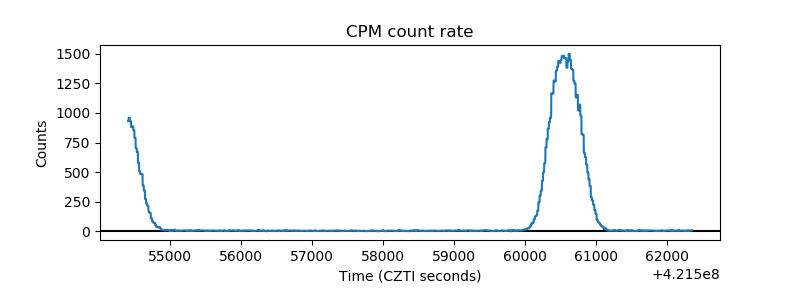 |
| CZT Counter | 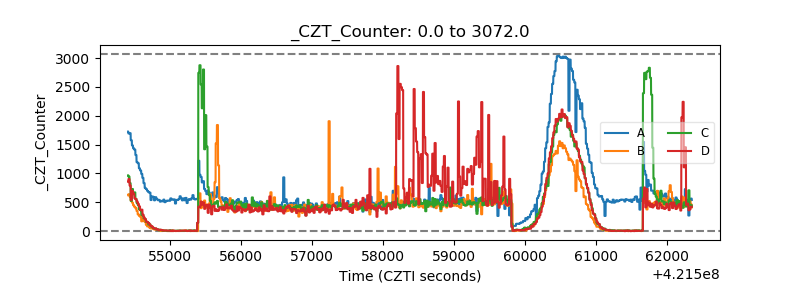 |
| +2.5 Volts monitor | 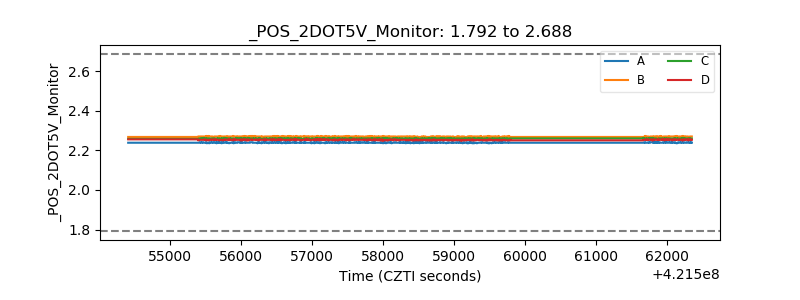 |
| +5 Volts monitor | 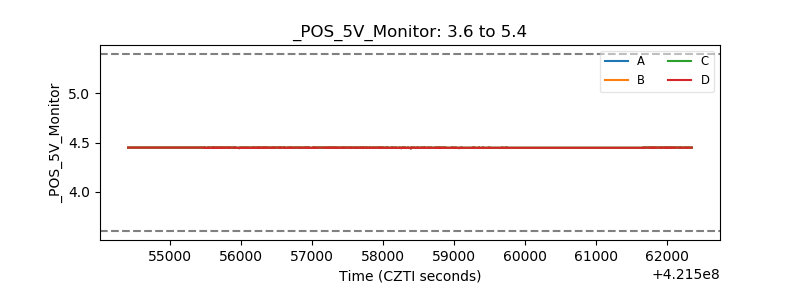 |
| _ROLL_ROT | 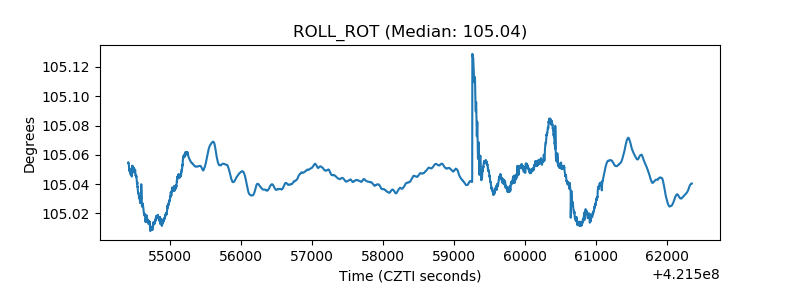 |
| _Roll_DEC | 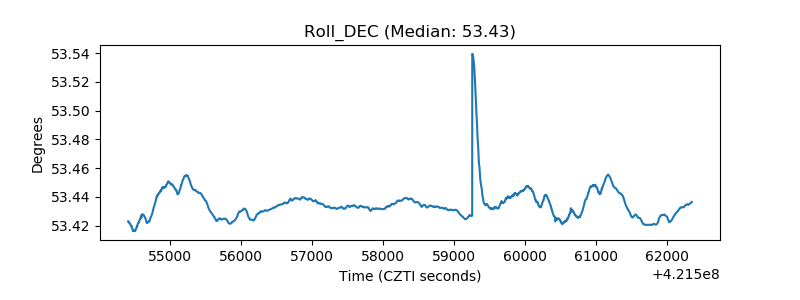 |
| _Roll_RA | 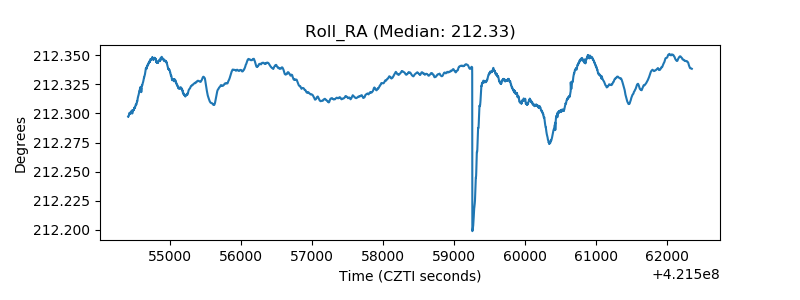 |
| Veto Counter | 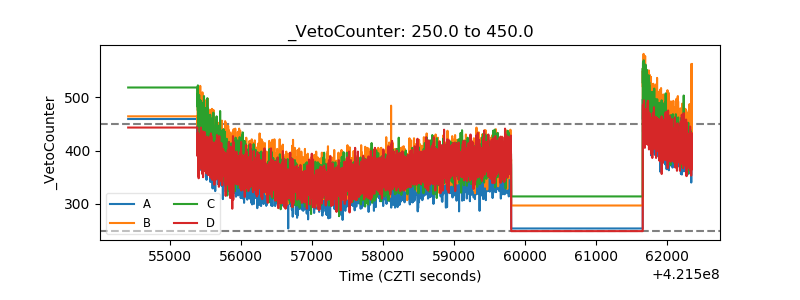 |