| Param | Original file | Final file |
|---|---|---|
| Filename | modeM0/AS1A12_101T02_9000005622_41199cztM0_level2.fits | modeM0/AS1A12_101T02_9000005622_41199cztM0_level2_quad_clean.evt |
| Size (bytes) | 303,168,960 | 88,441,920 |
| Size | 289.1 MB | 84.3 MB |
| Events in quadrant A | 2,743,205 | 612,020 |
| Events in quadrant B | 2,426,348 | 629,118 |
| Events in quadrant C | 2,941,021 | 558,556 |
| Events in quadrant D | 2,730,042 | 535,699 |
| Mode M9 | |||
|---|---|---|---|
| Quadrant | BADHDUFLAG | Total packets | Discarded packets |
| A | 0 | 32 | 0 |
| B | 0 | 32 | 0 |
| C | 0 | 32 | 0 |
| D | 0 | 33 | 0 |
| Mode M0 | |||
|---|---|---|---|
| Quadrant | BADHDUFLAG | Total packets | Discarded packets |
| A | 0 | 10943 | 3 |
| B | 0 | 10374 | 2 |
| C | 0 | 11610 | 2 |
| D | 0 | 11473 | 2 |
| Mode SS | |||
|---|---|---|---|
| Quadrant | BADHDUFLAG | Total packets | Discarded packets |
| A | 0 | 98 | 0 |
| B | 0 | 98 | 0 |
| C | 0 | 98 | 0 |
| D | 0 | 98 | 0 |
| Quadrant | Total seconds | Saturated seconds | Saturation percentage |
|---|---|---|---|
| A | 4892 | 10 | 0.204415% |
| B | 4892 | 40 | 0.817661% |
| C | 4892 | 225 | 4.599346% |
| D | 4892 | 104 | 2.125920% |
Noise dominated data is calculated using 1-second bins in cleaned event files. If a bin has >2000 counts, and if more than 50% of those come from <1% of pixels, then it is considered to be noise-dominated and hence unusable.
| Quadrant | # 1 sec bins | Bins with >0 counts | Bins with >2000 counts | High rate bins dominated by noise | Noise dominated (total time) | Noise dominated (detector-on time) | Marked lightcurve |
|---|---|---|---|---|---|---|---|
| A | 6985 | 4893 | 4 | 4 | 0.06% | 0.08% | 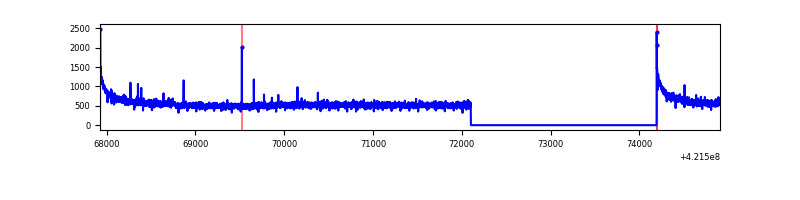 |
| B | 6985 | 4893 | 25 | 25 | 0.36% | 0.51% | 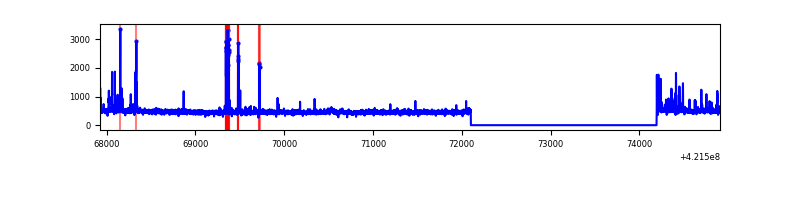 |
| C | 6985 | 4893 | 231 | 231 | 3.31% | 4.72% | 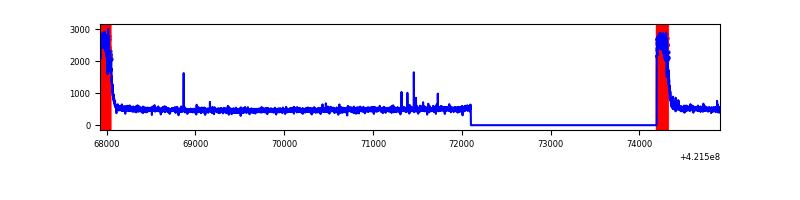 |
| D | 6985 | 4893 | 94 | 94 | 1.35% | 1.92% | 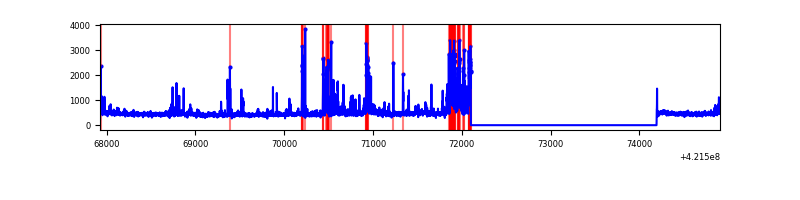 |
Top three noisy pixels from each quadrant. If the there are fewer than three noisy pixels in the level2.evt file, extra rows are filled as -1
| Pixel properties | Quadrant properties | ||||||
|---|---|---|---|---|---|---|---|
| Quadrant | DetID | PixID | Counts | Sigma | Mean | Median | Sigma |
| A | 10 | 83 | 493334 | 4242.4 | 573 | 564 | 116.2 |
| A | 2 | 79 | 16160 | 134.27 | 573 | 564 | 116.2 |
| A | 12 | 189 | 13261 | 109.31 | 573 | 564 | 116.2 |
| B | 5 | 255 | 150324 | 1388.55 | 565 | 550 | 107.9 |
| B | 0 | 190 | 35161 | 320.88 | 565 | 550 | 107.9 |
| B | 12 | 111 | 13199 | 117.27 | 565 | 550 | 107.9 |
| C | 0 | 10 | 637509 | 5225.37 | 533 | 537 | 121.9 |
| C | 15 | 214 | 208631 | 1707.09 | 533 | 537 | 121.9 |
| C | 14 | 254 | 8160 | 62.53 | 533 | 537 | 121.9 |
| D | 13 | 249 | 219627 | 1639.84 | 550 | 535 | 133.6 |
| D | 10 | 199 | 126311 | 941.4 | 550 | 535 | 133.6 |
| D | 2 | 249 | 126126 | 940.01 | 550 | 535 | 133.6 |
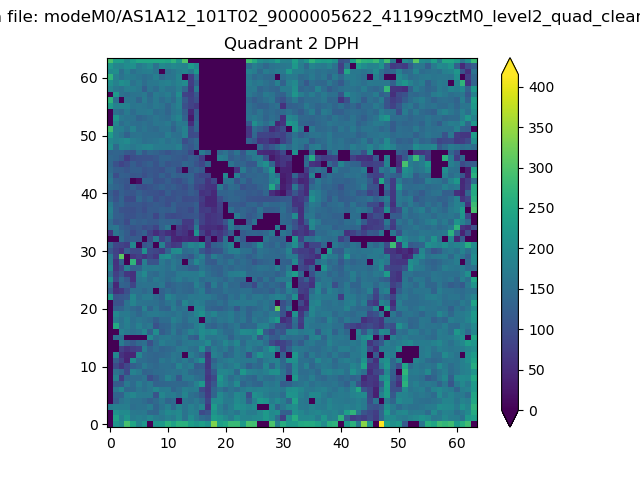
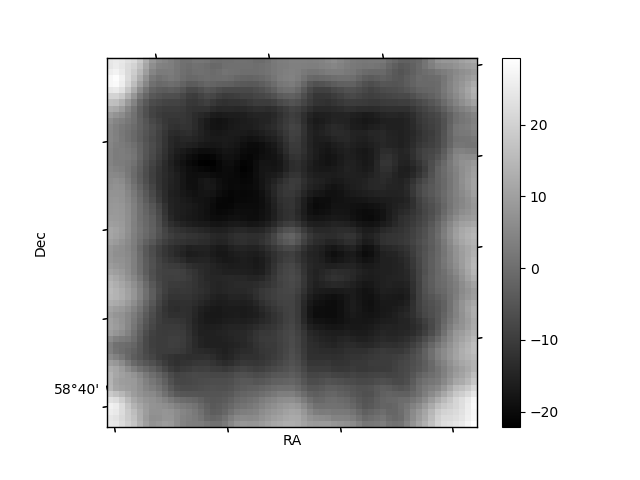
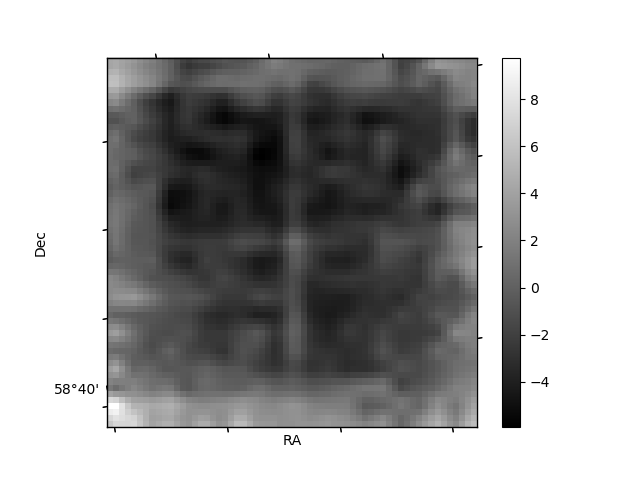
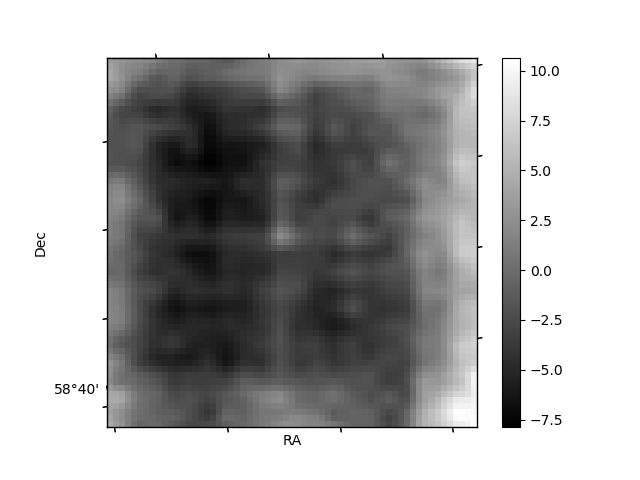
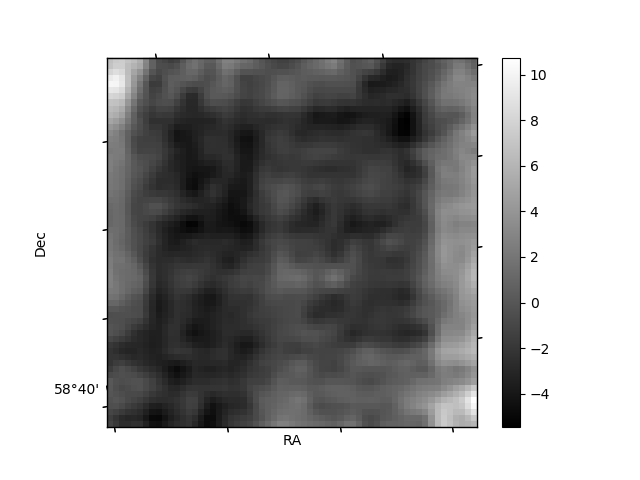
Histogram calculated using DETX and DETY for each event in the final _common_clean file
| Quadrant A | 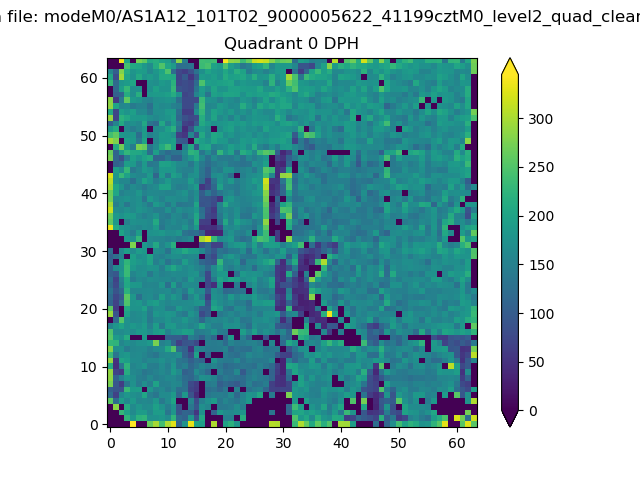 |
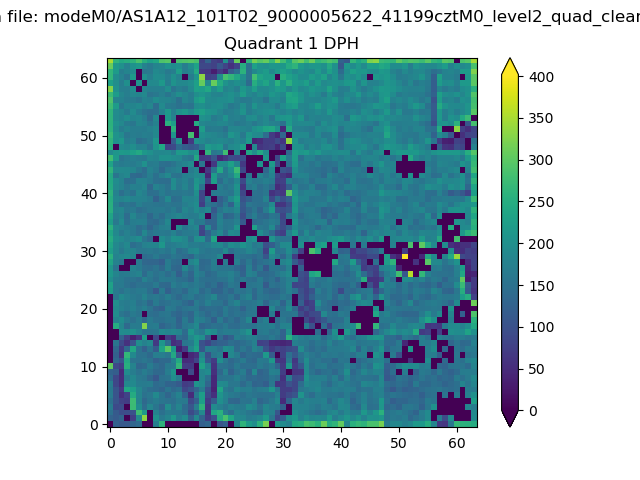 |
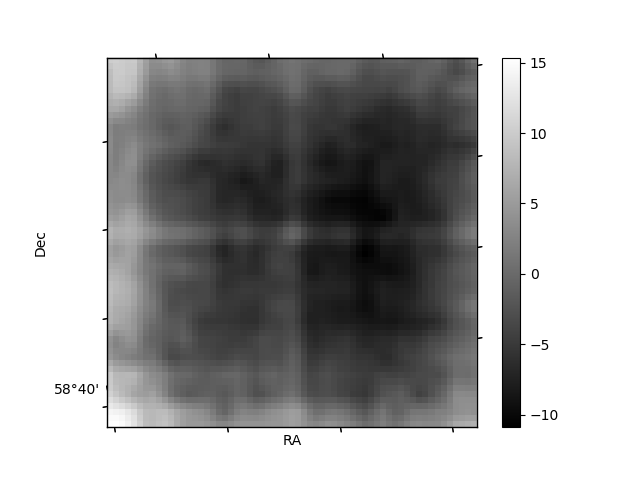
Quadrant B |
|---|---|---|---|
| Quadrant D | 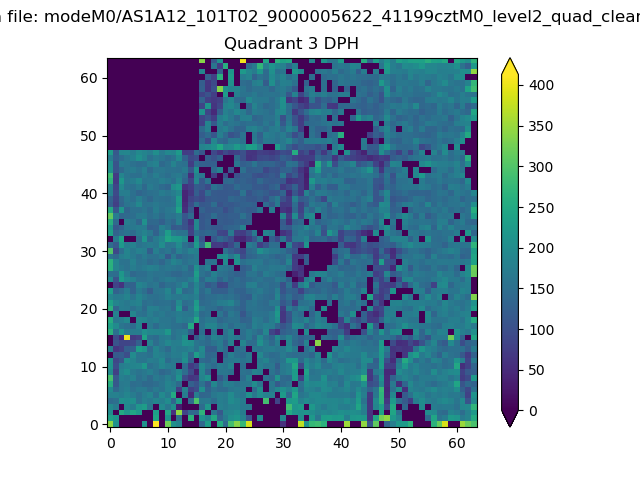 |
 |
Quadrant C |
| Plot type | Count rate plots | Images |
|---|---|---|
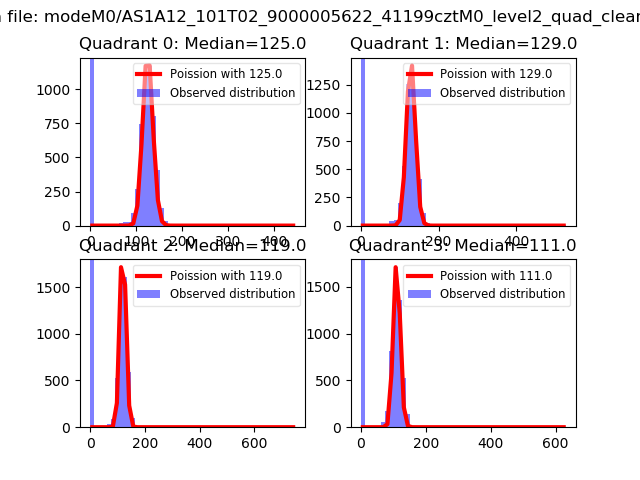
| Comparison with Poisson distribution Blue bars denote a histogram of data divided into 1 sec bins. Red curve is a Poisson curve with rate = median count rate of data. |
 |
 |
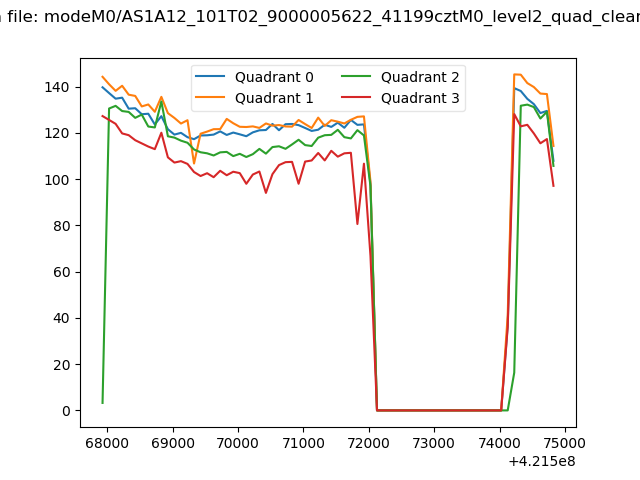
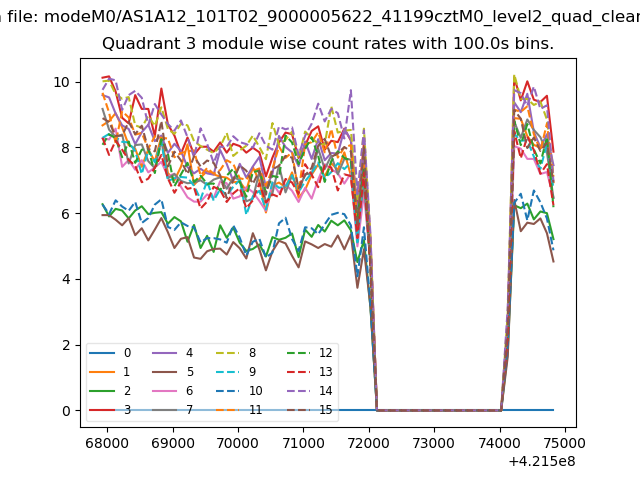
| Quadrant-wise count rates Data is divided into 100 sec bins |
 |
|
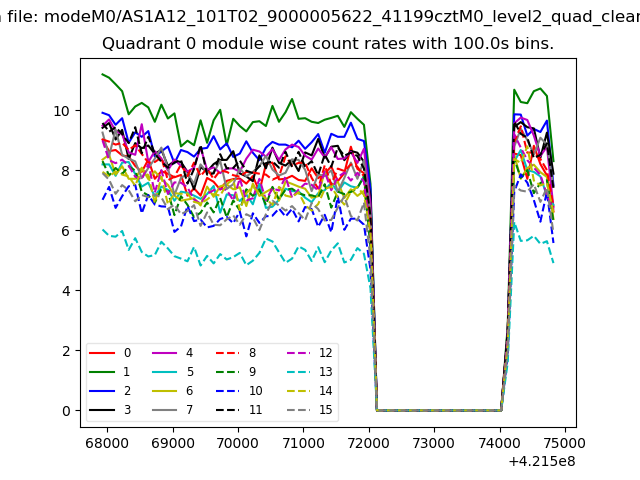
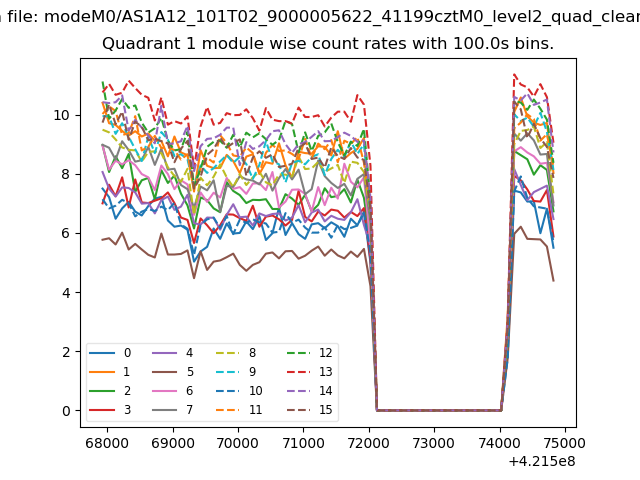
| Module-wise count rates for Quadrant A Data is divided into 100 sec bins |
 |
 |
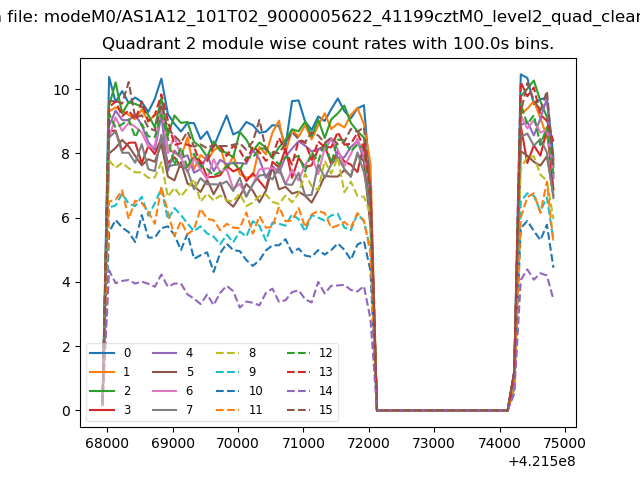
| Module-wise count rates for Quadrant B Data is divided into 100 sec bins |
 |
 |
| Module-wise count rates for Quadrant C Data is divided into 100 sec bins |
 |
 |
| Module-wise count rates for Quadrant D Data is divided into 100 sec bins |
 |
 |
| Parameter | Plot |
|---|---|
| CZT HV Monitor | 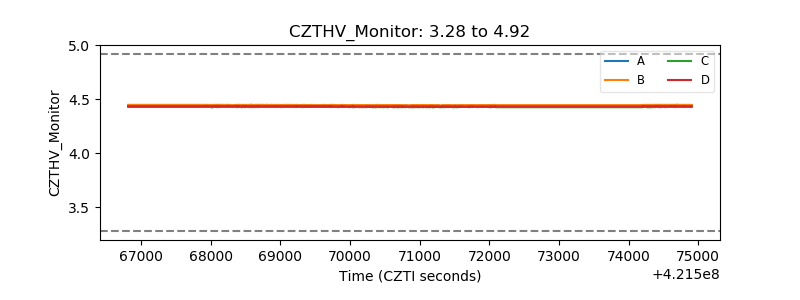 |
| D_VDD | 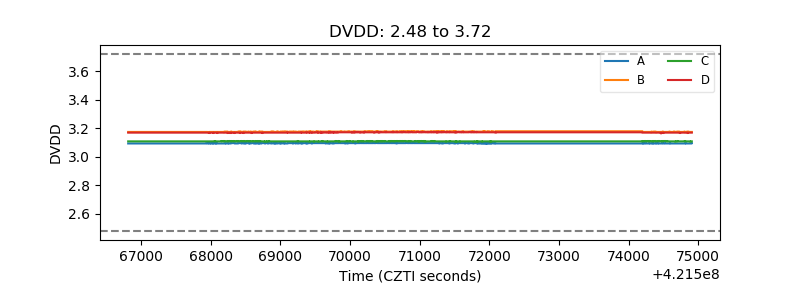 |
| Temperature 1 | 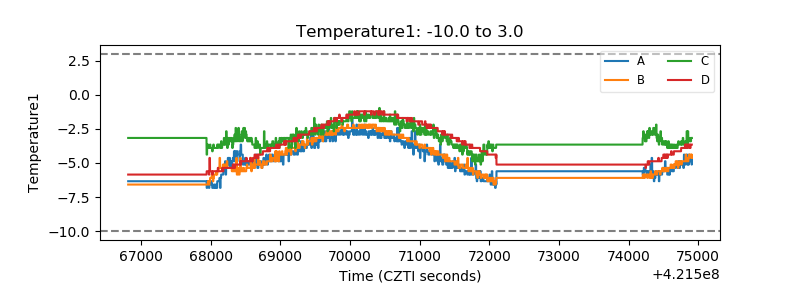 |
| Veto HV Monitor | 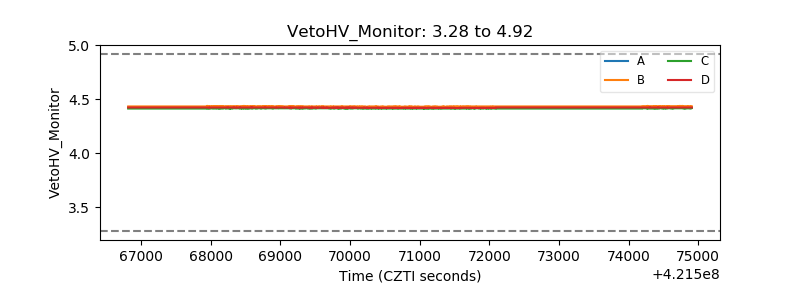 |
| Veto LLD | 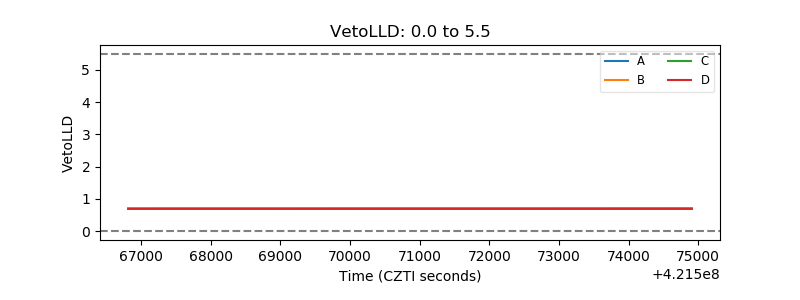 |
| Alpha Counter | 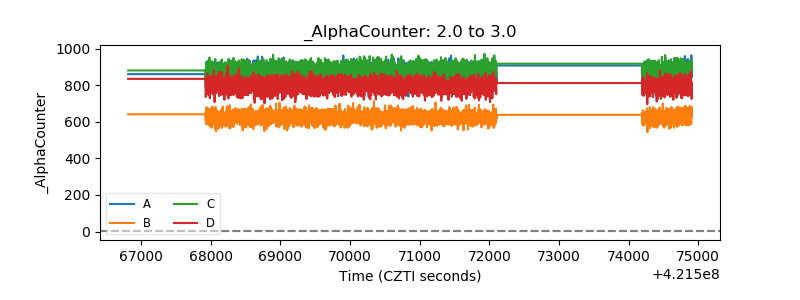 |
| _CPM_Rate | 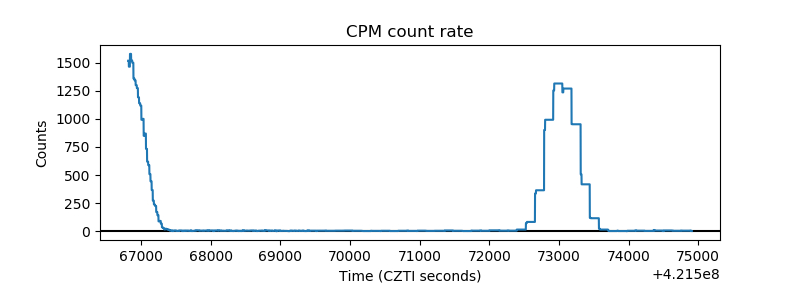 |
| CZT Counter | 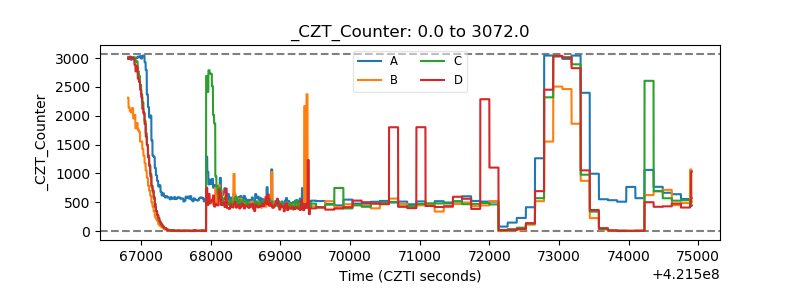 |
| +2.5 Volts monitor | 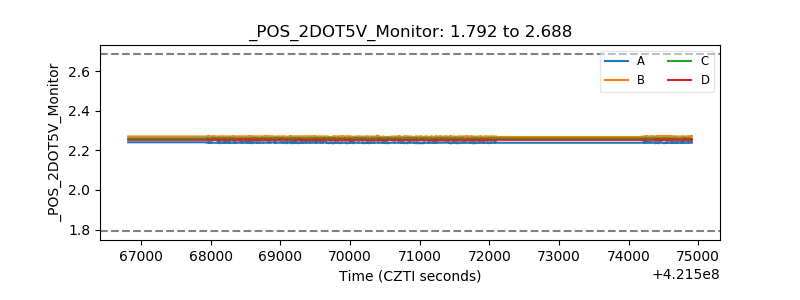 |
| +5 Volts monitor | 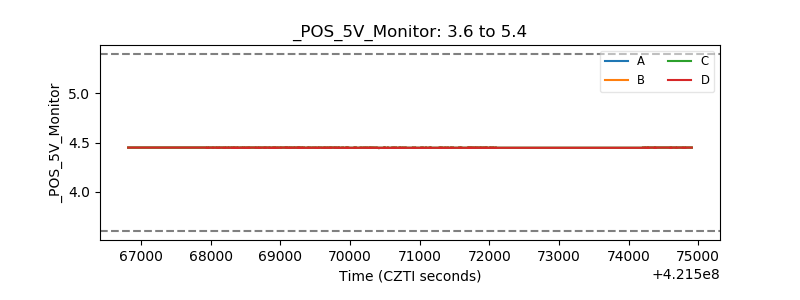 |
| _ROLL_ROT | 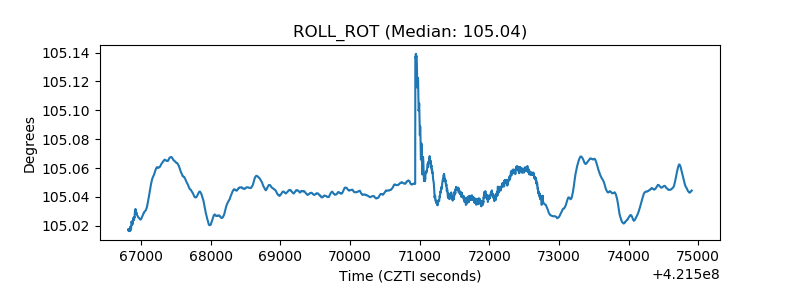 |
| _Roll_DEC | 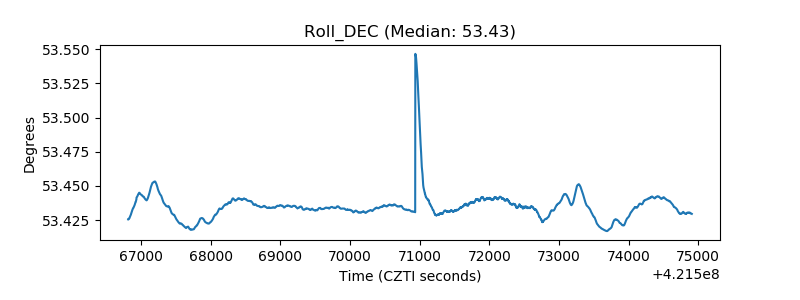 |
| _Roll_RA | 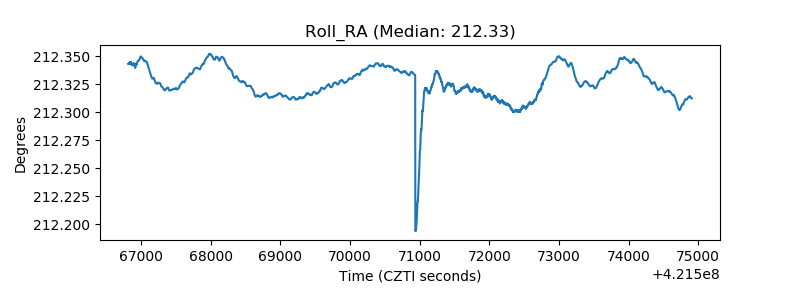 |
| Veto Counter | 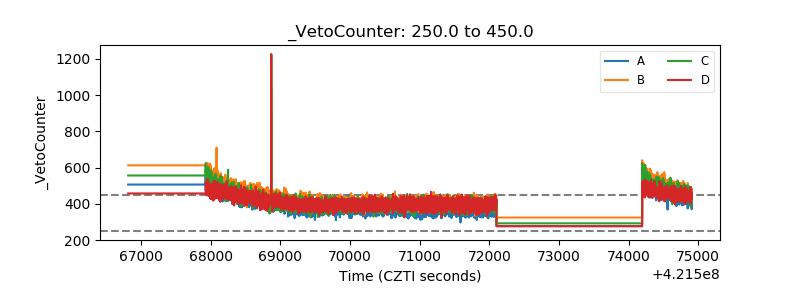 |