| Param | Original file | Final file |
|---|---|---|
| Filename | modeM0/AS1A12_101T02_9000005622_41200cztM0_level2.fits | modeM0/AS1A12_101T02_9000005622_41200cztM0_level2_quad_clean.evt |
| Size (bytes) | 306,129,600 | 87,647,040 |
| Size | 291.9 MB | 83.6 MB |
| Events in quadrant A | 2,702,436 | 609,313 |
| Events in quadrant B | 2,426,849 | 626,551 |
| Events in quadrant C | 2,978,554 | 548,673 |
| Events in quadrant D | 2,844,170 | 527,438 |
| Mode M9 | |||
|---|---|---|---|
| Quadrant | BADHDUFLAG | Total packets | Discarded packets |
| A | 0 | 30 | 0 |
| B | 0 | 30 | 0 |
| C | 0 | 30 | 0 |
| D | 0 | 31 | 0 |
| Mode M0 | |||
|---|---|---|---|
| Quadrant | BADHDUFLAG | Total packets | Discarded packets |
| A | 0 | 10835 | 3 |
| B | 0 | 10354 | 2 |
| C | 0 | 11723 | 2 |
| D | 0 | 11716 | 2 |
| Mode SS | |||
|---|---|---|---|
| Quadrant | BADHDUFLAG | Total packets | Discarded packets |
| A | 0 | 102 | 0 |
| B | 0 | 102 | 0 |
| C | 0 | 102 | 0 |
| D | 0 | 102 | 0 |
| Quadrant | Total seconds | Saturated seconds | Saturation percentage |
|---|---|---|---|
| A | 4870 | 8 | 0.164271% |
| B | 4870 | 15 | 0.308008% |
| C | 4870 | 251 | 5.154004% |
| D | 4870 | 140 | 2.874743% |
Noise dominated data is calculated using 1-second bins in cleaned event files. If a bin has >2000 counts, and if more than 50% of those come from <1% of pixels, then it is considered to be noise-dominated and hence unusable.
| Quadrant | # 1 sec bins | Bins with >0 counts | Bins with >2000 counts | High rate bins dominated by noise | Noise dominated (total time) | Noise dominated (detector-on time) | Marked lightcurve |
|---|---|---|---|---|---|---|---|
| A | 7023 | 4871 | 2 | 2 | 0.03% | 0.04% |  |
| B | 7023 | 4871 | 8 | 8 | 0.11% | 0.16% |  |
| C | 7023 | 4871 | 252 | 252 | 3.59% | 5.17% | 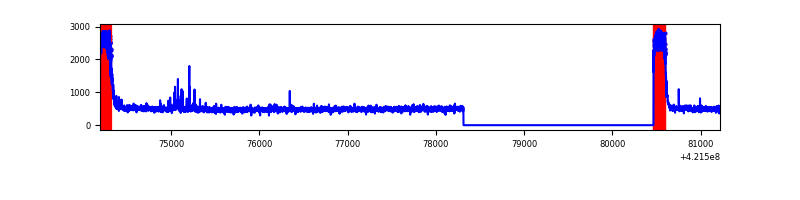 |
| D | 7023 | 4871 | 143 | 143 | 2.04% | 2.94% | 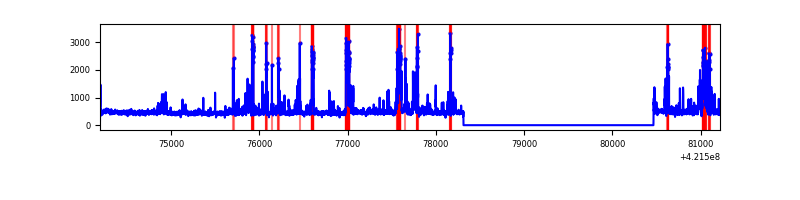 |
Top three noisy pixels from each quadrant. If the there are fewer than three noisy pixels in the level2.evt file, extra rows are filled as -1
| Pixel properties | Quadrant properties | ||||||
|---|---|---|---|---|---|---|---|
| Quadrant | DetID | PixID | Counts | Sigma | Mean | Median | Sigma |
| A | 10 | 83 | 482173 | 4219.56 | 567 | 559 | 114.1 |
| A | 12 | 189 | 16785 | 142.16 | 567 | 559 | 114.1 |
| A | 13 | 254 | 8761 | 71.86 | 567 | 559 | 114.1 |
| B | 5 | 255 | 123534 | 1152.73 | 560 | 546 | 106.7 |
| B | 0 | 229 | 49755 | 461.22 | 560 | 546 | 106.7 |
| B | 0 | 190 | 46079 | 426.77 | 560 | 546 | 106.7 |
| C | 0 | 10 | 675171 | 5602.73 | 527 | 531 | 120.4 |
| C | 15 | 214 | 204074 | 1690.38 | 527 | 531 | 120.4 |
| C | 14 | 254 | 33740 | 275.79 | 527 | 531 | 120.4 |
| D | 13 | 249 | 270411 | 2064.57 | 542 | 528 | 130.7 |
| D | 2 | 249 | 223709 | 1707.31 | 542 | 528 | 130.7 |
| D | 12 | 16 | 143715 | 1095.36 | 542 | 528 | 130.7 |
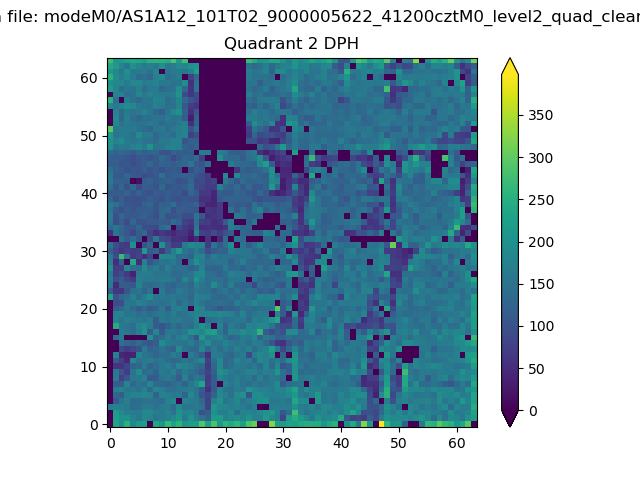
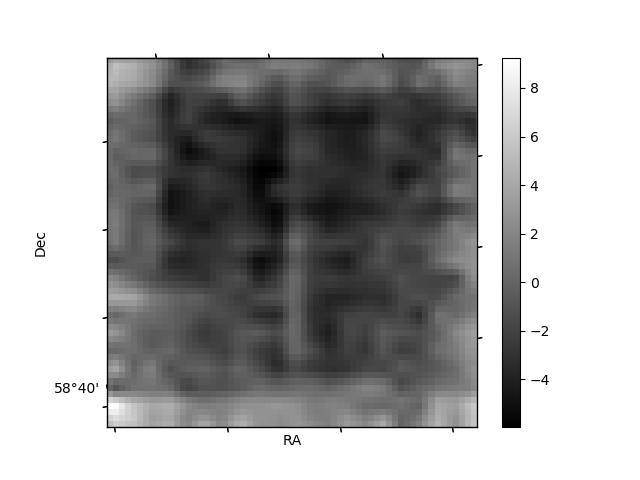
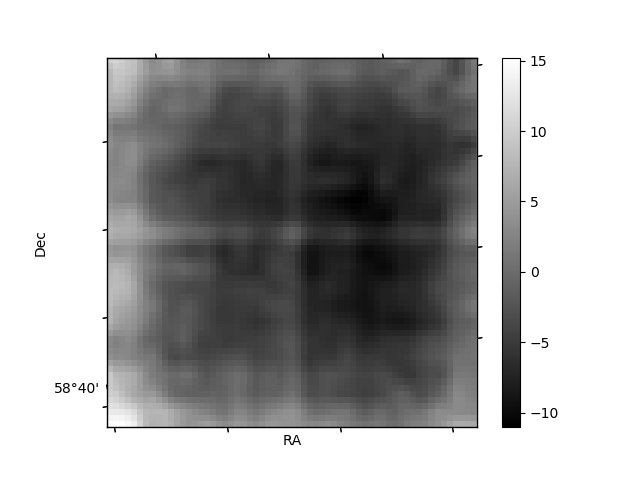
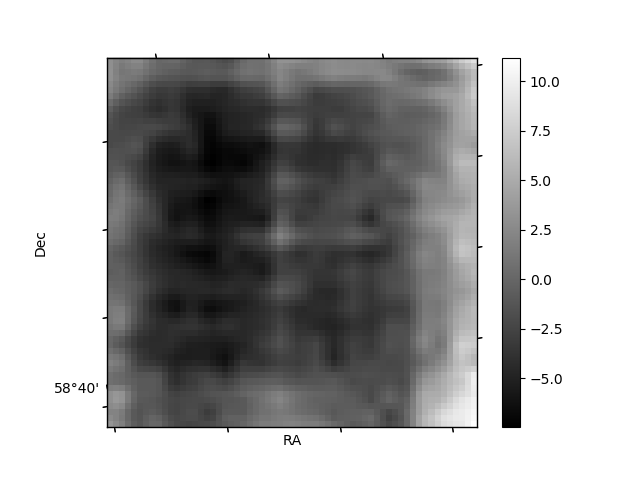
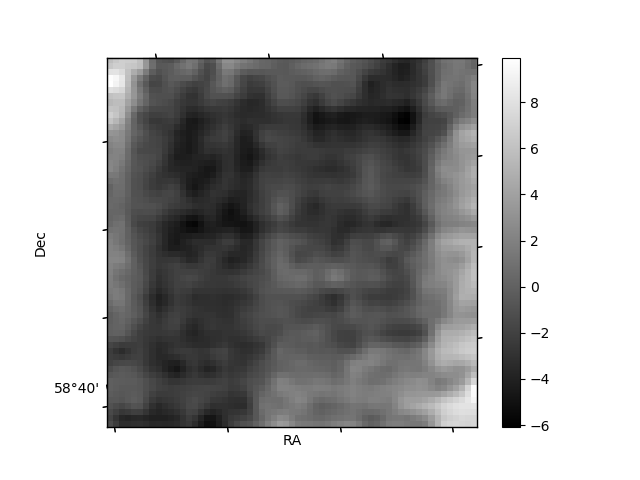
Histogram calculated using DETX and DETY for each event in the final _common_clean file
| Quadrant A | 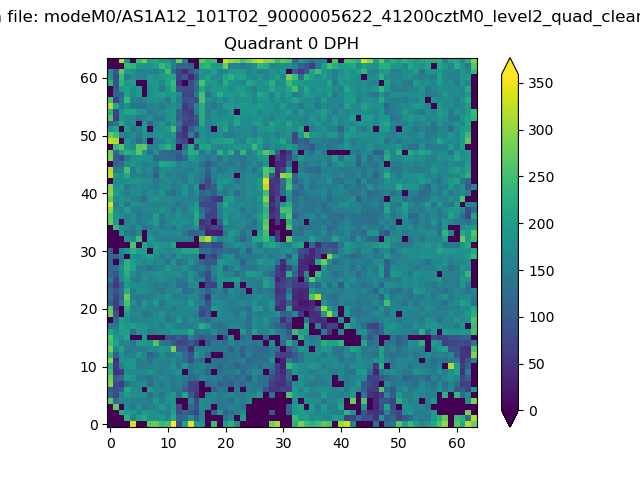 |
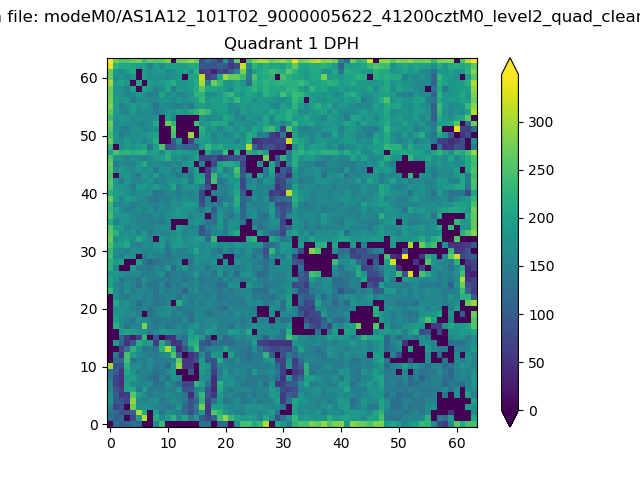 |
Quadrant B |
|---|---|---|---|
| Quadrant D | 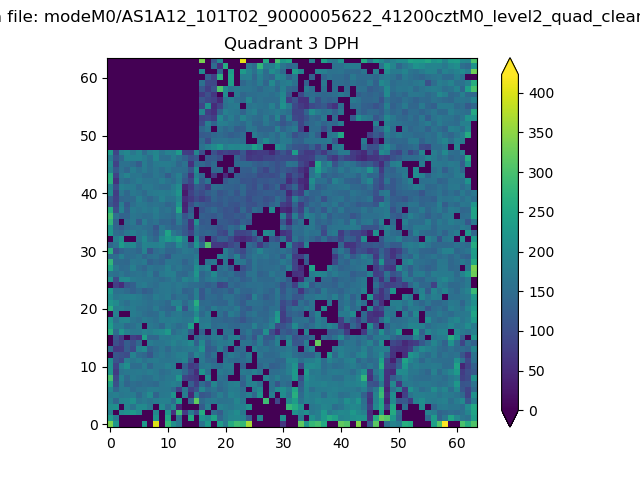 |
 |
Quadrant C |
| Plot type | Count rate plots | Images |
|---|---|---|
| Comparison with Poisson distribution Blue bars denote a histogram of data divided into 1 sec bins. Red curve is a Poisson curve with rate = median count rate of data. |
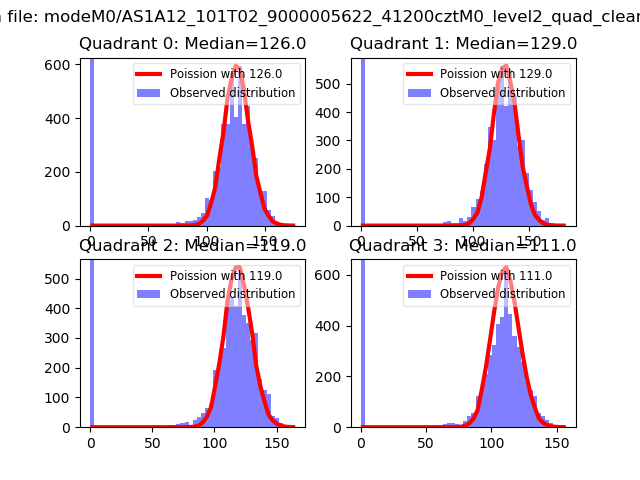 |
 |
| Quadrant-wise count rates Data is divided into 100 sec bins |
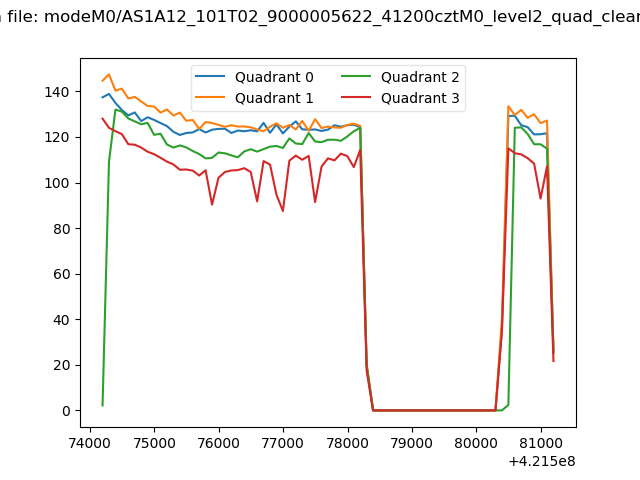 |
|
| Module-wise count rates for Quadrant A Data is divided into 100 sec bins |
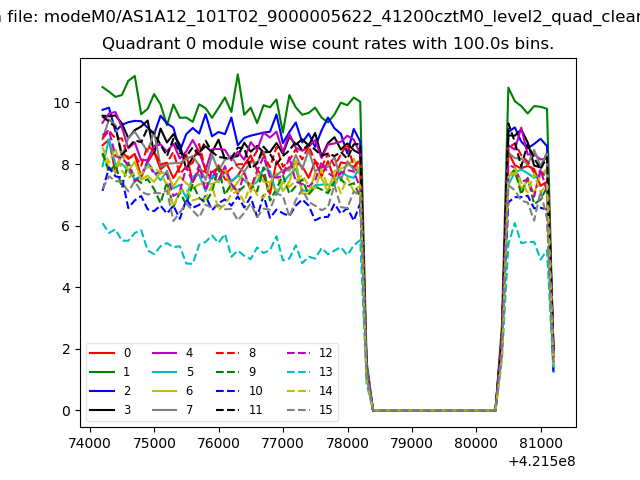 |
 |
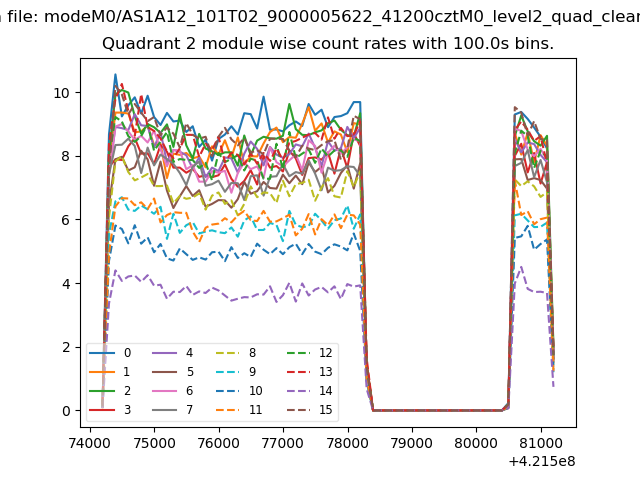
| Module-wise count rates for Quadrant B Data is divided into 100 sec bins |
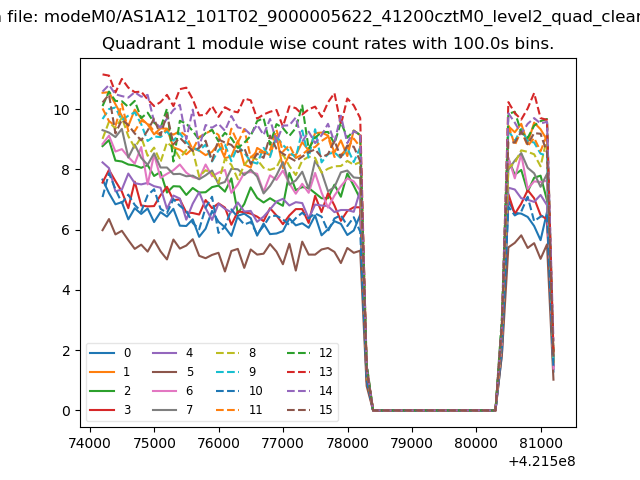 |
 |
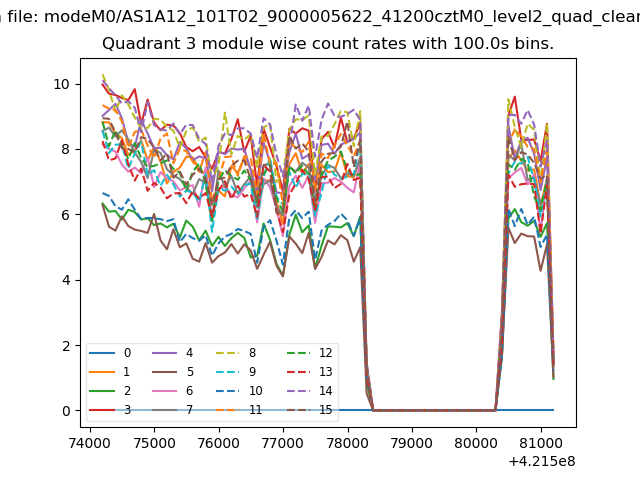
| Module-wise count rates for Quadrant C Data is divided into 100 sec bins |
 |
 |
| Module-wise count rates for Quadrant D Data is divided into 100 sec bins |
 |
 |
| Parameter | Plot |
|---|---|
| CZT HV Monitor | 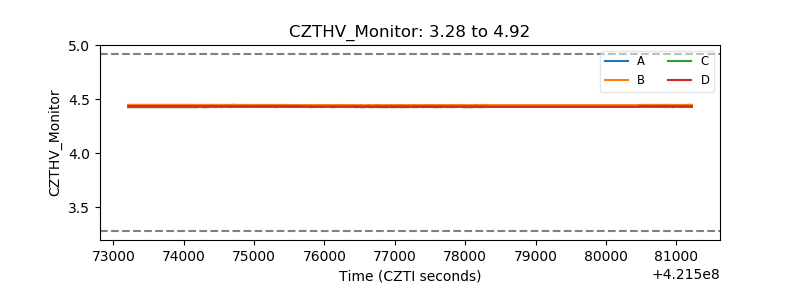 |
| D_VDD | 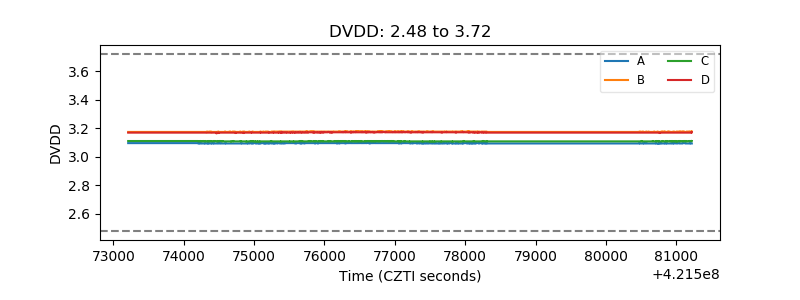 |
| Temperature 1 | 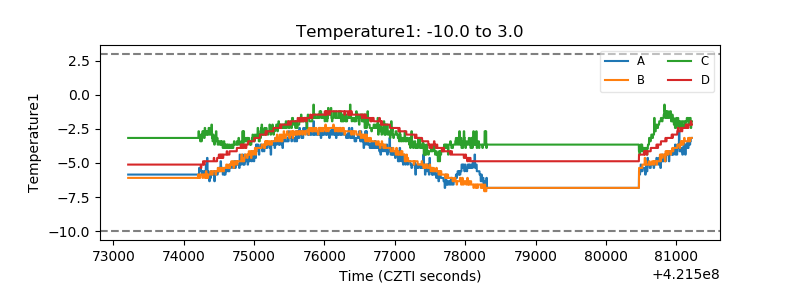 |
| Veto HV Monitor | 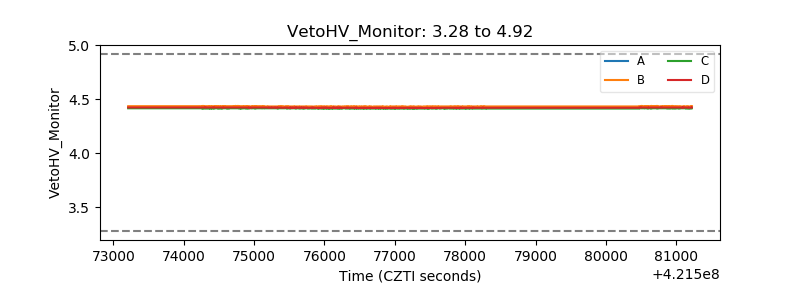 |
| Veto LLD | 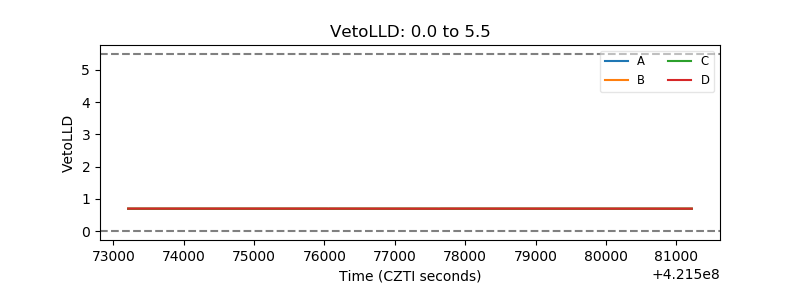 |
| Alpha Counter | 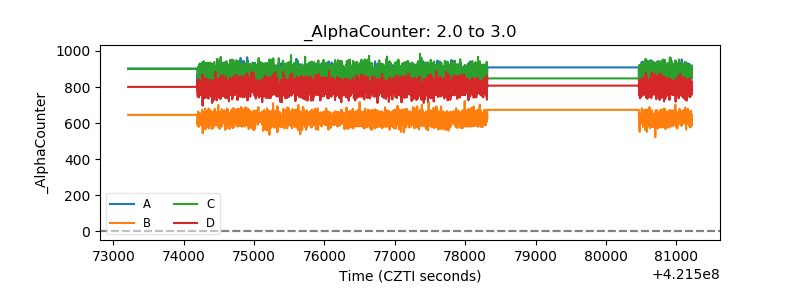 |
| _CPM_Rate |  |
| CZT Counter | 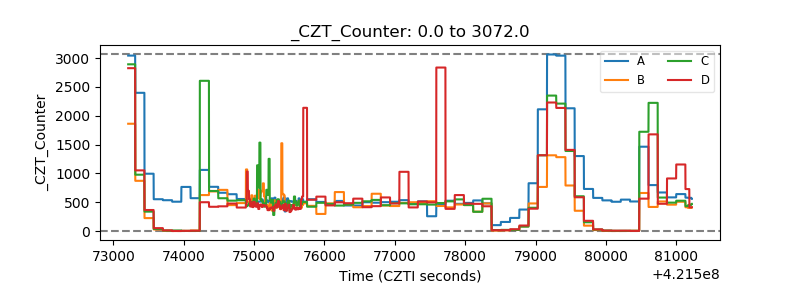 |
| +2.5 Volts monitor | 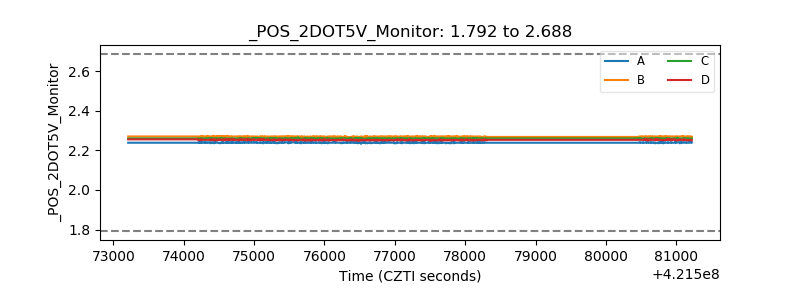 |
| +5 Volts monitor | 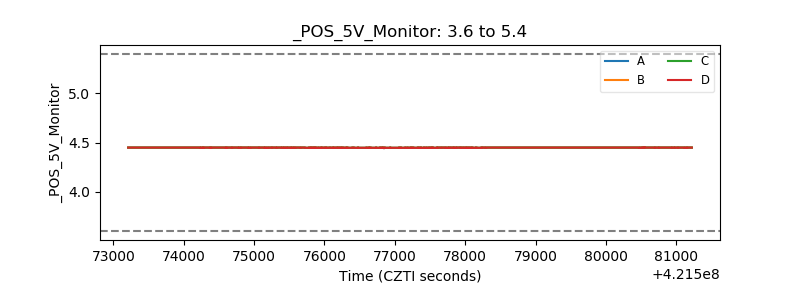 |
| _ROLL_ROT | 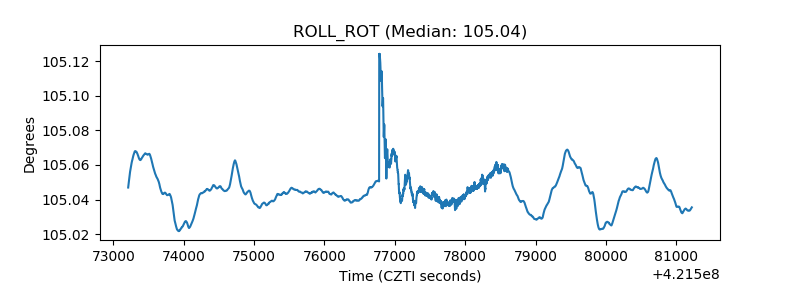 |
| _Roll_DEC | 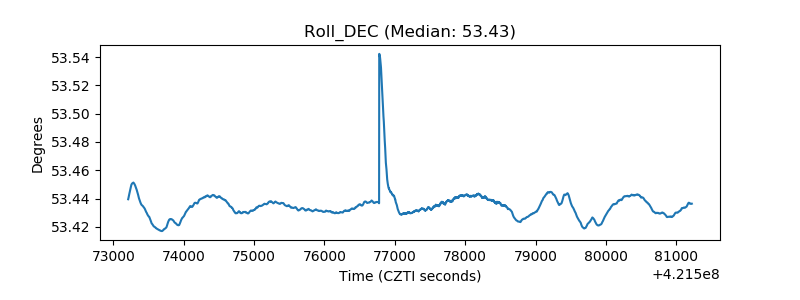 |
| _Roll_RA | 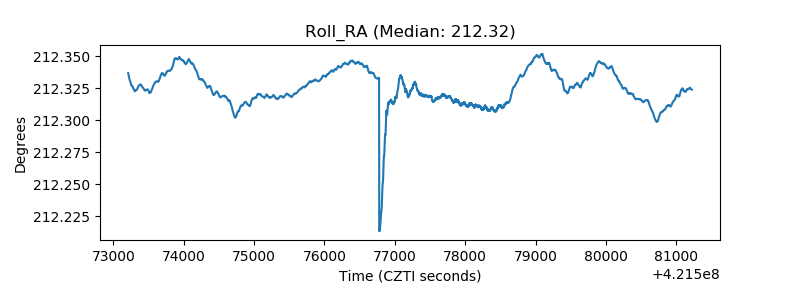 |
| Veto Counter | 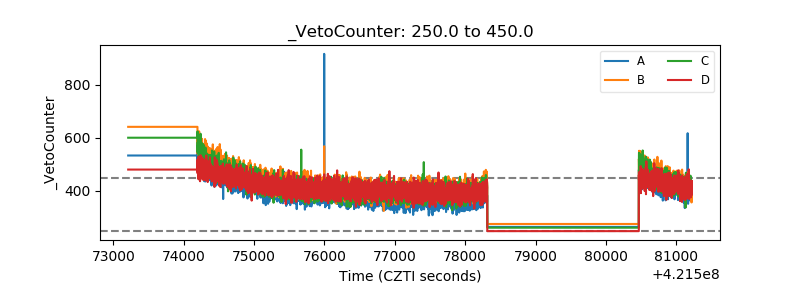 |