| Param | Original file | Final file |
|---|---|---|
| Filename | modeM0/AS1A12_101T02_9000005622_41201cztM0_level2.fits | modeM0/AS1A12_101T02_9000005622_41201cztM0_level2_quad_clean.evt |
| Size (bytes) | 372,588,480 | 94,752,000 |
| Size | 355.3 MB | 90.4 MB |
| Events in quadrant A | 2,995,528 | 659,491 |
| Events in quadrant B | 3,067,583 | 667,415 |
| Events in quadrant C | 3,236,604 | 603,831 |
| Events in quadrant D | 4,060,384 | 550,428 |
| Mode M9 | |||
|---|---|---|---|
| Quadrant | BADHDUFLAG | Total packets | Discarded packets |
| A | 0 | 42 | 0 |
| B | 0 | 42 | 0 |
| C | 0 | 42 | 0 |
| D | 0 | 42 | 0 |
| Mode M0 | |||
|---|---|---|---|
| Quadrant | BADHDUFLAG | Total packets | Discarded packets |
| A | 0 | 12129 | 3 |
| B | 0 | 12849 | 2 |
| C | 0 | 12943 | 2 |
| D | 0 | 15893 | 2 |
| Mode SS | |||
|---|---|---|---|
| Quadrant | BADHDUFLAG | Total packets | Discarded packets |
| A | 0 | 116 | 0 |
| B | 0 | 116 | 0 |
| C | 0 | 116 | 0 |
| D | 0 | 116 | 0 |
| Quadrant | Total seconds | Saturated seconds | Saturation percentage |
|---|---|---|---|
| A | 5545 | 14 | 0.252480% |
| B | 5545 | 102 | 1.839495% |
| C | 5545 | 252 | 4.544635% |
| D | 5545 | 427 | 7.700631% |
Noise dominated data is calculated using 1-second bins in cleaned event files. If a bin has >2000 counts, and if more than 50% of those come from <1% of pixels, then it is considered to be noise-dominated and hence unusable.
| Quadrant | # 1 sec bins | Bins with >0 counts | Bins with >2000 counts | High rate bins dominated by noise | Noise dominated (total time) | Noise dominated (detector-on time) | Marked lightcurve |
|---|---|---|---|---|---|---|---|
| A | 9821 | 5547 | 2 | 2 | 0.02% | 0.04% | 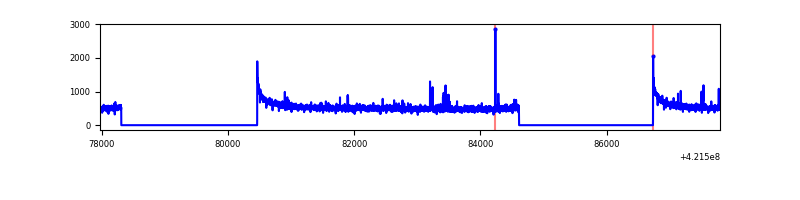 |
| B | 9821 | 5547 | 82 | 82 | 0.83% | 1.48% | 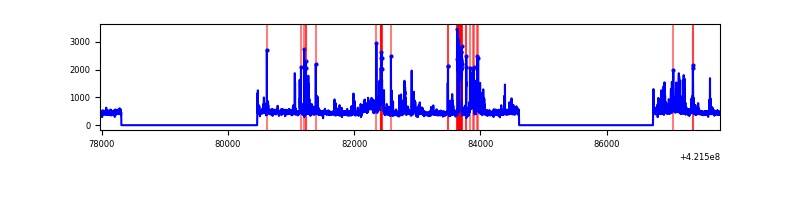 |
| C | 9821 | 5547 | 252 | 252 | 2.57% | 4.54% | 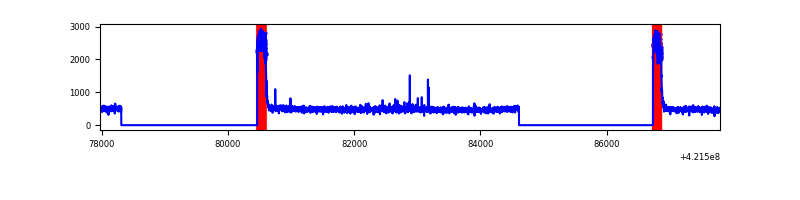 |
| D | 9821 | 5547 | 379 | 379 | 3.86% | 6.83% | 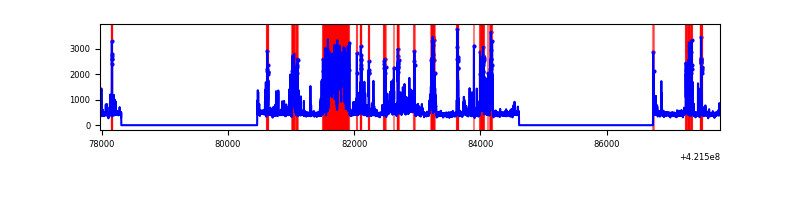 |
Top three noisy pixels from each quadrant. If the there are fewer than three noisy pixels in the level2.evt file, extra rows are filled as -1
| Pixel properties | Quadrant properties | ||||||
|---|---|---|---|---|---|---|---|
| Quadrant | DetID | PixID | Counts | Sigma | Mean | Median | Sigma |
| A | 10 | 83 | 523825 | 4149.06 | 623 | 610 | 126.1 |
| A | 7 | 3 | 21761 | 167.73 | 623 | 610 | 126.1 |
| A | 13 | 248 | 12027 | 90.54 | 623 | 610 | 126.1 |
| B | 0 | 229 | 260914 | 2214.13 | 613 | 598 | 117.6 |
| B | 5 | 255 | 242074 | 2053.89 | 613 | 598 | 117.6 |
| B | 0 | 186 | 106750 | 902.88 | 613 | 598 | 117.6 |
| C | 0 | 10 | 695913 | 5095.68 | 588 | 590 | 136.5 |
| C | 15 | 214 | 232828 | 1701.96 | 588 | 590 | 136.5 |
| C | 15 | 159 | 13492 | 94.55 | 588 | 590 | 136.5 |
| D | 12 | 16 | 893270 | 6281.73 | 586 | 571 | 142.1 |
| D | 13 | 249 | 607143 | 4268.31 | 586 | 571 | 142.1 |
| D | 2 | 249 | 136246 | 954.72 | 586 | 571 | 142.1 |
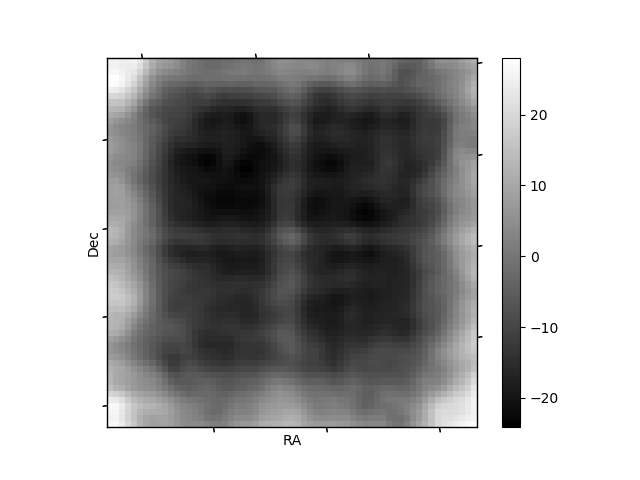
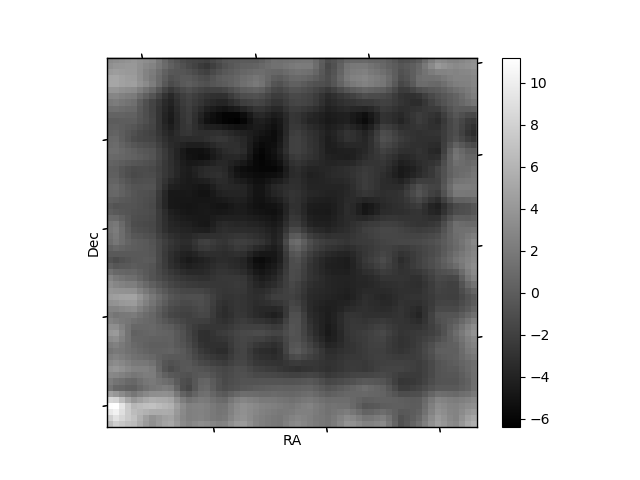
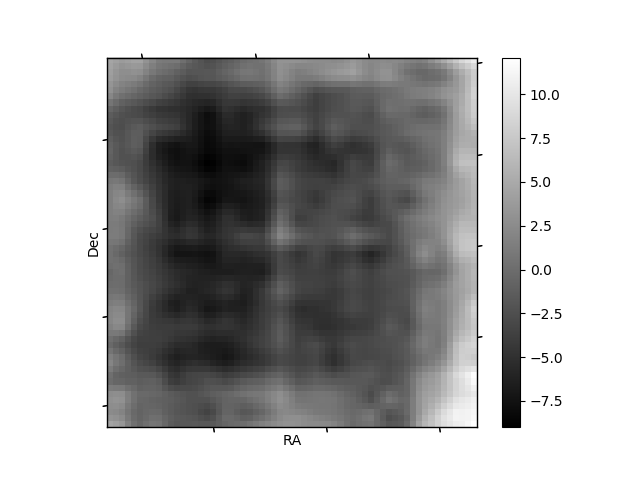
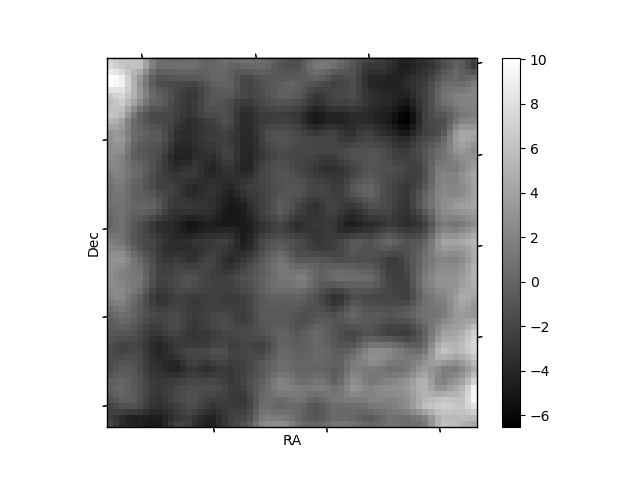
Histogram calculated using DETX and DETY for each event in the final _common_clean file
| Quadrant A | 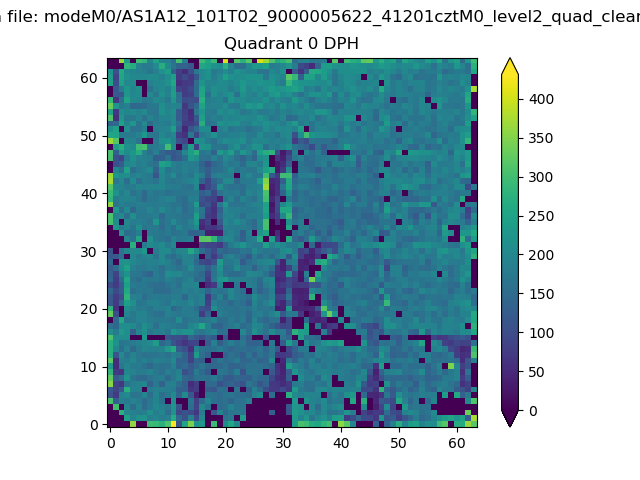 |
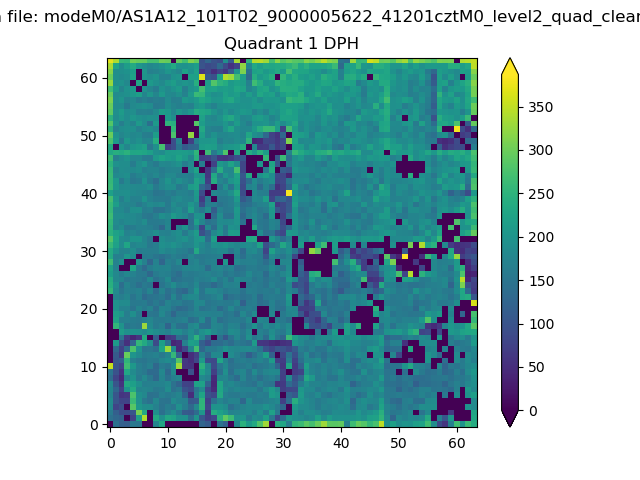 |
Quadrant B |
|---|---|---|---|
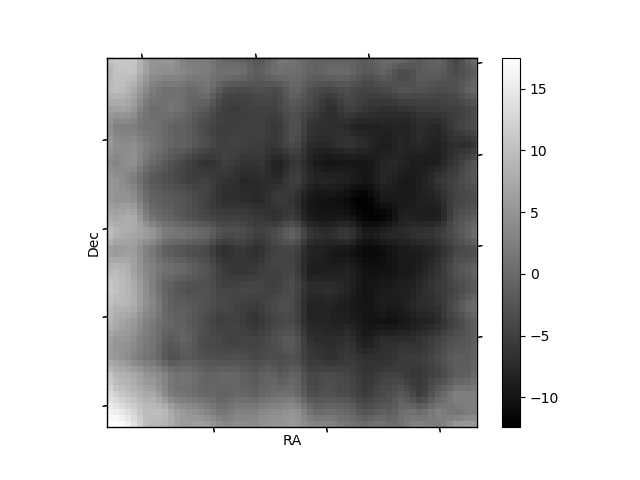
| Quadrant D | 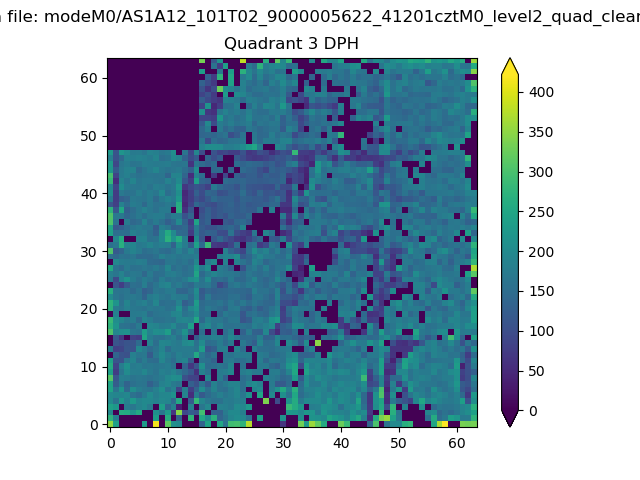 |
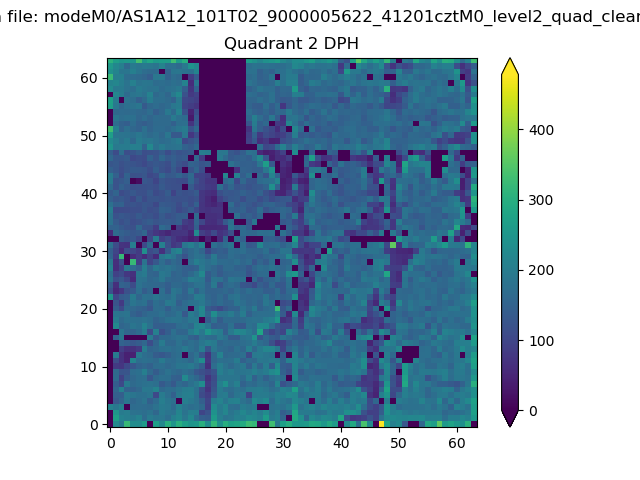 |
Quadrant C |
| Plot type | Count rate plots | Images |
|---|---|---|
| Comparison with Poisson distribution Blue bars denote a histogram of data divided into 1 sec bins. Red curve is a Poisson curve with rate = median count rate of data. |
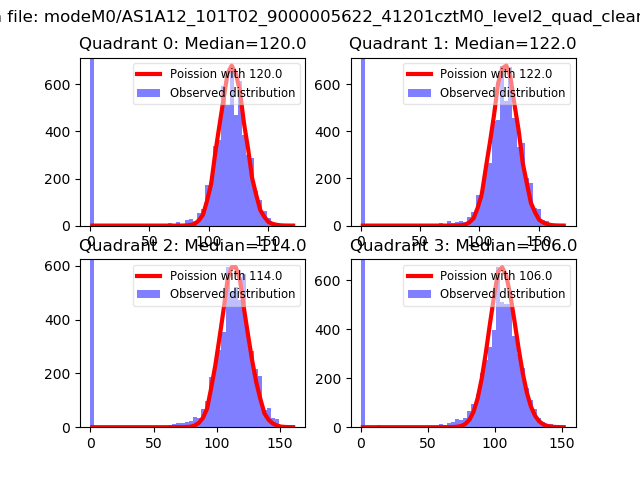 |
 |
| Quadrant-wise count rates Data is divided into 100 sec bins |
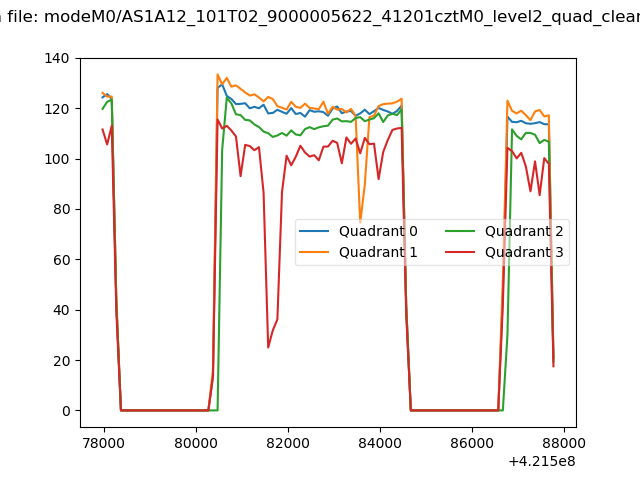 |
|
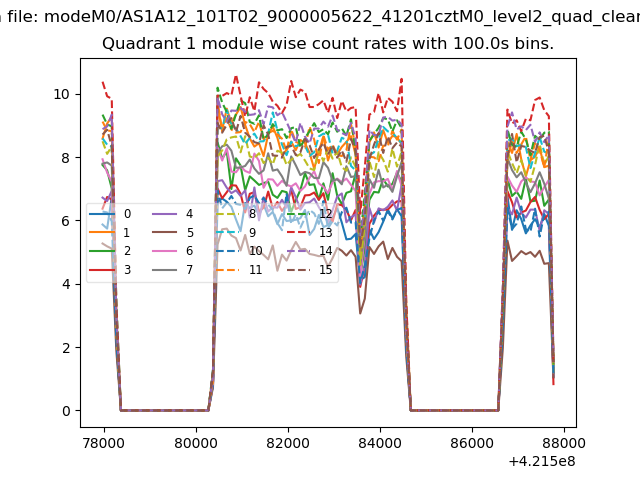
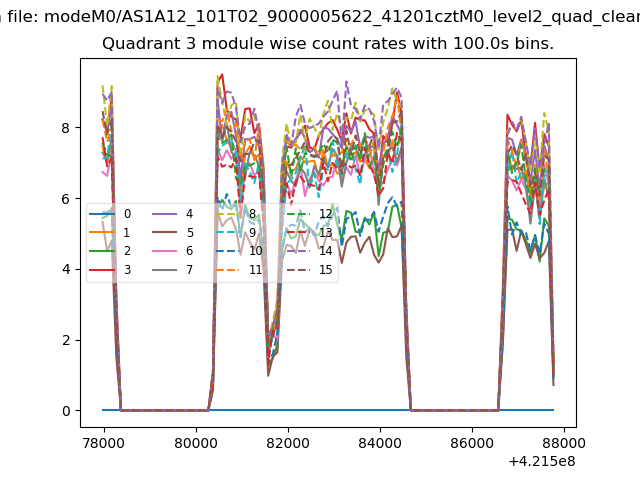
| Module-wise count rates for Quadrant A Data is divided into 100 sec bins |
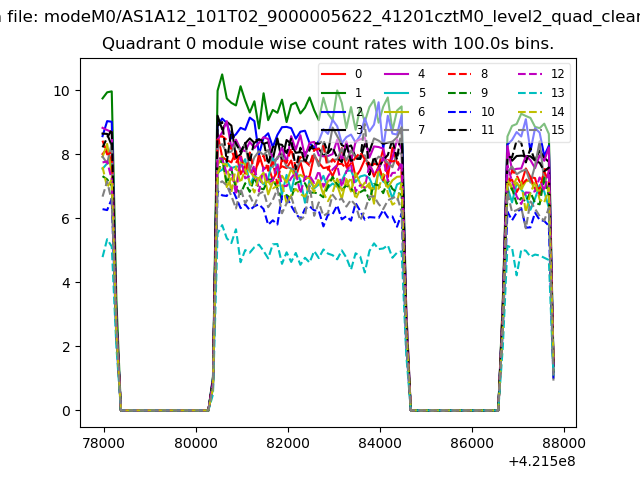 |
 |
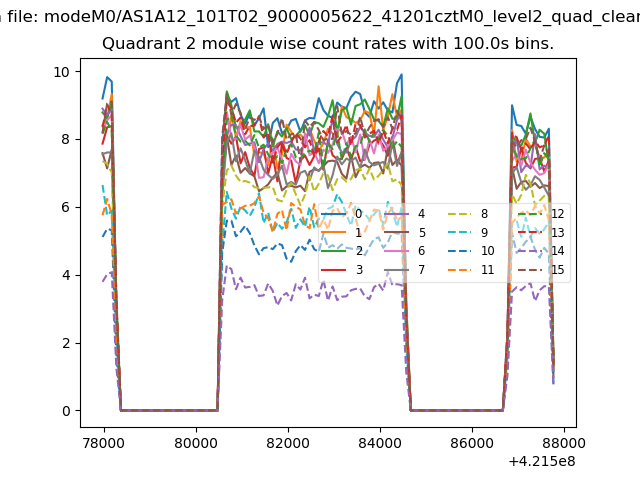
| Module-wise count rates for Quadrant B Data is divided into 100 sec bins |
 |
 |
| Module-wise count rates for Quadrant C Data is divided into 100 sec bins |
 |
 |
| Module-wise count rates for Quadrant D Data is divided into 100 sec bins |
 |
 |
| Parameter | Plot |
|---|---|
| CZT HV Monitor | 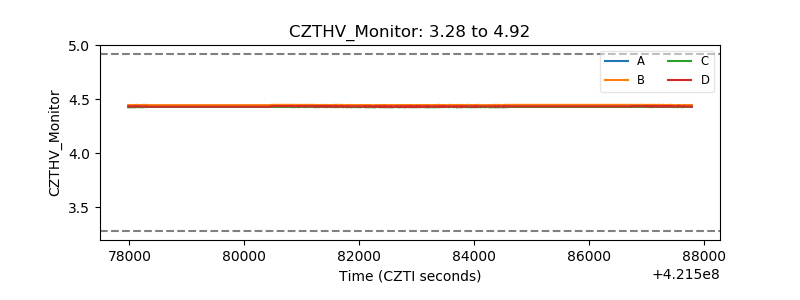 |
| D_VDD | 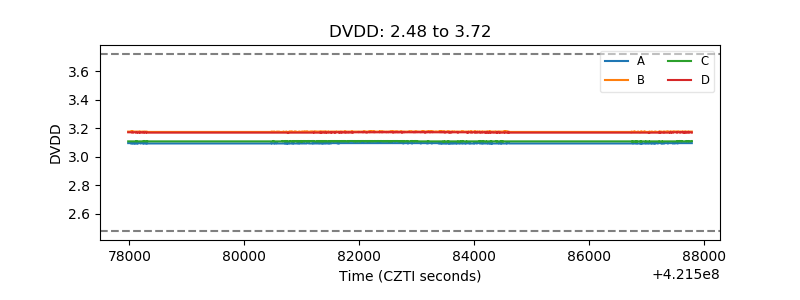 |
| Temperature 1 | 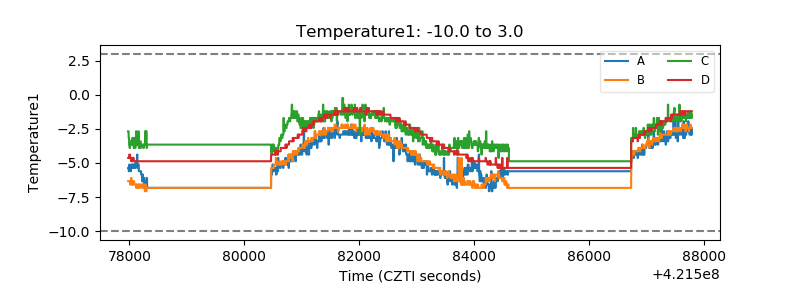 |
| Veto HV Monitor | 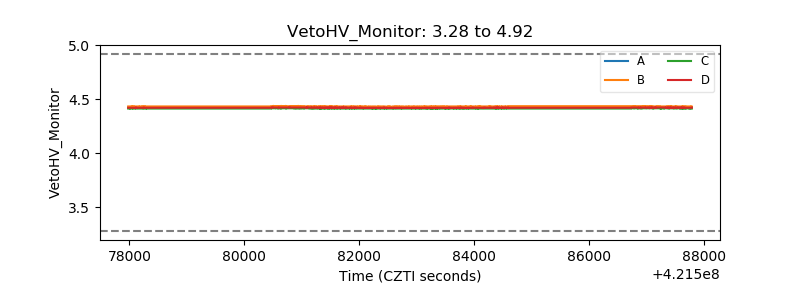 |
| Veto LLD | 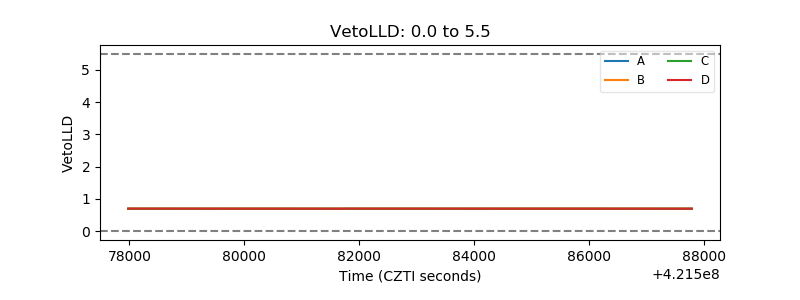 |
| Alpha Counter | 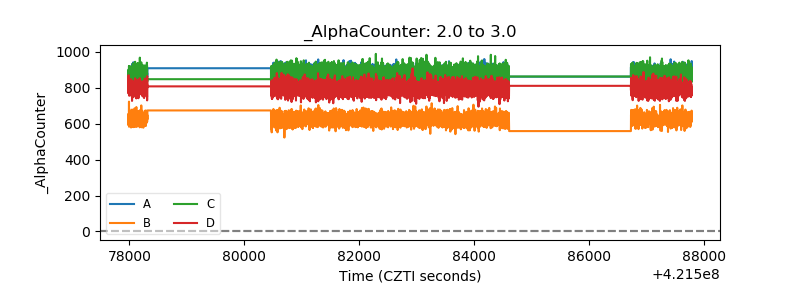 |
| _CPM_Rate | 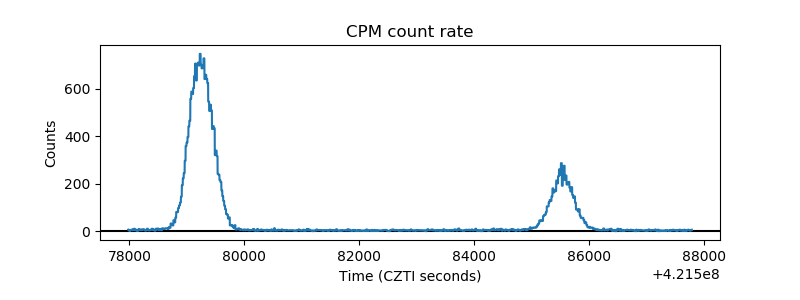 |
| CZT Counter | 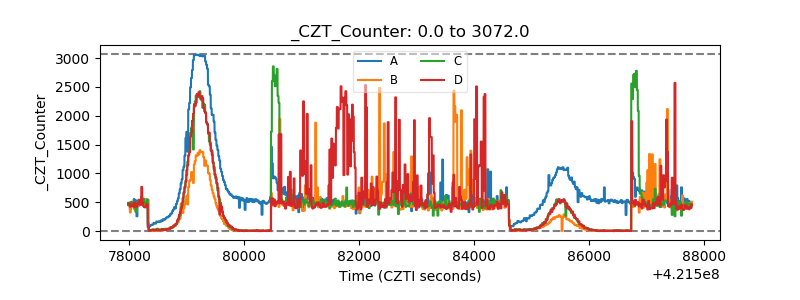 |
| +2.5 Volts monitor | 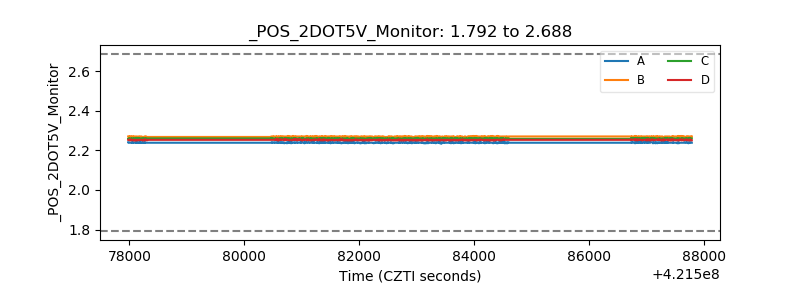 |
| +5 Volts monitor | 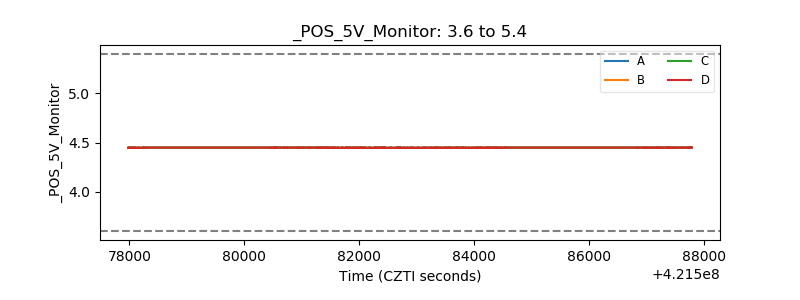 |
| _ROLL_ROT |  |
| _Roll_DEC | 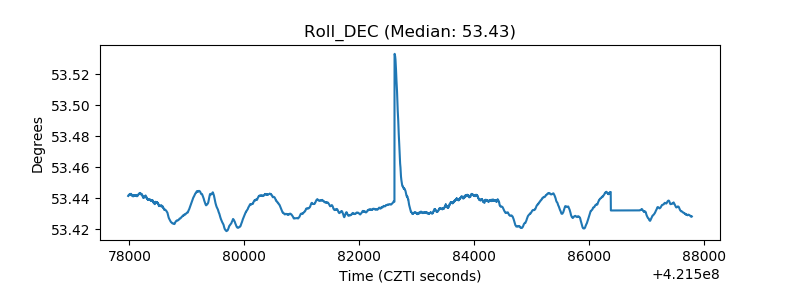 |
| _Roll_RA | 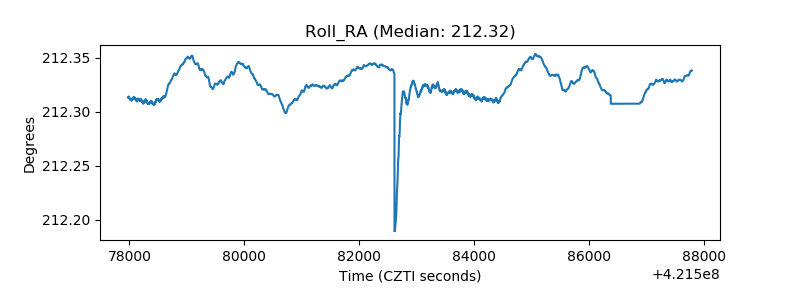 |
| Veto Counter | 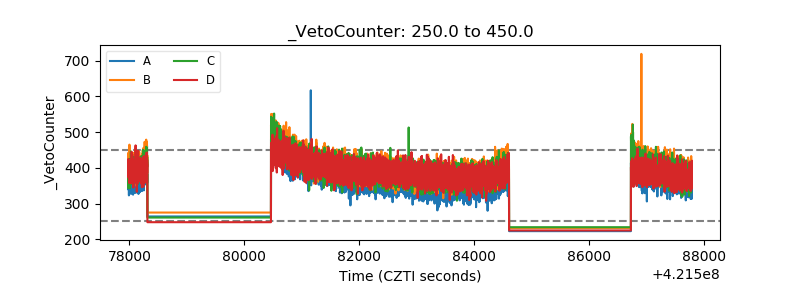 |