| Param | Original file | Final file |
|---|---|---|
| Filename | modeM0/AS1A12_101T02_9000005622_41202cztM0_level2.fits | modeM0/AS1A12_101T02_9000005622_41202cztM0_level2_quad_clean.evt |
| Size (bytes) | 191,934,720 | 56,517,120 |
| Size | 183.0 MB | 53.9 MB |
| Events in quadrant A | 1,662,304 | 383,180 |
| Events in quadrant B | 1,751,613 | 387,689 |
| Events in quadrant C | 1,537,298 | 366,421 |
| Events in quadrant D | 1,889,055 | 334,782 |
| Mode M0 | |||
|---|---|---|---|
| Quadrant | BADHDUFLAG | Total packets | Discarded packets |
| A | 0 | 6991 | 0 |
| B | 0 | 7676 | 0 |
| C | 0 | 6778 | 0 |
| D | 0 | 8124 | 0 |
| Mode SS | |||
|---|---|---|---|
| Quadrant | BADHDUFLAG | Total packets | Discarded packets |
| A | 0 | 68 | 0 |
| B | 0 | 68 | 0 |
| C | 0 | 68 | 0 |
| D | 0 | 68 | 0 |
| Quadrant | Total seconds | Saturated seconds | Saturation percentage |
|---|---|---|---|
| A | 3374 | 3 | 0.088915% |
| B | 3374 | 41 | 1.215175% |
| C | 3374 | 0 | 0.000000% |
| D | 3374 | 86 | 2.548903% |
Noise dominated data is calculated using 1-second bins in cleaned event files. If a bin has >2000 counts, and if more than 50% of those come from <1% of pixels, then it is considered to be noise-dominated and hence unusable.
| Quadrant | # 1 sec bins | Bins with >0 counts | Bins with >2000 counts | High rate bins dominated by noise | Noise dominated (total time) | Noise dominated (detector-on time) | Marked lightcurve |
|---|---|---|---|---|---|---|---|
| A | 3374 | 3374 | 1 | 1 | 0.03% | 0.03% | 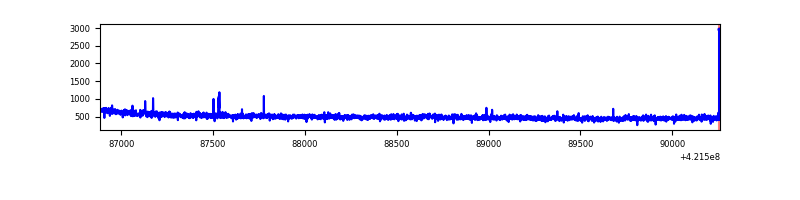 |
| B | 3374 | 3374 | 30 | 30 | 0.89% | 0.89% | 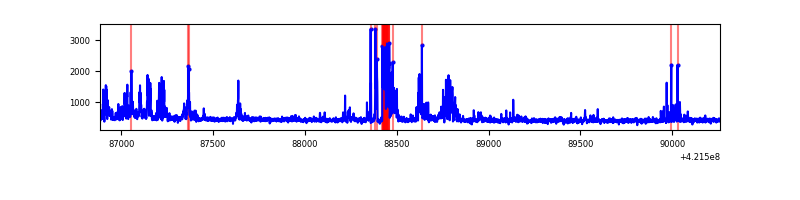 |
| C | 3374 | 3374 | 0 | 0 | 0.00% | 0.00% | 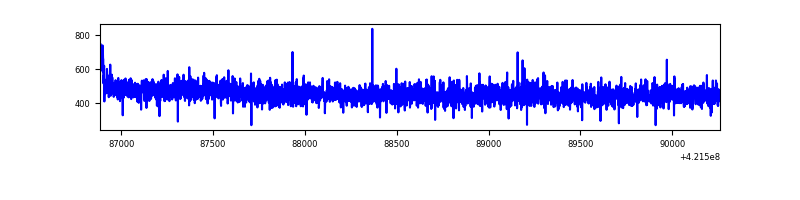 |
| D | 3374 | 3374 | 82 | 82 | 2.43% | 2.43% | 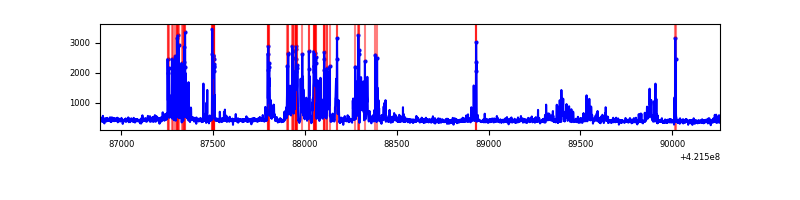 |
Top three noisy pixels from each quadrant. If the there are fewer than three noisy pixels in the level2.evt file, extra rows are filled as -1
| Pixel properties | Quadrant properties | ||||||
|---|---|---|---|---|---|---|---|
| Quadrant | DetID | PixID | Counts | Sigma | Mean | Median | Sigma |
| A | 10 | 83 | 245174 | 3295.66 | 359 | 352 | 74.3 |
| A | 13 | 6 | 7318 | 93.77 | 359 | 352 | 74.3 |
| A | 13 | 252 | 6482 | 82.52 | 359 | 352 | 74.3 |
| B | 5 | 255 | 297878 | 4317.58 | 353 | 344 | 68.9 |
| B | 4 | 170 | 36541 | 525.26 | 353 | 344 | 68.9 |
| B | 0 | 229 | 19890 | 283.64 | 353 | 344 | 68.9 |
| C | 15 | 214 | 142701 | 1732.1 | 351 | 353 | 82.2 |
| C | 0 | 10 | 22184 | 265.64 | 351 | 353 | 82.2 |
| C | 2 | 16 | 3397 | 37.04 | 351 | 353 | 82.2 |
| D | 12 | 16 | 232703 | 2729.79 | 349 | 340 | 85.1 |
| D | 13 | 249 | 158890 | 1862.64 | 349 | 340 | 85.1 |
| D | 2 | 249 | 80590 | 942.77 | 349 | 340 | 85.1 |
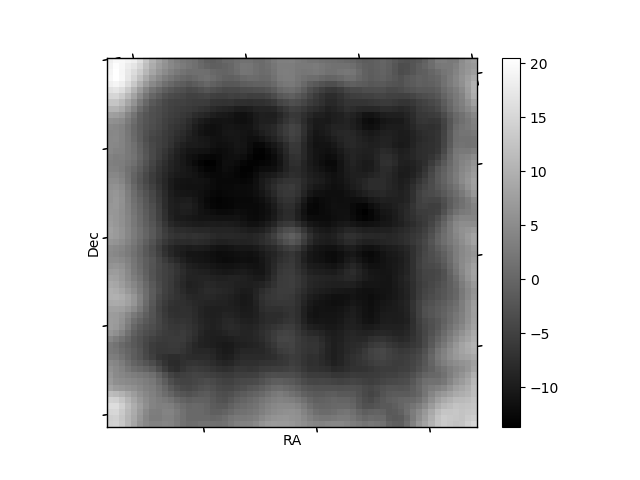
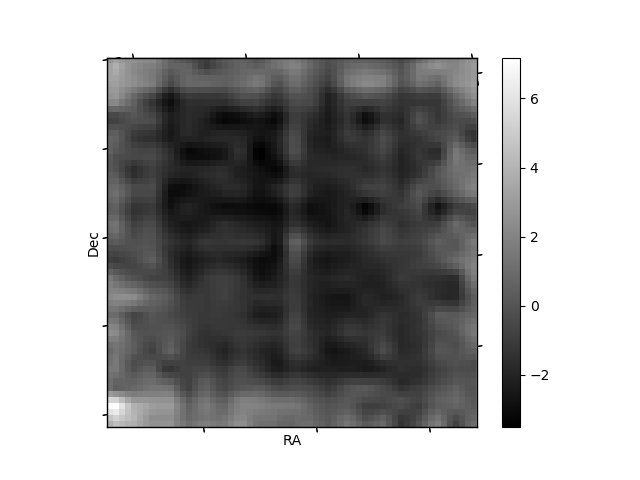
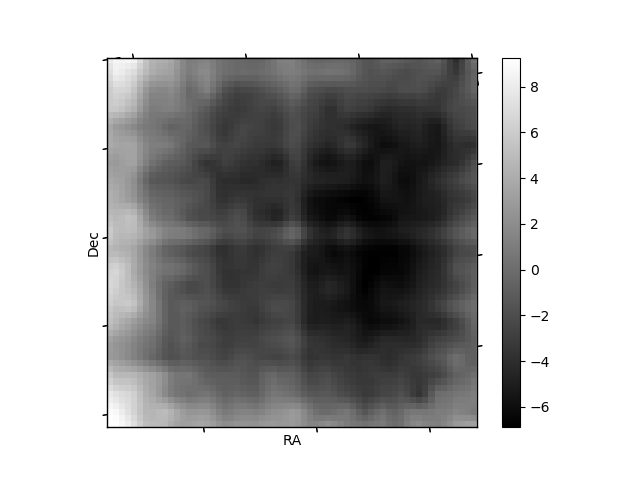
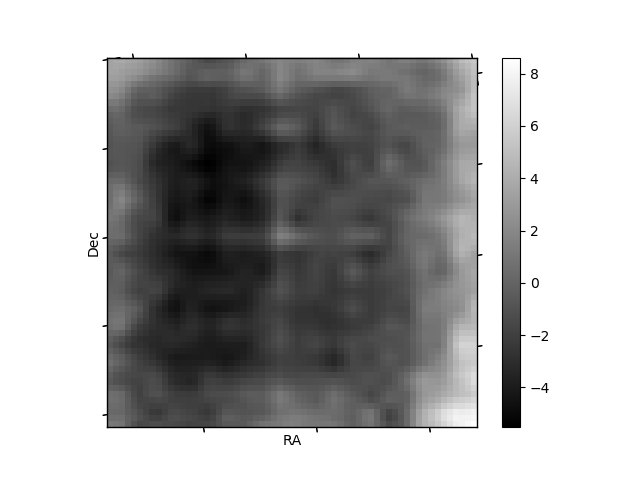
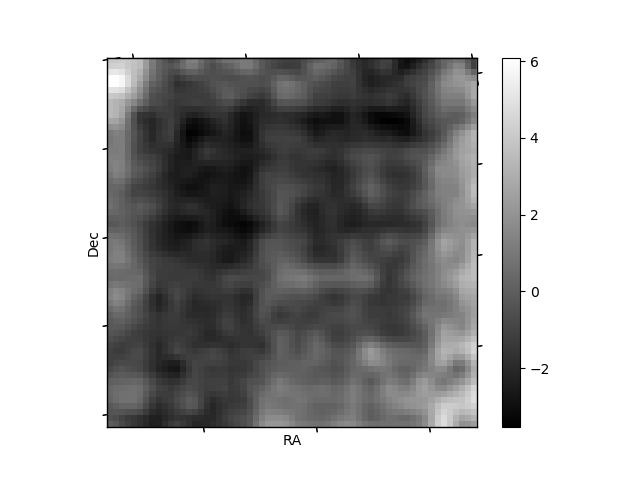
Histogram calculated using DETX and DETY for each event in the final _common_clean file
| Quadrant A | 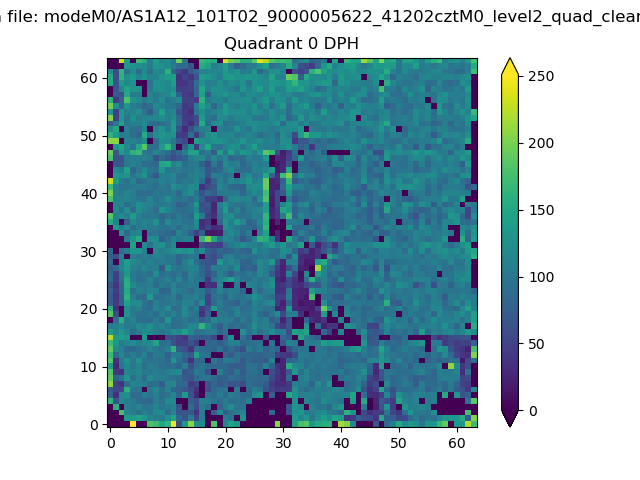 |
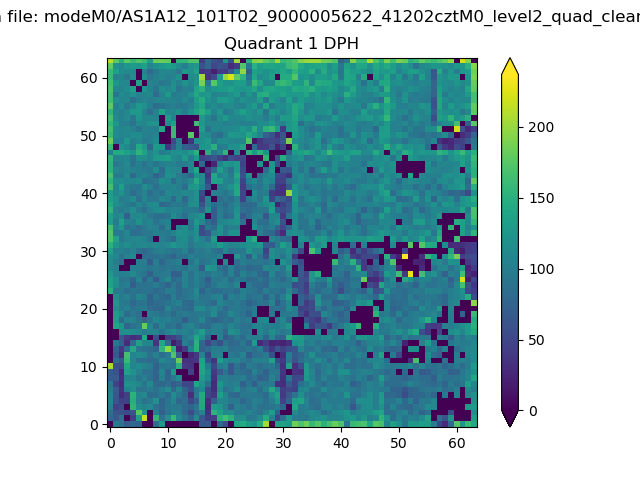 |
Quadrant B |
|---|---|---|---|
| Quadrant D | 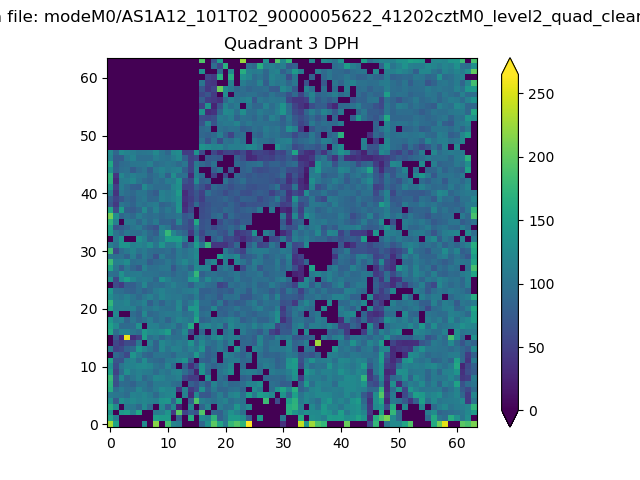 |
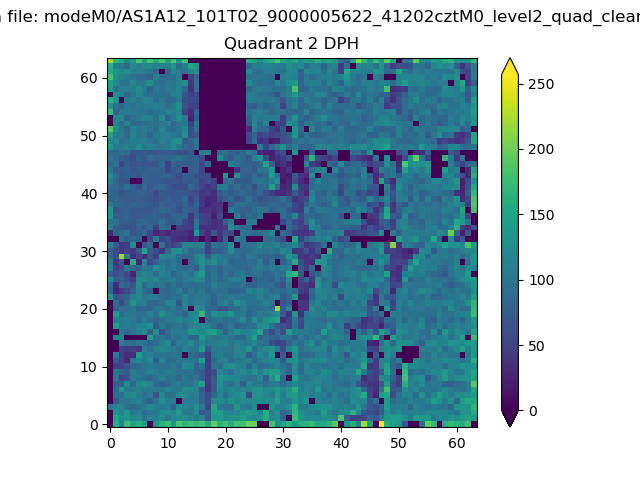 |
Quadrant C |
| Plot type | Count rate plots | Images |
|---|---|---|
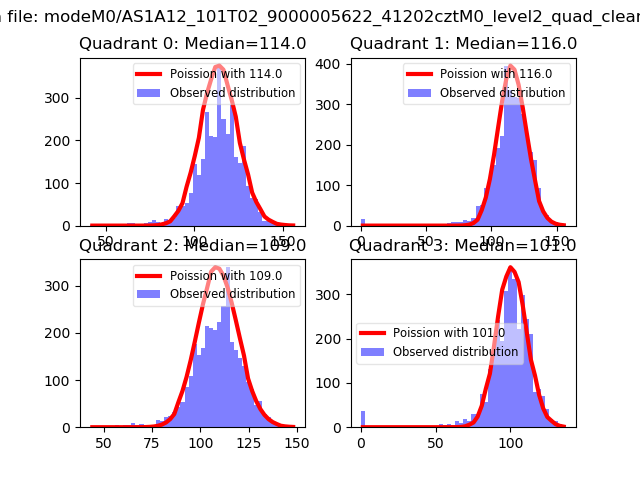
| Comparison with Poisson distribution Blue bars denote a histogram of data divided into 1 sec bins. Red curve is a Poisson curve with rate = median count rate of data. |
 |
 |
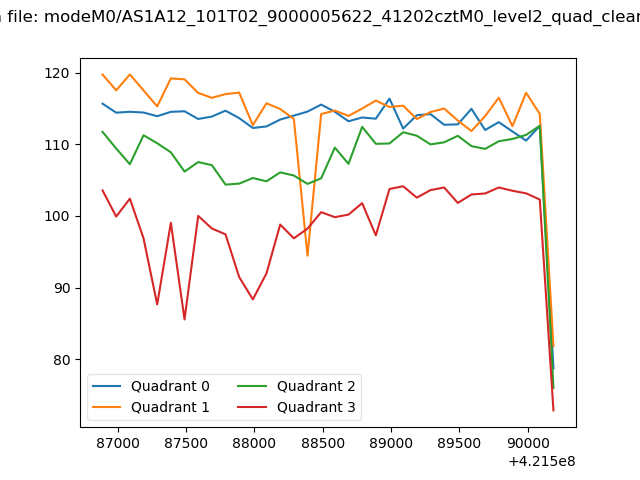
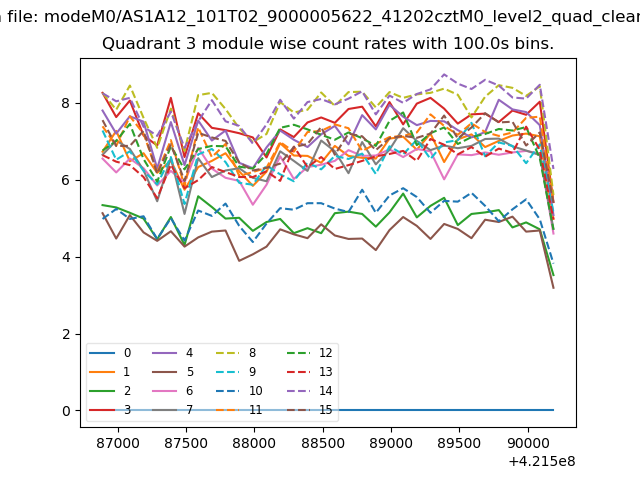
| Quadrant-wise count rates Data is divided into 100 sec bins |
 |
|
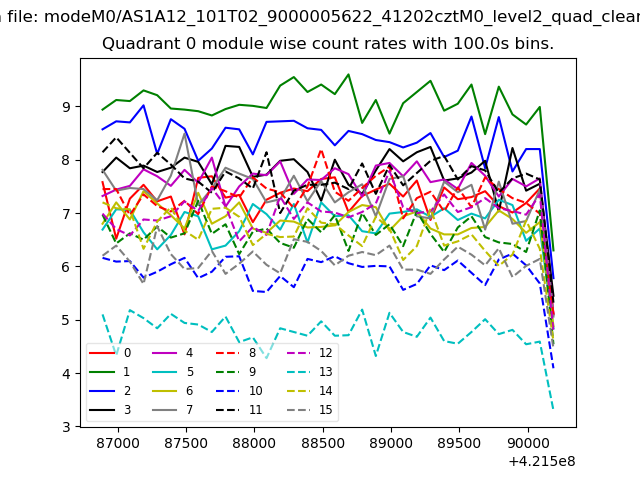
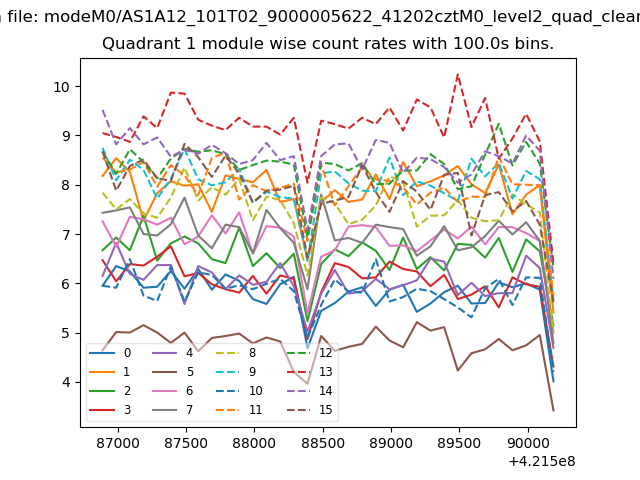
| Module-wise count rates for Quadrant A Data is divided into 100 sec bins |
 |
 |
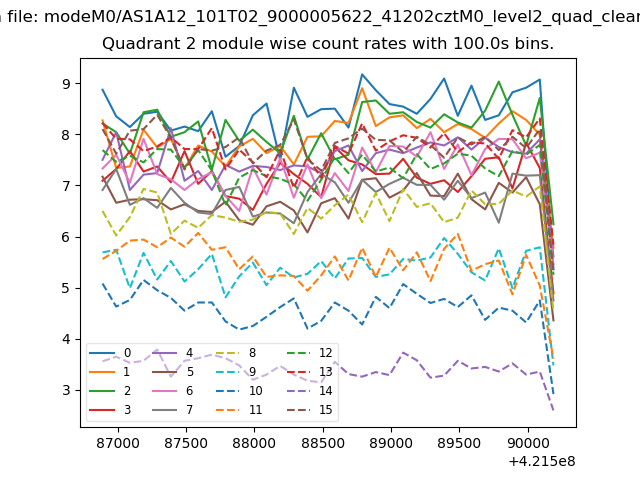
| Module-wise count rates for Quadrant B Data is divided into 100 sec bins |
 |
 |
| Module-wise count rates for Quadrant C Data is divided into 100 sec bins |
 |
 |
| Module-wise count rates for Quadrant D Data is divided into 100 sec bins |
 |
 |
| Parameter | Plot |
|---|---|
| CZT HV Monitor | 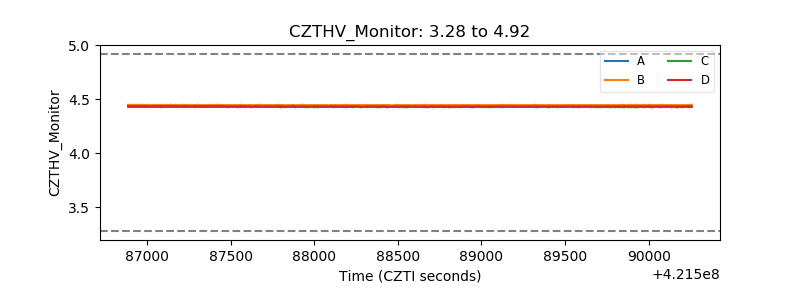 |
| D_VDD | 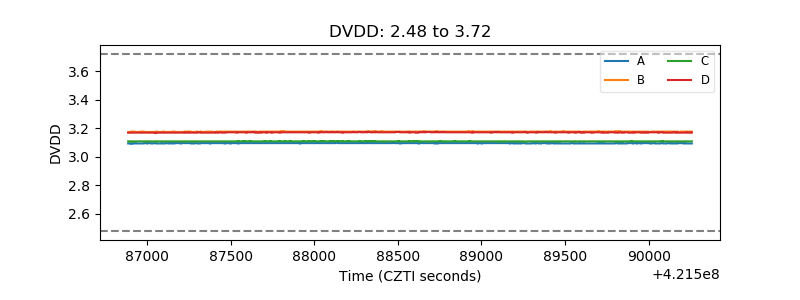 |
| Temperature 1 | 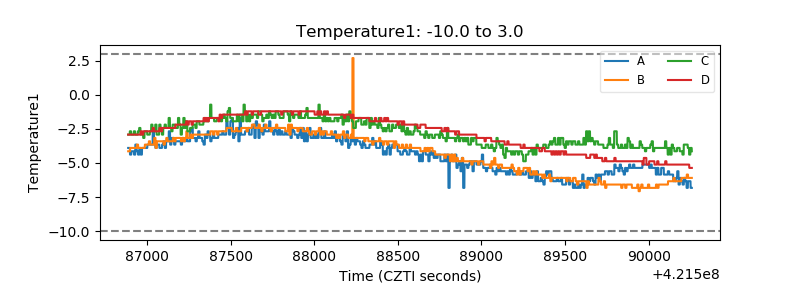 |
| Veto HV Monitor | 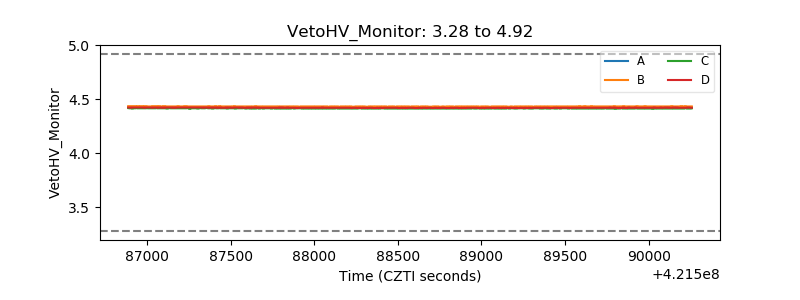 |
| Veto LLD | 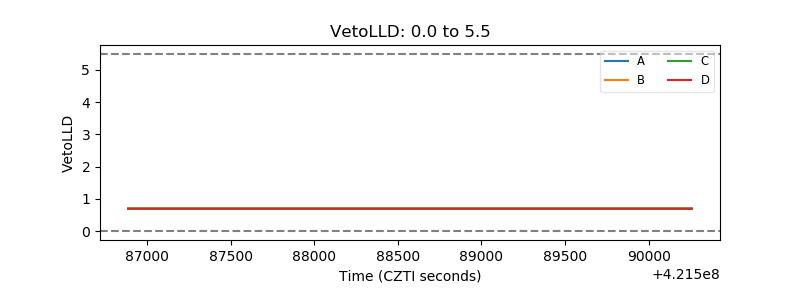 |
| Alpha Counter | 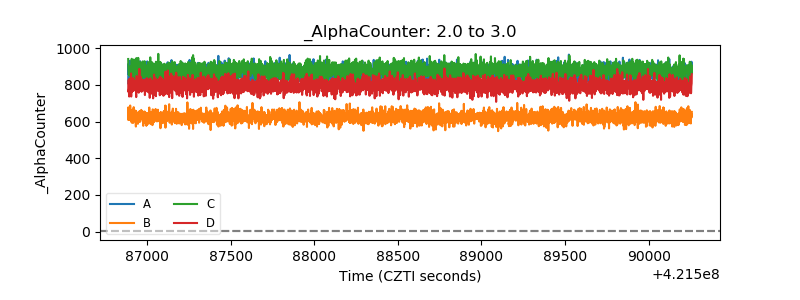 |
| _CPM_Rate | 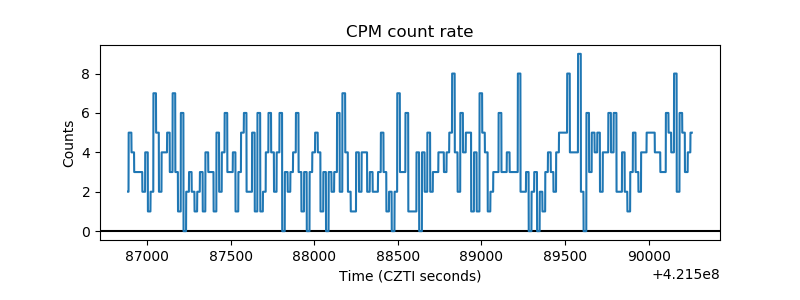 |
| CZT Counter | 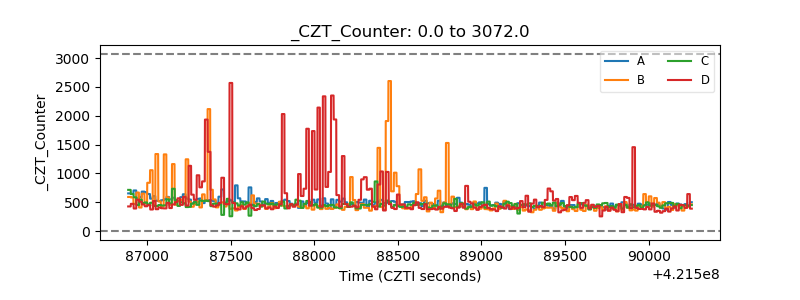 |
| +2.5 Volts monitor | 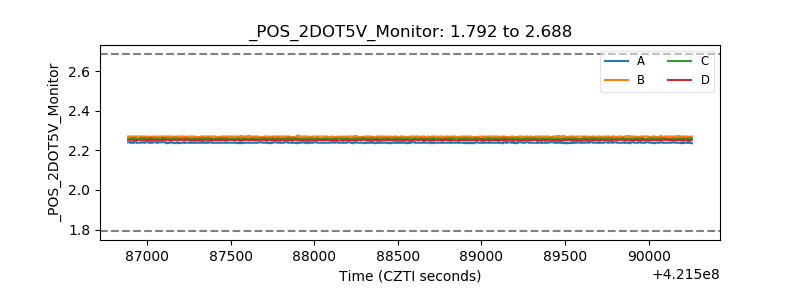 |
| +5 Volts monitor | 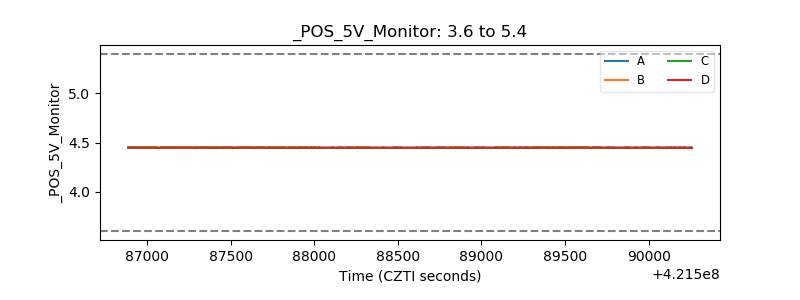 |
| _ROLL_ROT | 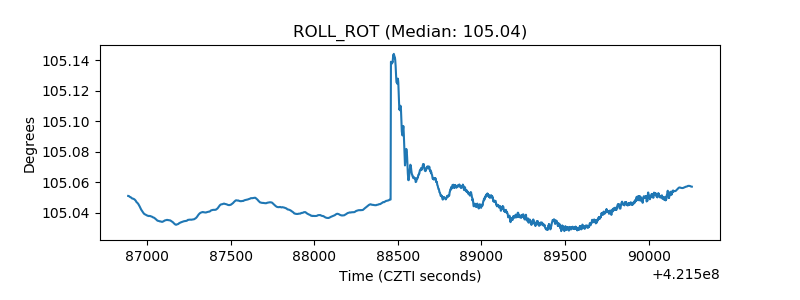 |
| _Roll_DEC | 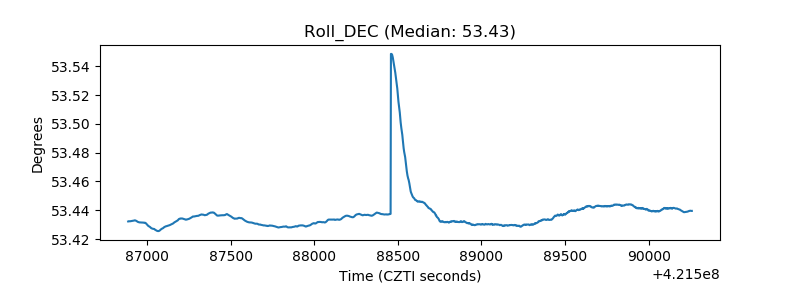 |
| _Roll_RA | 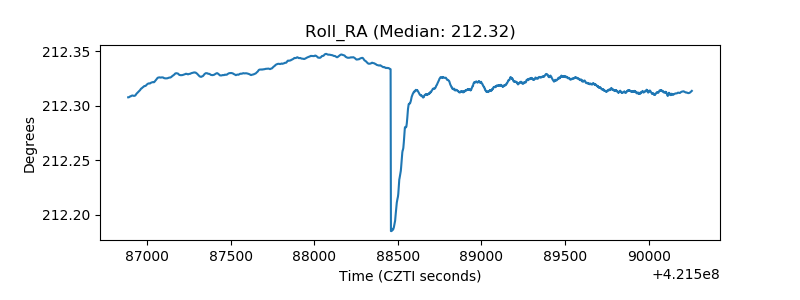 |
| Veto Counter | 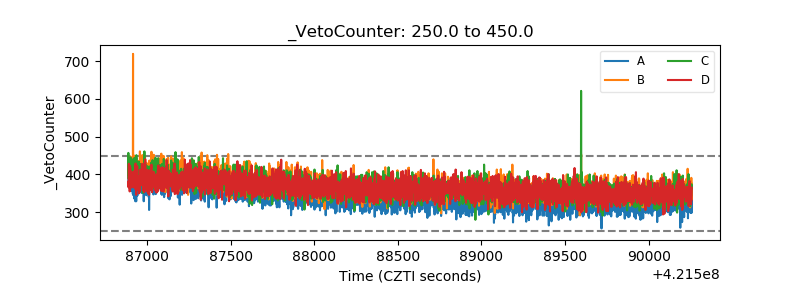 |