| Param | Original file | Final file |
|---|---|---|
| Filename | modeM0/AS1A12_101T02_9000005622_41203cztM0_level2.fits | modeM0/AS1A12_101T02_9000005622_41203cztM0_level2_quad_clean.evt |
| Size (bytes) | 633,283,200 | 180,624,960 |
| Size | 603.9 MB | 172.3 MB |
| Events in quadrant A | 5,512,699 | 1,251,303 |
| Events in quadrant B | 6,059,801 | 1,235,255 |
| Events in quadrant C | 5,524,889 | 1,169,849 |
| Events in quadrant D | 5,542,015 | 1,097,259 |
| Mode M9 | |||
|---|---|---|---|
| Quadrant | BADHDUFLAG | Total packets | Discarded packets |
| A | 0 | 41 | 0 |
| B | 0 | 41 | 0 |
| C | 0 | 41 | 0 |
| D | 0 | 41 | 0 |
| Mode M0 | |||
|---|---|---|---|
| Quadrant | BADHDUFLAG | Total packets | Discarded packets |
| A | 0 | 22084 | 3 |
| B | 0 | 24873 | 2 |
| C | 0 | 22656 | 2 |
| D | 0 | 23679 | 2 |
| Mode SS | |||
|---|---|---|---|
| Quadrant | BADHDUFLAG | Total packets | Discarded packets |
| A | 0 | 210 | 0 |
| B | 0 | 210 | 0 |
| C | 0 | 210 | 0 |
| D | 0 | 210 | 0 |
| Quadrant | Total seconds | Saturated seconds | Saturation percentage |
|---|---|---|---|
| A | 10342 | 12 | 0.116032% |
| B | 10342 | 517 | 4.999033% |
| C | 10342 | 227 | 2.194933% |
| D | 10342 | 165 | 1.595436% |
Noise dominated data is calculated using 1-second bins in cleaned event files. If a bin has >2000 counts, and if more than 50% of those come from <1% of pixels, then it is considered to be noise-dominated and hence unusable.
| Quadrant | # 1 sec bins | Bins with >0 counts | Bins with >2000 counts | High rate bins dominated by noise | Noise dominated (total time) | Noise dominated (detector-on time) | Marked lightcurve |
|---|---|---|---|---|---|---|---|
| A | 14407 | 10344 | 4 | 4 | 0.03% | 0.04% | 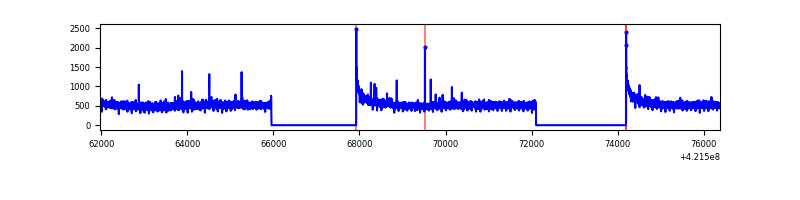 |
| B | 14407 | 10344 | 448 | 448 | 3.11% | 4.33% | 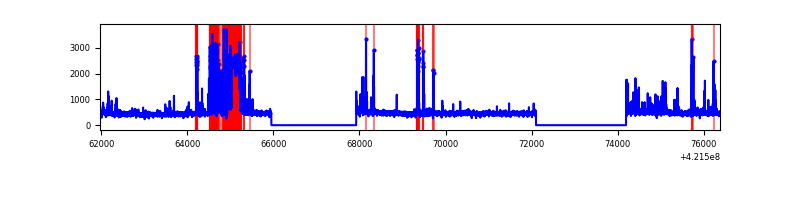 |
| C | 14407 | 10344 | 232 | 232 | 1.61% | 2.24% | 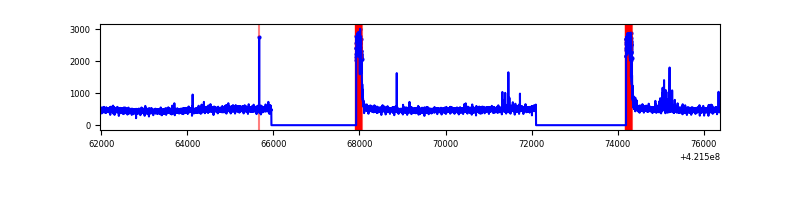 |
| D | 14407 | 10344 | 147 | 147 | 1.02% | 1.42% | 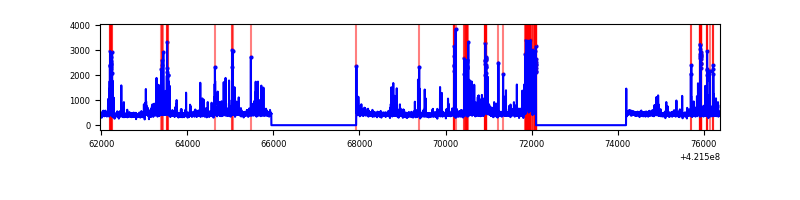 |
Top three noisy pixels from each quadrant. If the there are fewer than three noisy pixels in the level2.evt file, extra rows are filled as -1
| Pixel properties | Quadrant properties | ||||||
|---|---|---|---|---|---|---|---|
| Quadrant | DetID | PixID | Counts | Sigma | Mean | Median | Sigma |
| A | 10 | 83 | 838317 | 3486.87 | 1190 | 1168 | 240.1 |
| A | 12 | 189 | 35965 | 144.93 | 1190 | 1168 | 240.1 |
| A | 2 | 79 | 33342 | 134.01 | 1190 | 1168 | 240.1 |
| B | 5 | 255 | 1450026 | 6755.79 | 1141 | 1114 | 214.5 |
| B | 0 | 229 | 59066 | 270.21 | 1141 | 1114 | 214.5 |
| B | 0 | 190 | 50966 | 232.44 | 1141 | 1114 | 214.5 |
| C | 0 | 10 | 668885 | 2604.53 | 1122 | 1131 | 256.4 |
| C | 15 | 214 | 431047 | 1676.86 | 1122 | 1131 | 256.4 |
| C | 14 | 254 | 38932 | 147.44 | 1122 | 1131 | 256.4 |
| D | 13 | 249 | 418626 | 1530.56 | 1140 | 1110 | 272.8 |
| D | 2 | 249 | 266908 | 974.38 | 1140 | 1110 | 272.8 |
| D | 10 | 199 | 187332 | 682.66 | 1140 | 1110 | 272.8 |
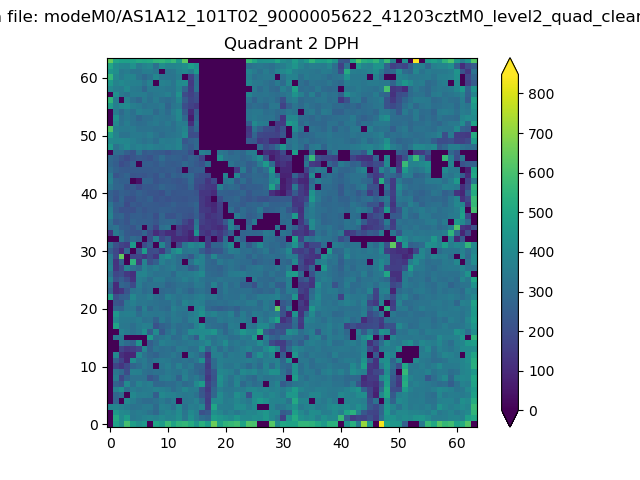
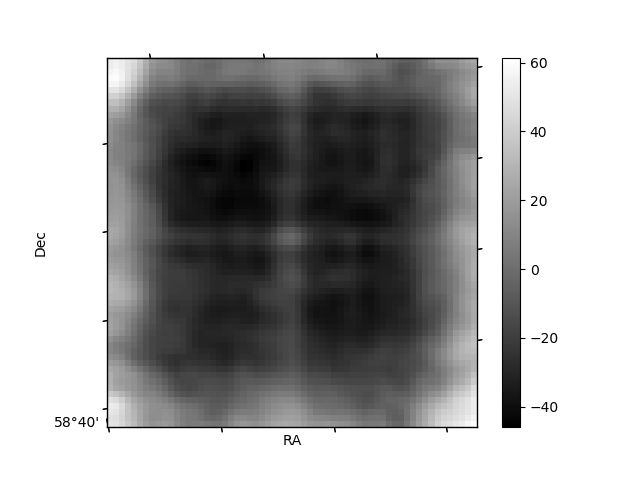
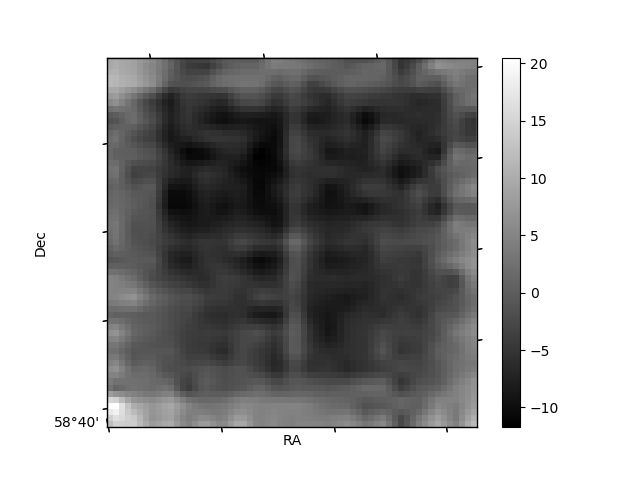
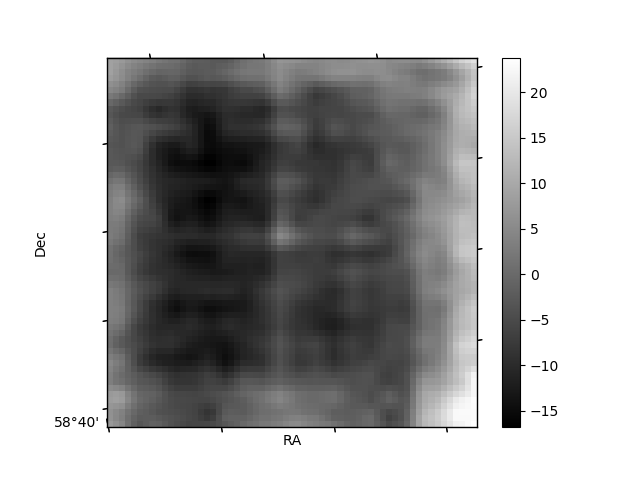
Histogram calculated using DETX and DETY for each event in the final _common_clean file
| Quadrant A | 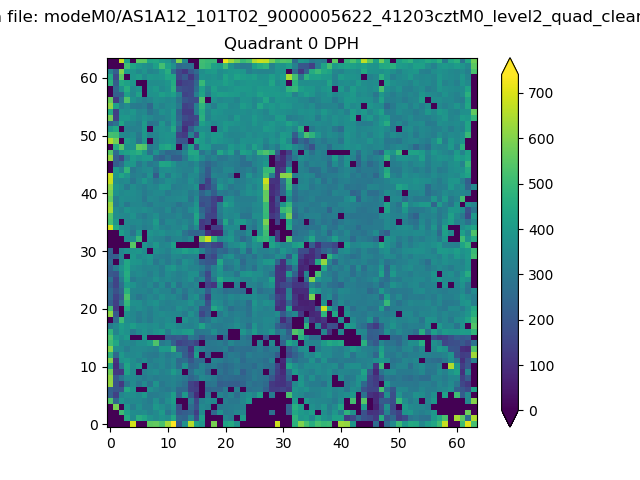 |
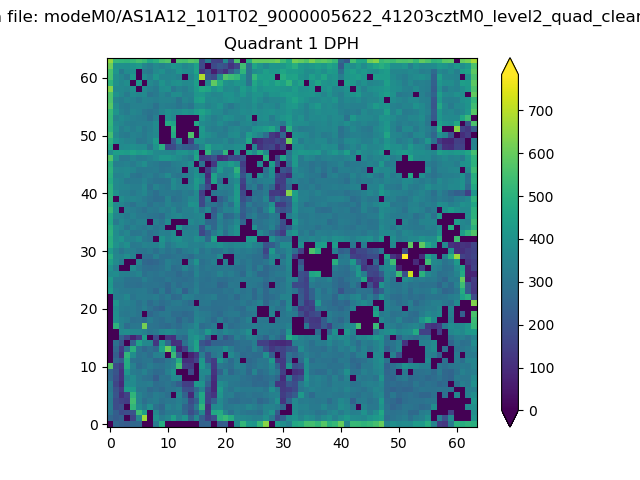 |
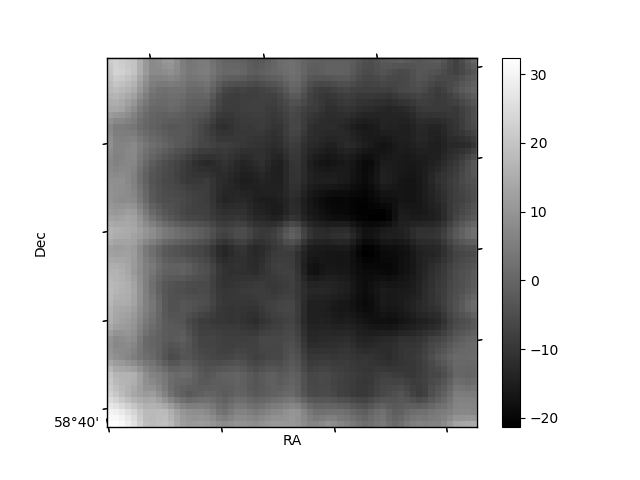
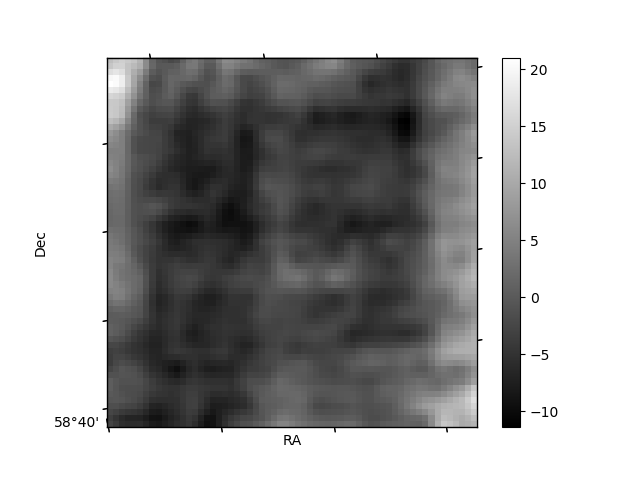
Quadrant B |
|---|---|---|---|
| Quadrant D | 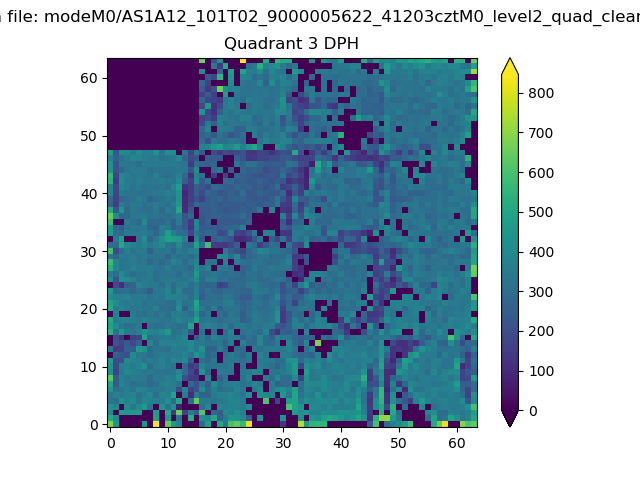 |
 |
Quadrant C |
| Plot type | Count rate plots | Images |
|---|---|---|
| Comparison with Poisson distribution Blue bars denote a histogram of data divided into 1 sec bins. Red curve is a Poisson curve with rate = median count rate of data. |
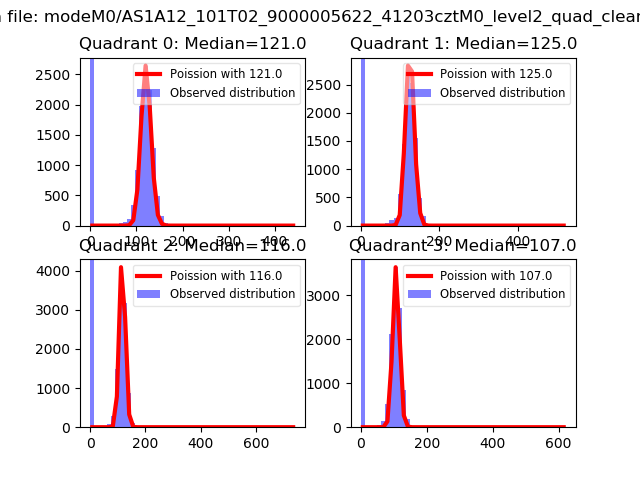 |
 |
| Quadrant-wise count rates Data is divided into 100 sec bins |
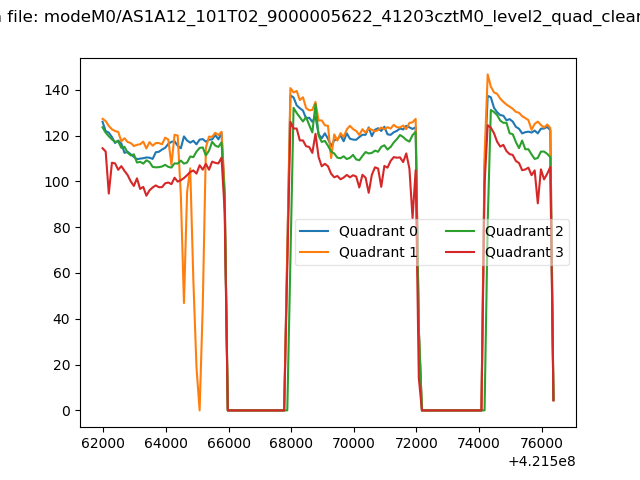 |
|
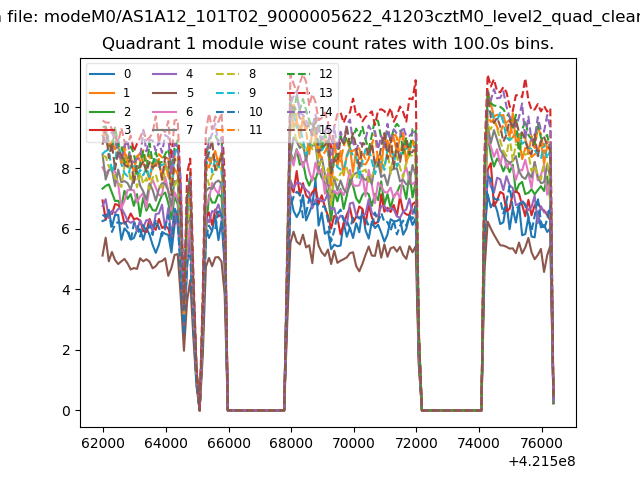
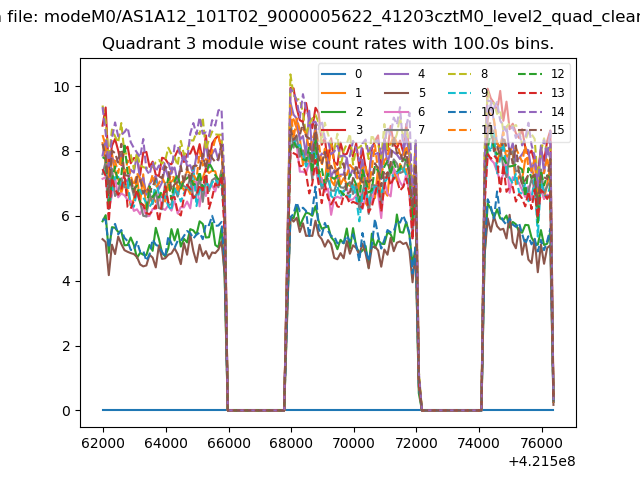
| Module-wise count rates for Quadrant A Data is divided into 100 sec bins |
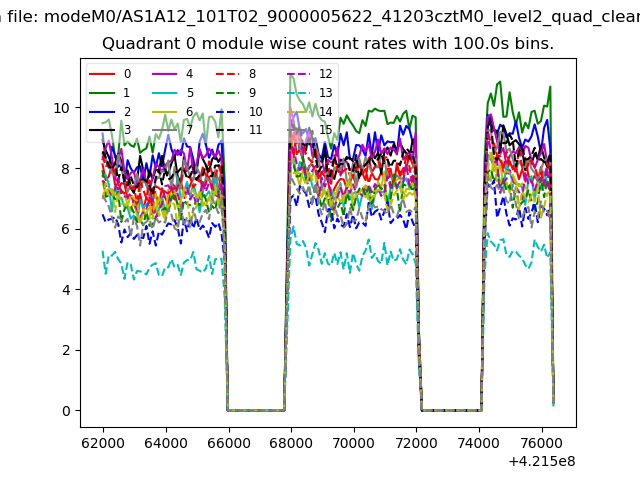 |
 |
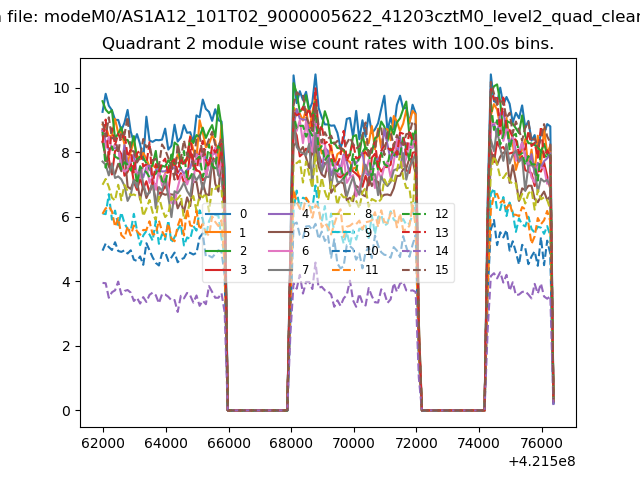
| Module-wise count rates for Quadrant B Data is divided into 100 sec bins |
 |
 |
| Module-wise count rates for Quadrant C Data is divided into 100 sec bins |
 |
 |
| Module-wise count rates for Quadrant D Data is divided into 100 sec bins |
 |
 |
| Parameter | Plot |
|---|---|
| CZT HV Monitor | 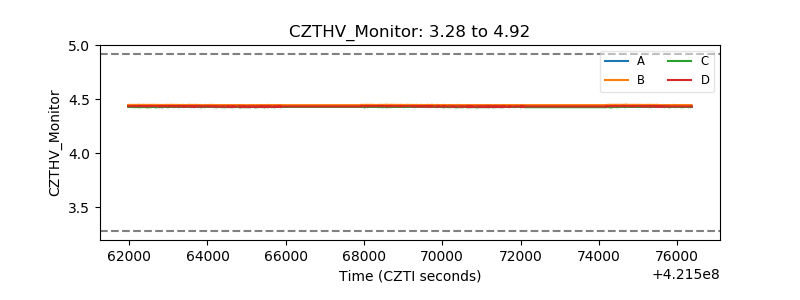 |
| D_VDD | 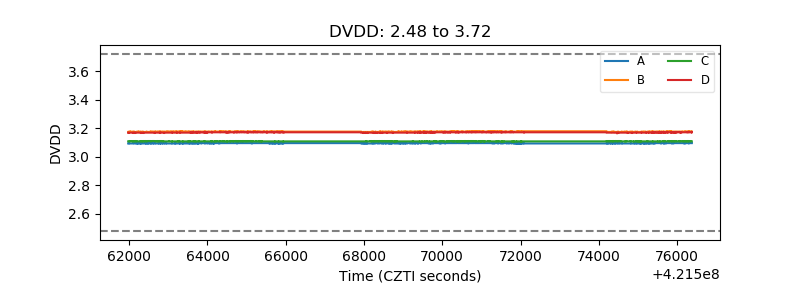 |
| Temperature 1 | 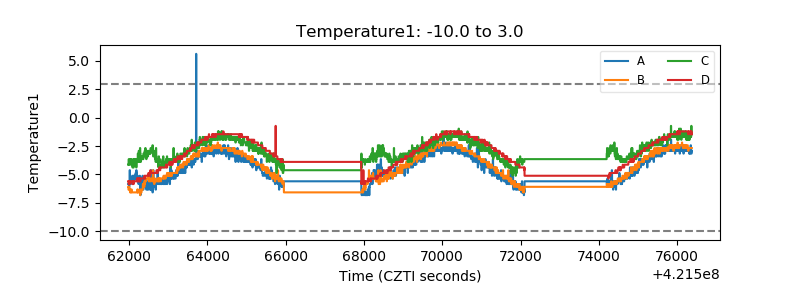 |
| Veto HV Monitor | 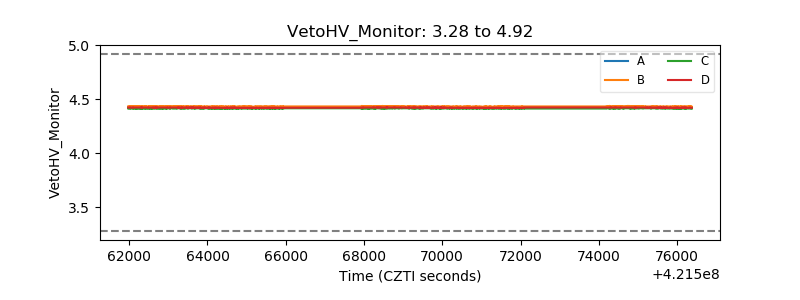 |
| Veto LLD | 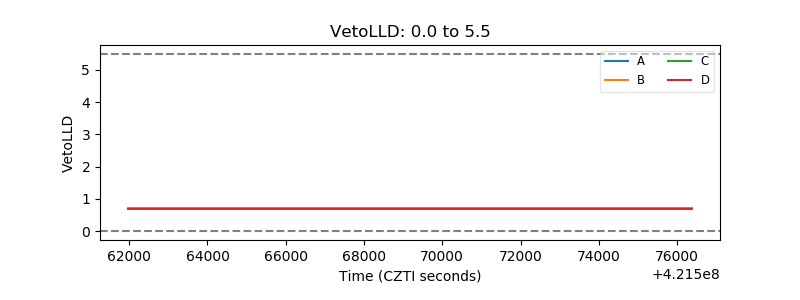 |
| Alpha Counter | 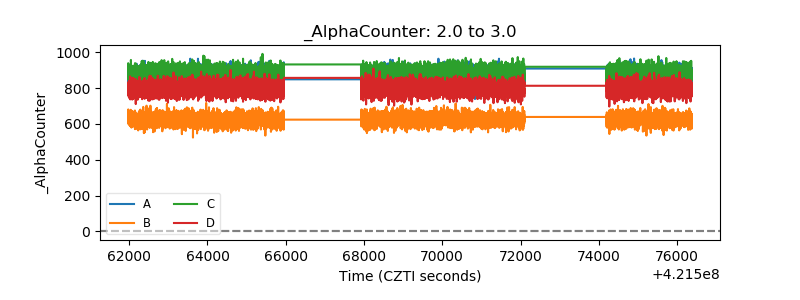 |
| _CPM_Rate | 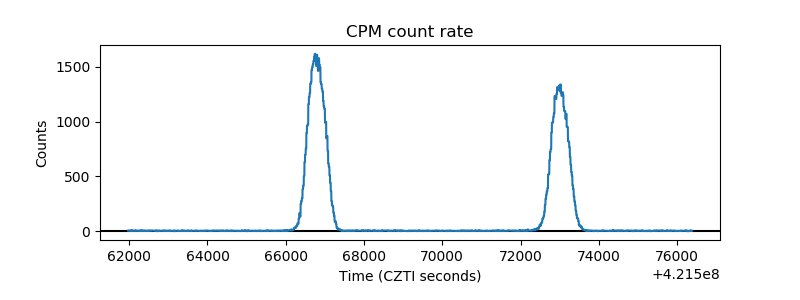 |
| CZT Counter | 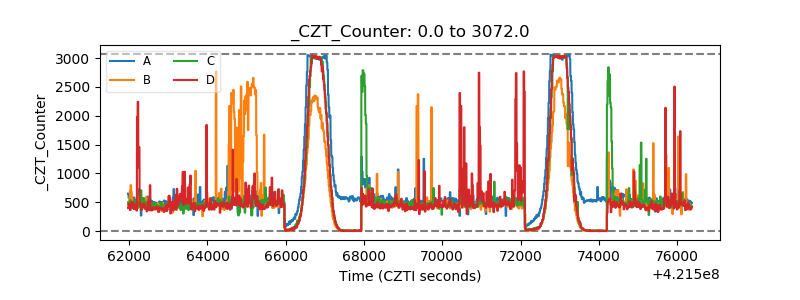 |
| +2.5 Volts monitor | 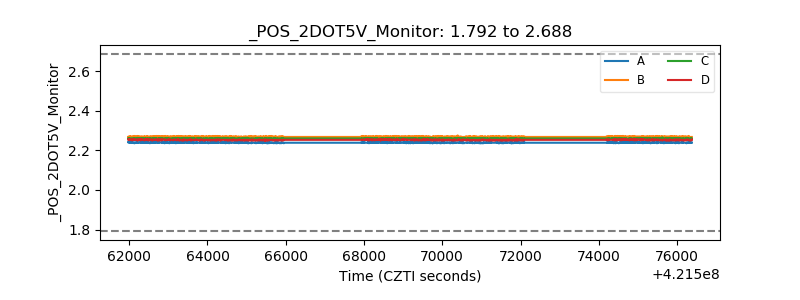 |
| +5 Volts monitor | 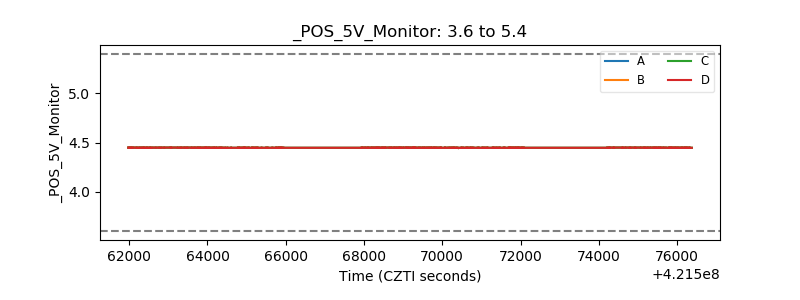 |
| _ROLL_ROT | 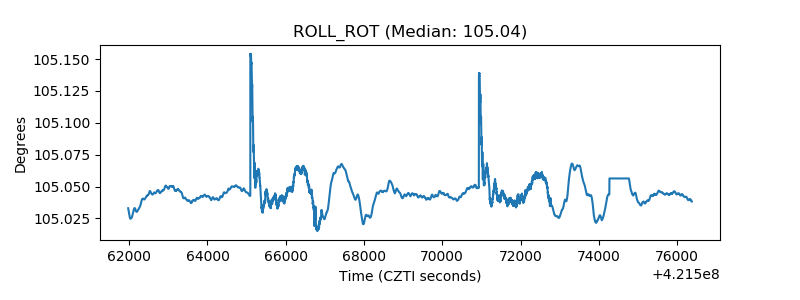 |
| _Roll_DEC |  |
| _Roll_RA | 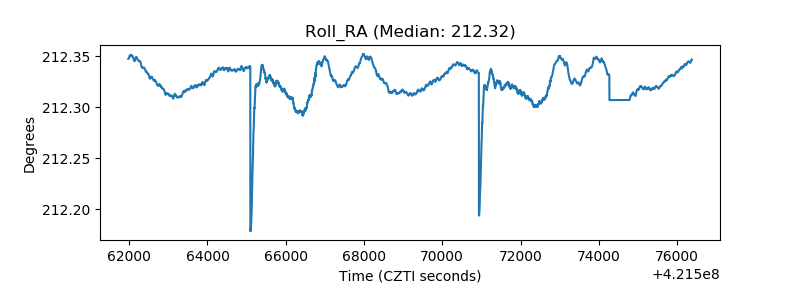 |
| Veto Counter | 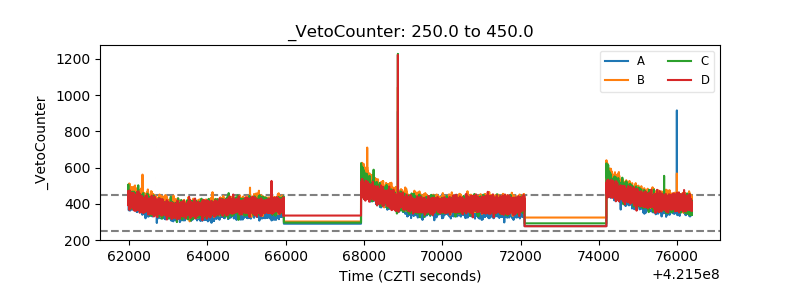 |