| Param | Original file | Final file |
|---|---|---|
| Filename | modeM0/AS1A12_101T02_9000005622_41204cztM0_level2.fits | modeM0/AS1A12_101T02_9000005622_41204cztM0_level2_quad_clean.evt |
| Size (bytes) | 1,235,537,280 | 340,341,120 |
| Size | 1.2 GB | 324.6 MB |
| Events in quadrant A | 10,460,748 | 2,359,467 |
| Events in quadrant B | 11,083,093 | 2,358,443 |
| Events in quadrant C | 10,627,067 | 2,193,057 |
| Events in quadrant D | 12,020,004 | 2,020,861 |
| Mode M9 | |||
|---|---|---|---|
| Quadrant | BADHDUFLAG | Total packets | Discarded packets |
| A | 0 | 83 | 0 |
| B | 0 | 83 | 0 |
| C | 0 | 83 | 0 |
| D | 0 | 83 | 0 |
| Mode M0 | |||
|---|---|---|---|
| Quadrant | BADHDUFLAG | Total packets | Discarded packets |
| A | 0 | 42380 | 4 |
| B | 0 | 46494 | 4 |
| C | 0 | 43741 | 4 |
| D | 0 | 49691 | 4 |
| Mode SS | |||
|---|---|---|---|
| Quadrant | BADHDUFLAG | Total packets | Discarded packets |
| A | 0 | 408 | 0 |
| B | 0 | 408 | 0 |
| C | 0 | 408 | 0 |
| D | 0 | 408 | 0 |
| Quadrant | Total seconds | Saturated seconds | Saturation percentage |
|---|---|---|---|
| A | 19947 | 27 | 0.135359% |
| B | 19947 | 652 | 3.268662% |
| C | 19947 | 479 | 2.401364% |
| D | 19947 | 723 | 3.624605% |
Noise dominated data is calculated using 1-second bins in cleaned event files. If a bin has >2000 counts, and if more than 50% of those come from <1% of pixels, then it is considered to be noise-dominated and hence unusable.
| Quadrant | # 1 sec bins | Bins with >0 counts | Bins with >2000 counts | High rate bins dominated by noise | Noise dominated (total time) | Noise dominated (detector-on time) | Marked lightcurve |
|---|---|---|---|---|---|---|---|
| A | 28288 | 19951 | 7 | 7 | 0.02% | 0.04% | 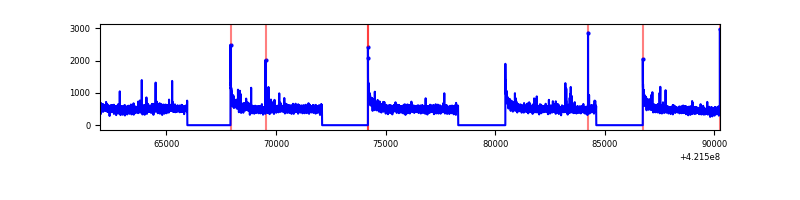 |
| B | 28288 | 19951 | 557 | 557 | 1.97% | 2.79% | 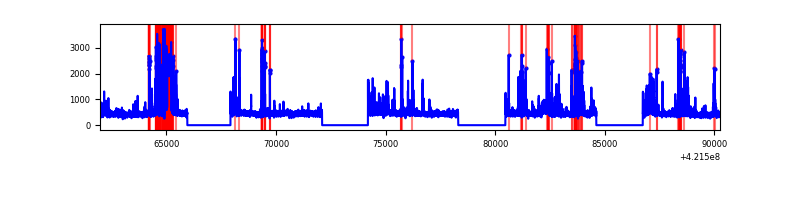 |
| C | 28288 | 19951 | 484 | 484 | 1.71% | 2.43% | 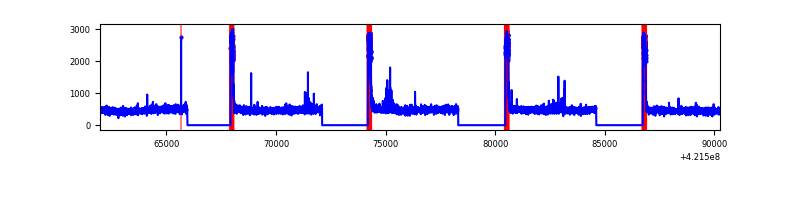 |
| D | 28288 | 19951 | 661 | 661 | 2.34% | 3.31% | 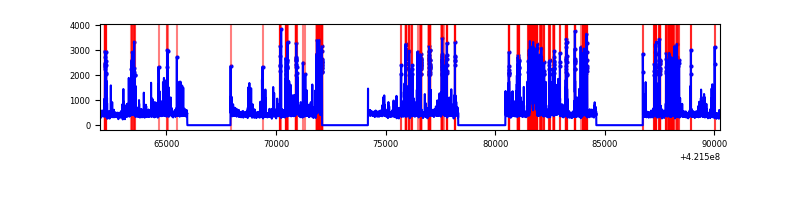 |
Top three noisy pixels from each quadrant. If the there are fewer than three noisy pixels in the level2.evt file, extra rows are filled as -1
| Pixel properties | Quadrant properties | ||||||
|---|---|---|---|---|---|---|---|
| Quadrant | DetID | PixID | Counts | Sigma | Mean | Median | Sigma |
| A | 10 | 83 | 1614902 | 3581.15 | 2247 | 2204 | 450.3 |
| A | 12 | 189 | 53673 | 114.29 | 2247 | 2204 | 450.3 |
| A | 2 | 79 | 42590 | 89.68 | 2247 | 2204 | 450.3 |
| B | 5 | 255 | 1918718 | 4683.18 | 2184 | 2131 | 409.2 |
| B | 0 | 229 | 353966 | 859.71 | 2184 | 2131 | 409.2 |
| B | 0 | 186 | 111896 | 268.21 | 2184 | 2131 | 409.2 |
| C | 0 | 10 | 1383908 | 2847.11 | 2139 | 2155 | 485.3 |
| C | 15 | 214 | 828506 | 1702.7 | 2139 | 2155 | 485.3 |
| C | 14 | 254 | 43293 | 84.77 | 2139 | 2155 | 485.3 |
| D | 13 | 249 | 1328833 | 2572.03 | 2153 | 2097 | 515.8 |
| D | 12 | 16 | 1087915 | 2104.99 | 2153 | 2097 | 515.8 |
| D | 2 | 249 | 668704 | 1292.3 | 2153 | 2097 | 515.8 |
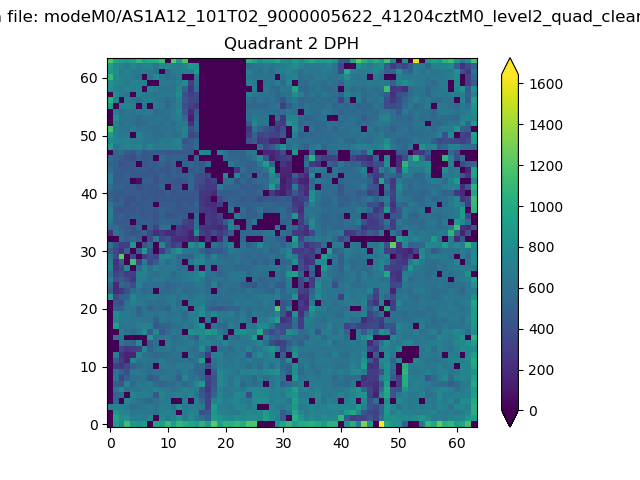
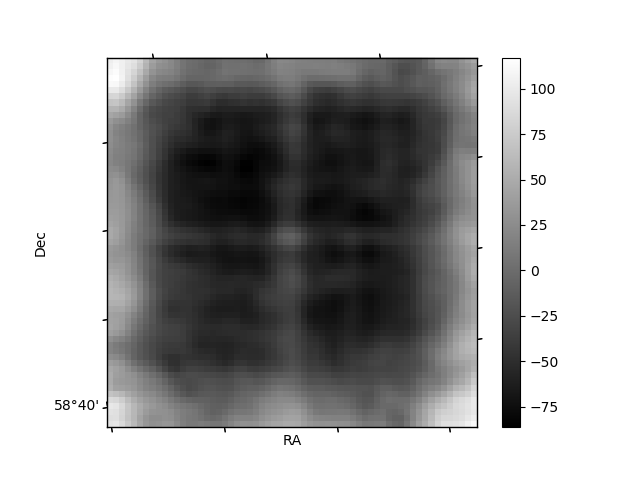
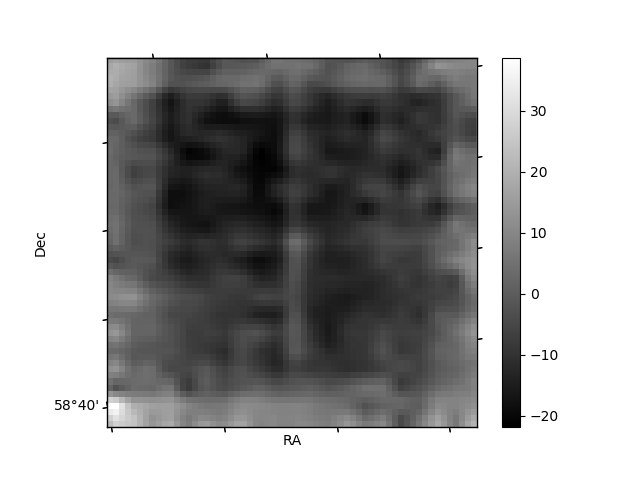
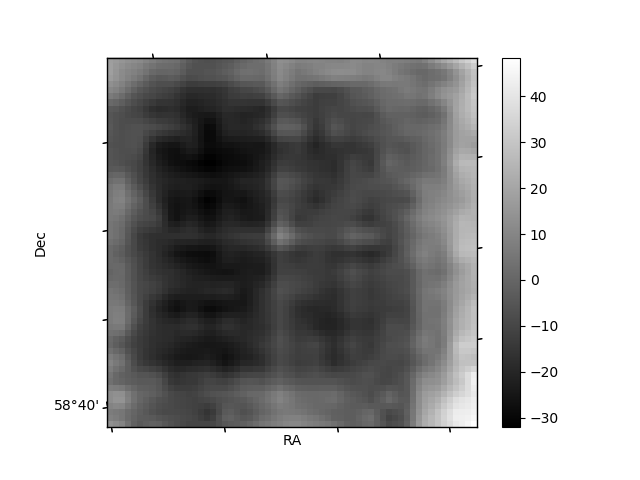
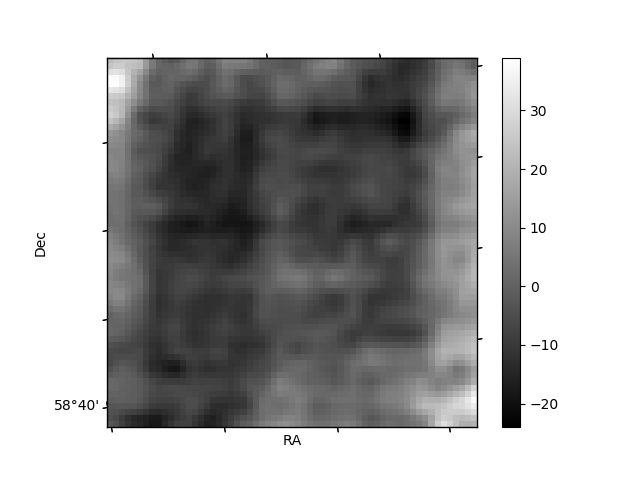
Histogram calculated using DETX and DETY for each event in the final _common_clean file
| Quadrant A | 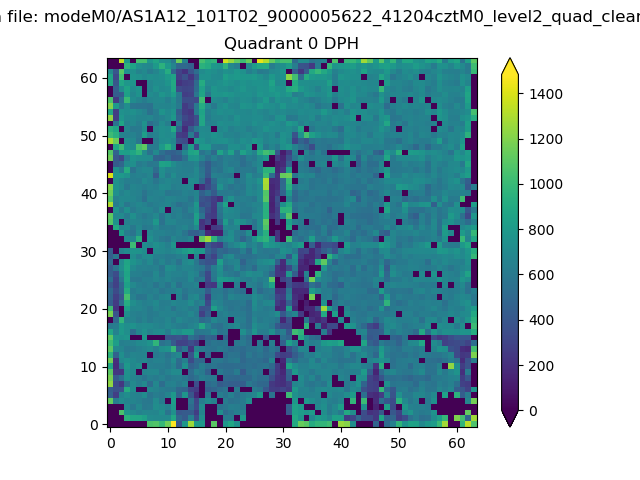 |
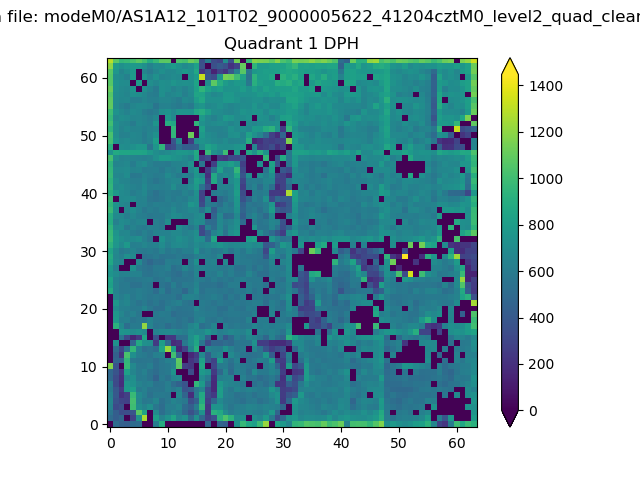 |
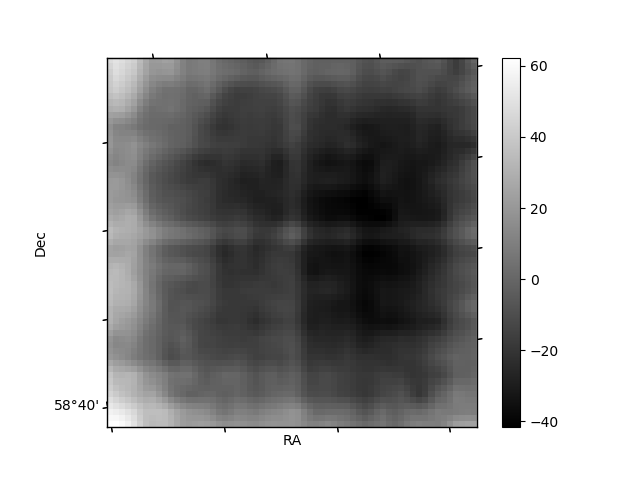
Quadrant B |
|---|---|---|---|
| Quadrant D | 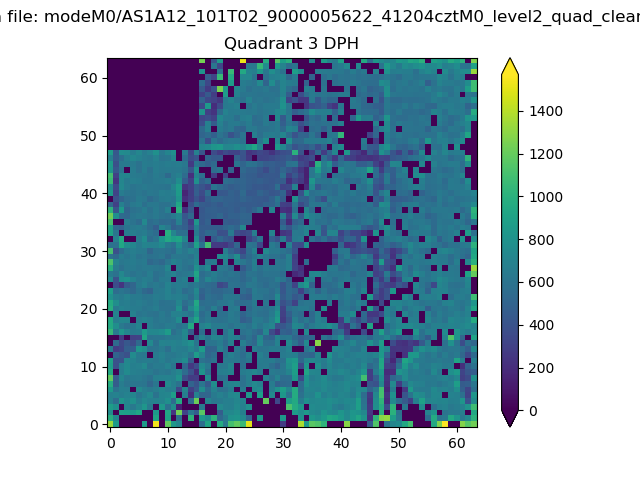 |
 |
Quadrant C |
| Plot type | Count rate plots | Images |
|---|---|---|
| Comparison with Poisson distribution Blue bars denote a histogram of data divided into 1 sec bins. Red curve is a Poisson curve with rate = median count rate of data. |
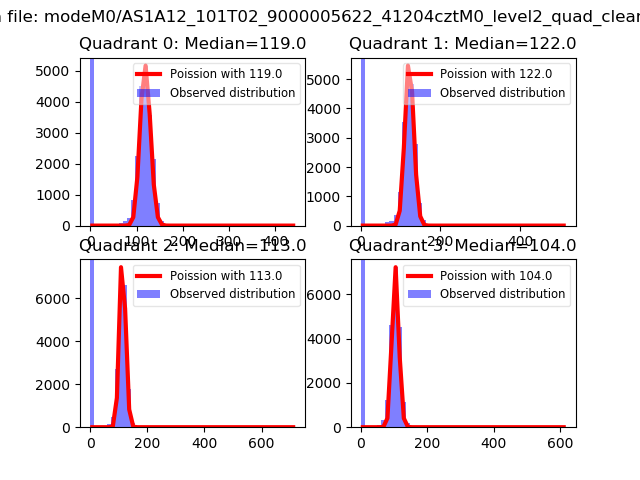 |
 |
| Quadrant-wise count rates Data is divided into 100 sec bins |
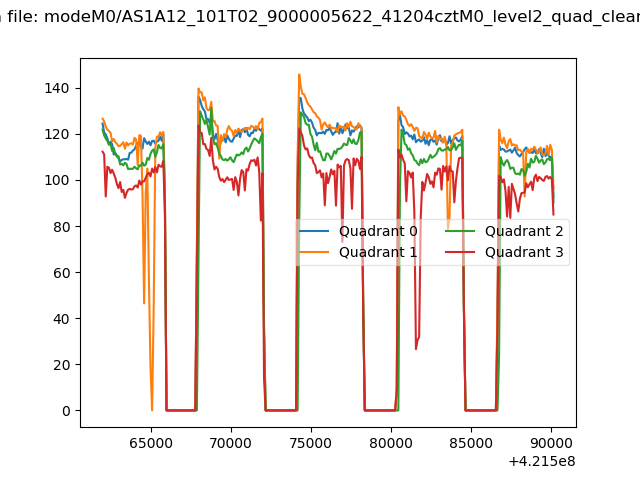 |
|
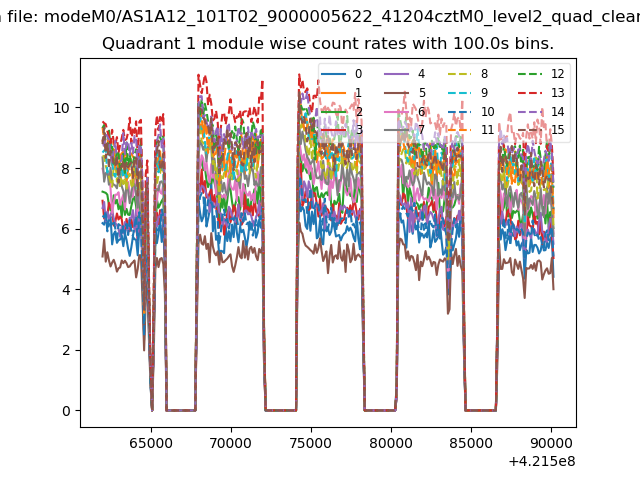
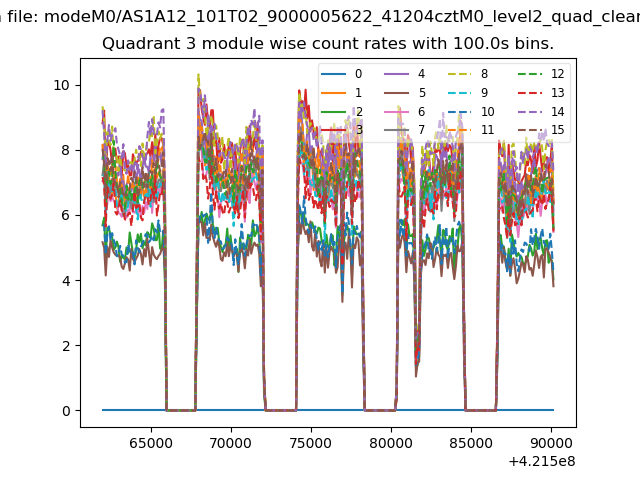
| Module-wise count rates for Quadrant A Data is divided into 100 sec bins |
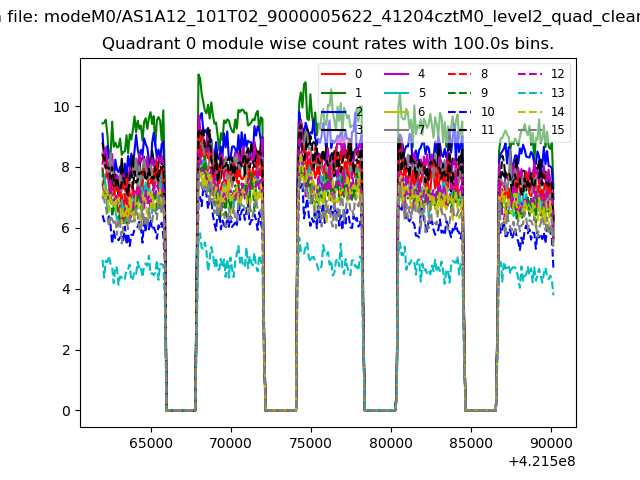 |
 |
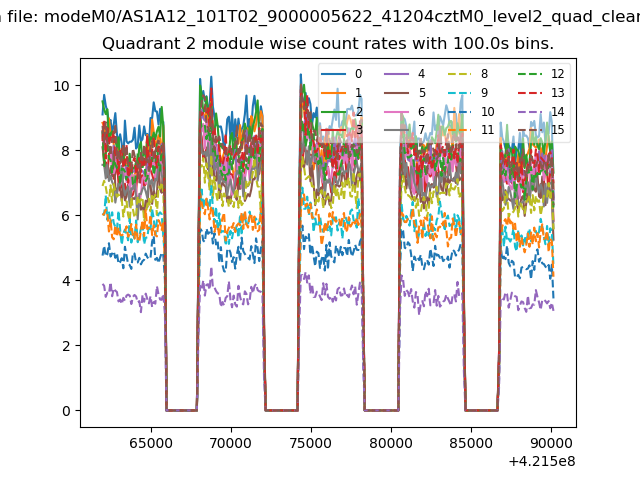
| Module-wise count rates for Quadrant B Data is divided into 100 sec bins |
 |
 |
| Module-wise count rates for Quadrant C Data is divided into 100 sec bins |
 |
 |
| Module-wise count rates for Quadrant D Data is divided into 100 sec bins |
 |
 |
| Parameter | Plot |
|---|---|
| CZT HV Monitor | 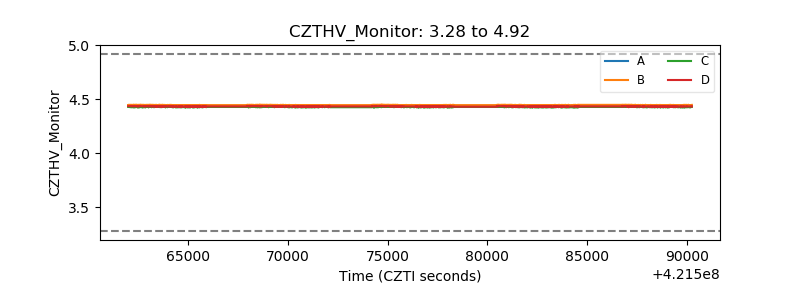 |
| D_VDD | 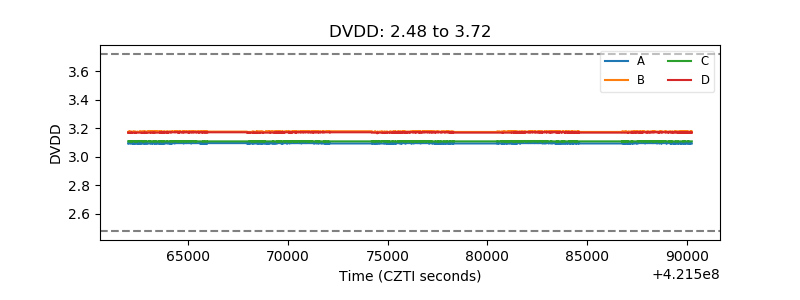 |
| Temperature 1 | 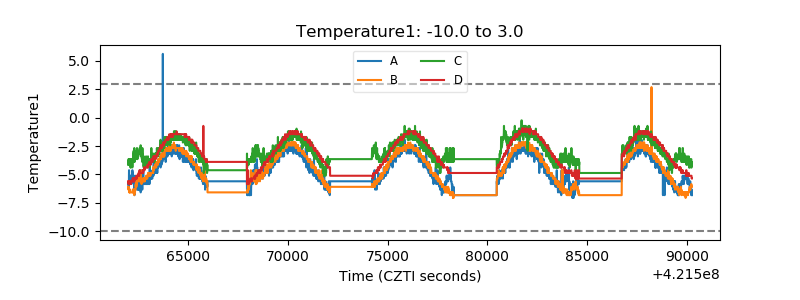 |
| Veto HV Monitor | 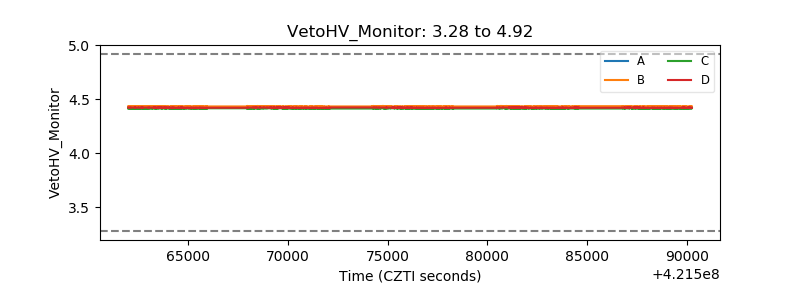 |
| Veto LLD | 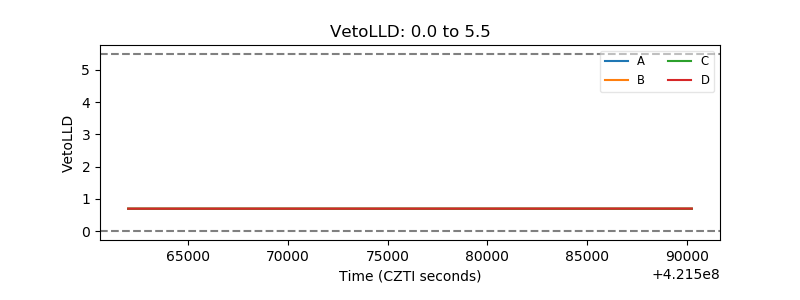 |
| Alpha Counter | 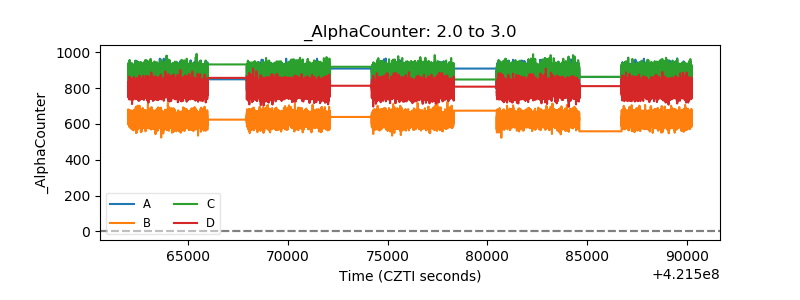 |
| _CPM_Rate | 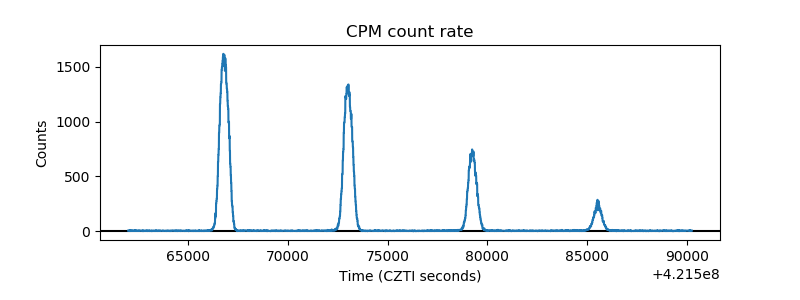 |
| CZT Counter | 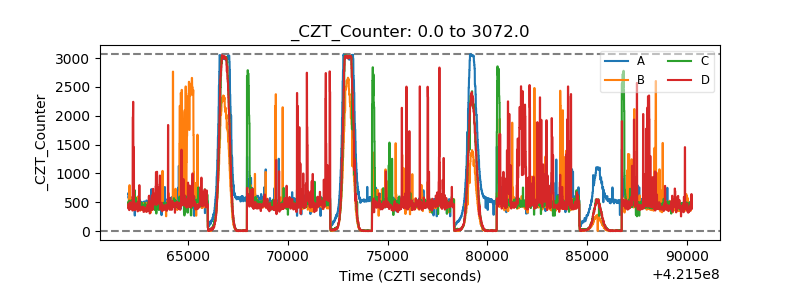 |
| +2.5 Volts monitor | 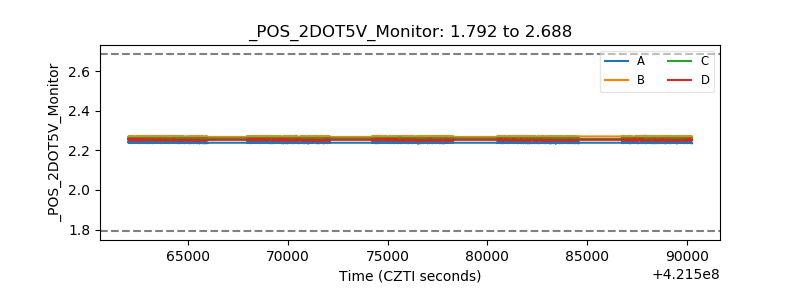 |
| +5 Volts monitor | 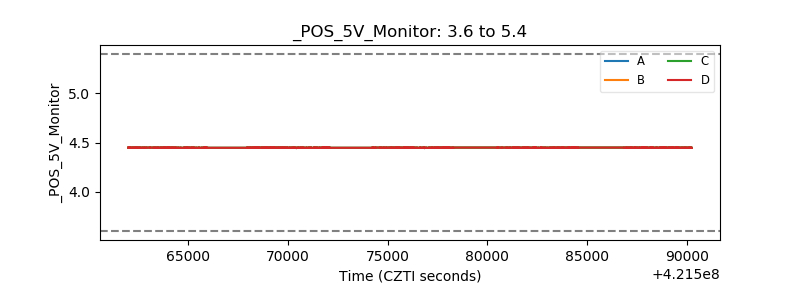 |
| _ROLL_ROT | 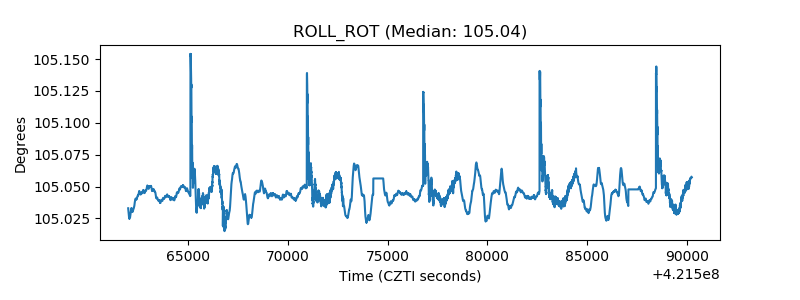 |
| _Roll_DEC | 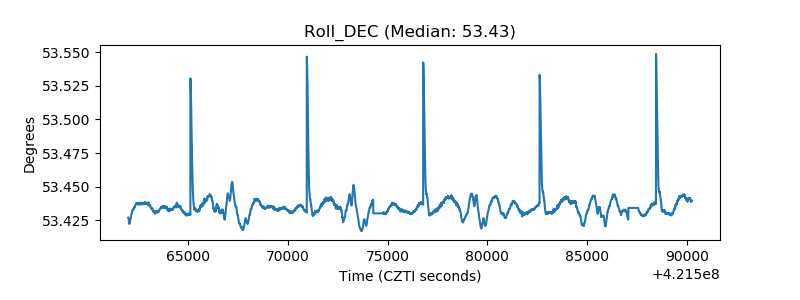 |
| _Roll_RA | 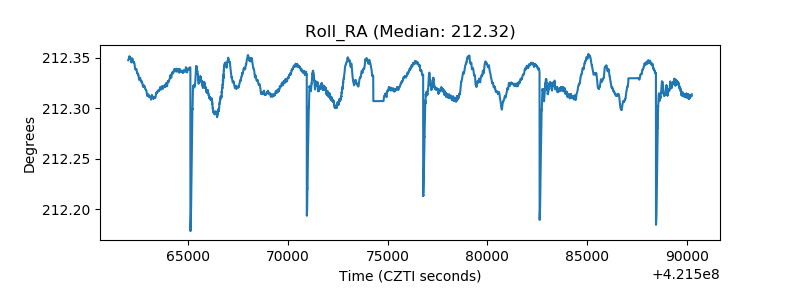 |
| Veto Counter | 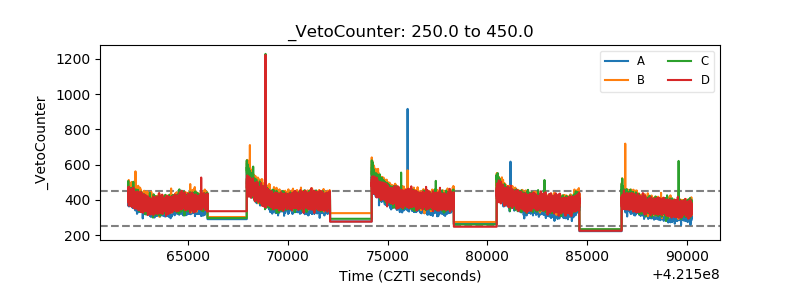 |