| Param | Original file | Final file |
|---|---|---|
| Filename | modeM0/AS1A12_101T03_9000005618_41190cztM0_level2.fits | modeM0/AS1A12_101T03_9000005618_41190cztM0_level2_quad_clean.evt |
| Size (bytes) | 410,011,200 | 104,808,960 |
| Size | 391.0 MB | 100.0 MB |
| Events in quadrant A | 3,362,178 | 705,372 |
| Events in quadrant B | 3,260,284 | 720,709 |
| Events in quadrant C | 4,746,941 | 644,852 |
| Events in quadrant D | 3,297,106 | 644,614 |
| Mode M0 | |||
|---|---|---|---|
| Quadrant | BADHDUFLAG | Total packets | Discarded packets |
| A | 0 | 14096 | 3 |
| B | 0 | 14403 | 2 |
| C | 0 | 18302 | 2 |
| D | 0 | 14630 | 2 |
| Mode M9 | |||
|---|---|---|---|
| Quadrant | BADHDUFLAG | Total packets | Discarded packets |
| A | 0 | 27 | 0 |
| B | 0 | 27 | 0 |
| C | 0 | 27 | 0 |
| D | 0 | 27 | 0 |
| Mode SS | |||
|---|---|---|---|
| Quadrant | BADHDUFLAG | Total packets | Discarded packets |
| A | 0 | 136 | 0 |
| B | 0 | 136 | 0 |
| C | 0 | 136 | 0 |
| D | 0 | 136 | 0 |
| Quadrant | Total seconds | Saturated seconds | Saturation percentage |
|---|---|---|---|
| A | 6563 | 11 | 0.167606% |
| B | 6563 | 69 | 1.051348% |
| C | 6563 | 616 | 9.385952% |
| D | 6563 | 85 | 1.295139% |
Noise dominated data is calculated using 1-second bins in cleaned event files. If a bin has >2000 counts, and if more than 50% of those come from <1% of pixels, then it is considered to be noise-dominated and hence unusable.
| Quadrant | # 1 sec bins | Bins with >0 counts | Bins with >2000 counts | High rate bins dominated by noise | Noise dominated (total time) | Noise dominated (detector-on time) | Marked lightcurve |
|---|---|---|---|---|---|---|---|
| A | 9307 | 6565 | 4 | 4 | 0.04% | 0.06% | 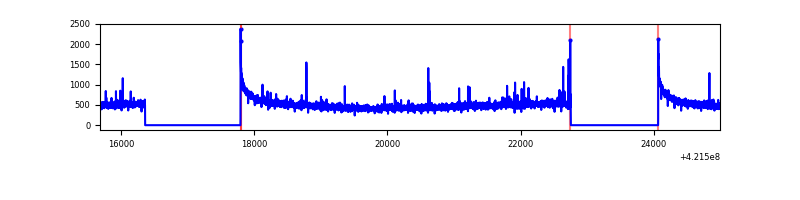 |
| B | 9307 | 6565 | 48 | 48 | 0.52% | 0.73% | 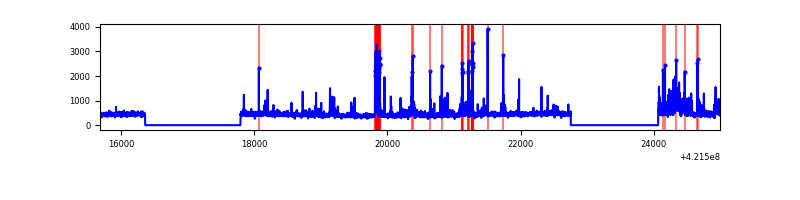 |
| C | 9306 | 6564 | 555 | 555 | 5.96% | 8.46% | 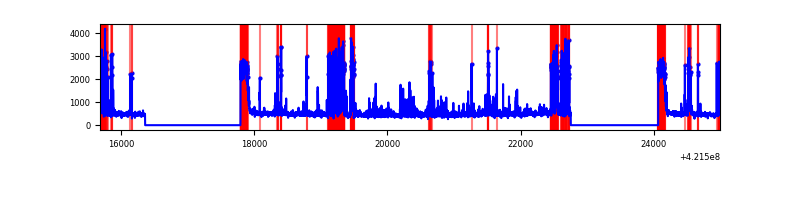 |
| D | 9307 | 6565 | 64 | 64 | 0.69% | 0.97% | 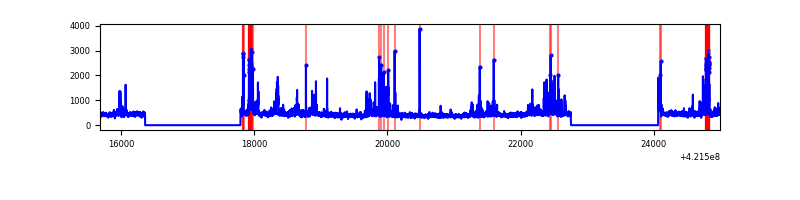 |
Top three noisy pixels from each quadrant. If the there are fewer than three noisy pixels in the level2.evt file, extra rows are filled as -1
| Pixel properties | Quadrant properties | ||||||
|---|---|---|---|---|---|---|---|
| Quadrant | DetID | PixID | Counts | Sigma | Mean | Median | Sigma |
| A | 10 | 83 | 586410 | 4068.43 | 699 | 684 | 144.0 |
| A | 2 | 79 | 39885 | 272.29 | 699 | 684 | 144.0 |
| A | 12 | 189 | 13013 | 85.64 | 699 | 684 | 144.0 |
| B | 5 | 255 | 305568 | 2259.64 | 695 | 676 | 134.9 |
| B | 0 | 229 | 119115 | 877.79 | 695 | 676 | 134.9 |
| B | 0 | 190 | 65806 | 482.7 | 695 | 676 | 134.9 |
| C | 9 | 54 | 1348840 | 8892.37 | 651 | 654 | 151.6 |
| C | 0 | 10 | 554778 | 3654.89 | 651 | 654 | 151.6 |
| C | 15 | 214 | 264617 | 1741.05 | 651 | 654 | 151.6 |
| D | 13 | 249 | 220649 | 1318.73 | 683 | 666 | 166.8 |
| D | 12 | 16 | 149496 | 892.19 | 683 | 666 | 166.8 |
| D | 2 | 249 | 99847 | 594.56 | 683 | 666 | 166.8 |
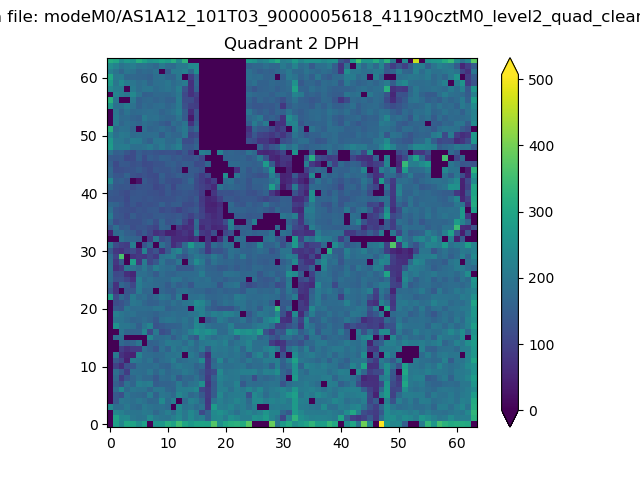
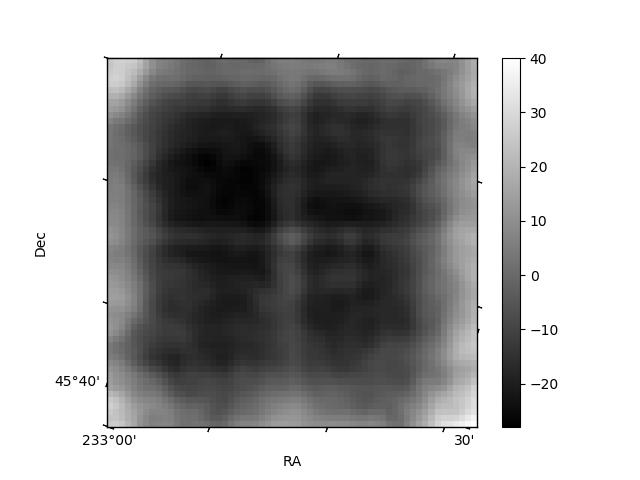
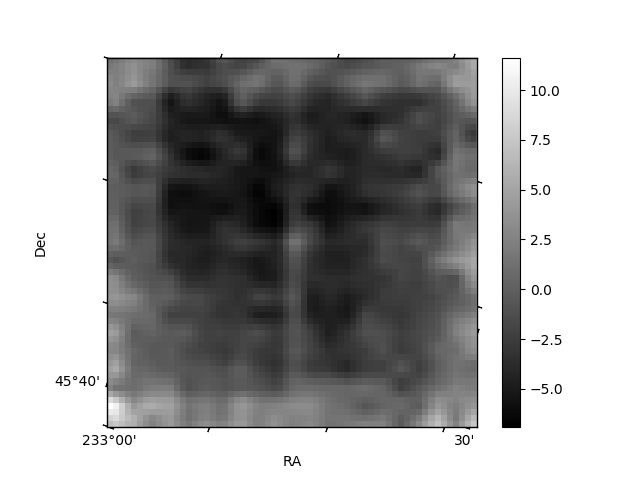
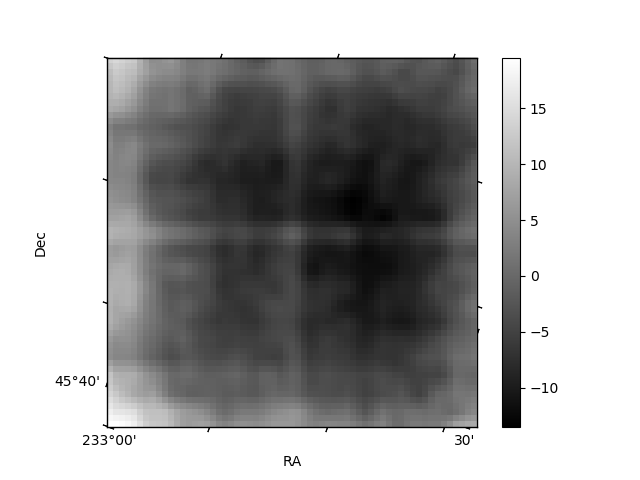
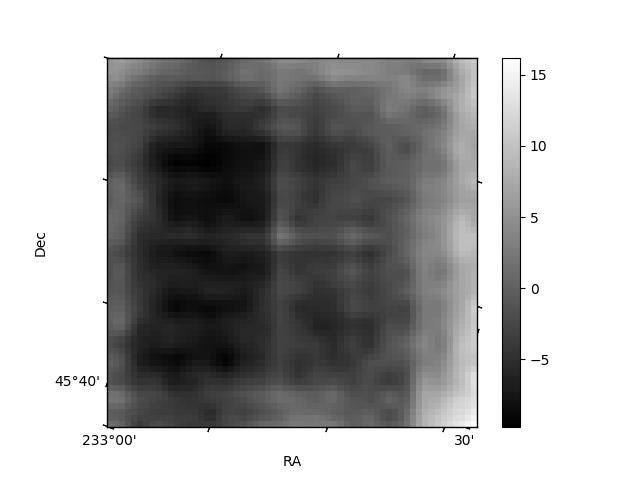
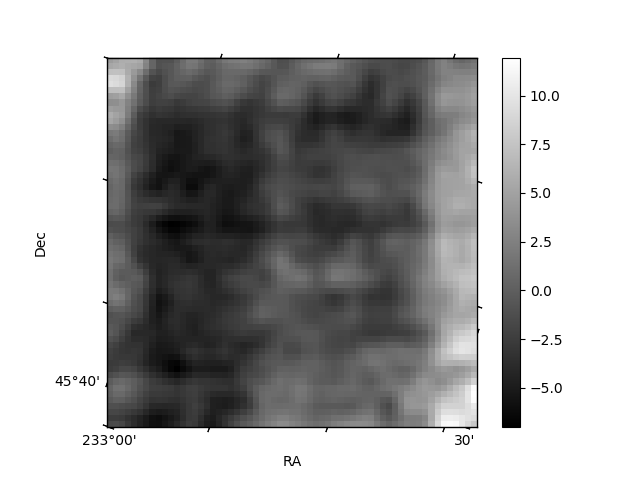
Histogram calculated using DETX and DETY for each event in the final _common_clean file
| Quadrant A | 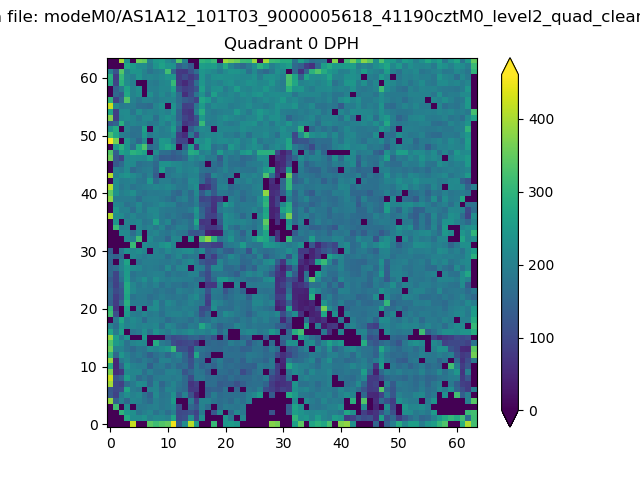 |
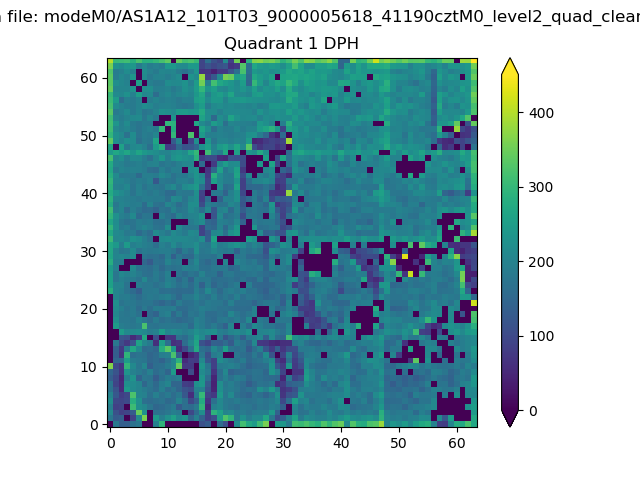 |
Quadrant B |
|---|---|---|---|
| Quadrant D | 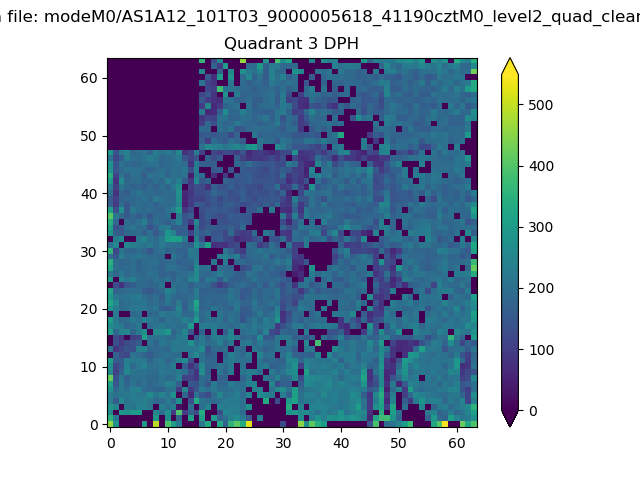 |
 |
Quadrant C |
| Plot type | Count rate plots | Images |
|---|---|---|
| Comparison with Poisson distribution Blue bars denote a histogram of data divided into 1 sec bins. Red curve is a Poisson curve with rate = median count rate of data. |
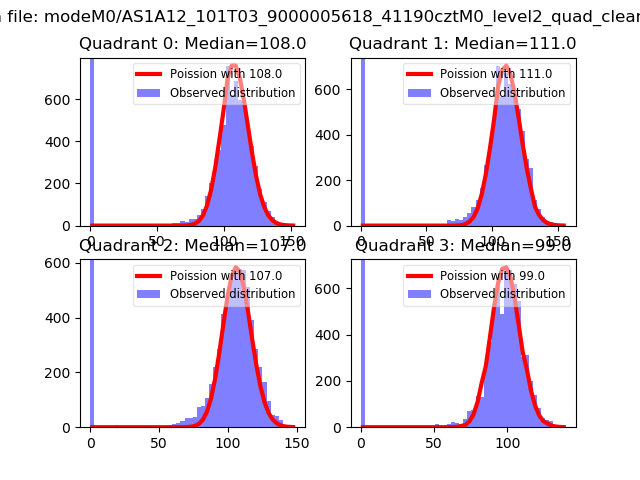 |
 |
| Quadrant-wise count rates Data is divided into 100 sec bins |
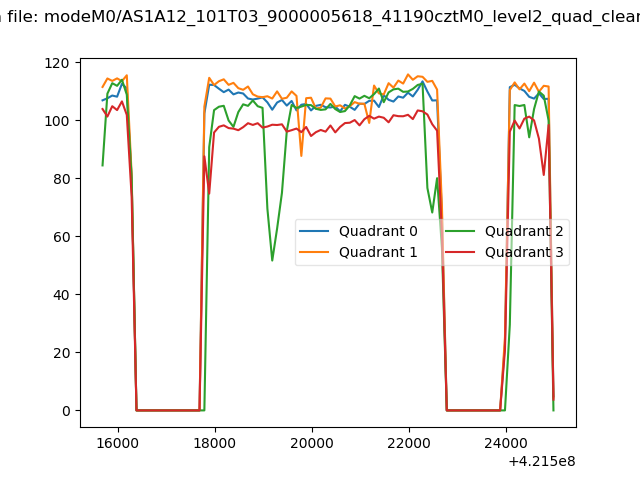 |
|
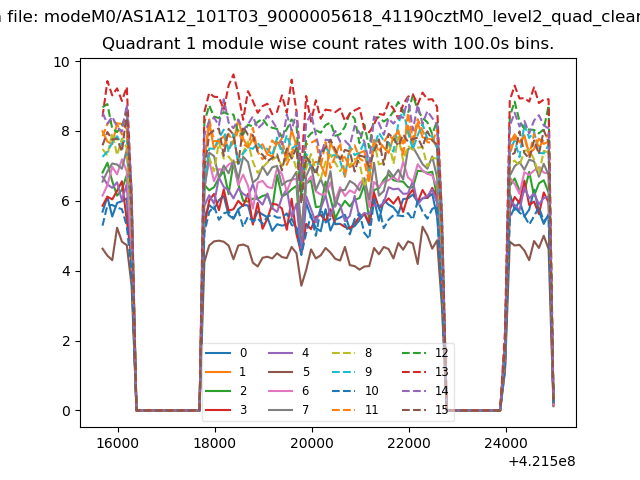
| Module-wise count rates for Quadrant A Data is divided into 100 sec bins |
 |
 |
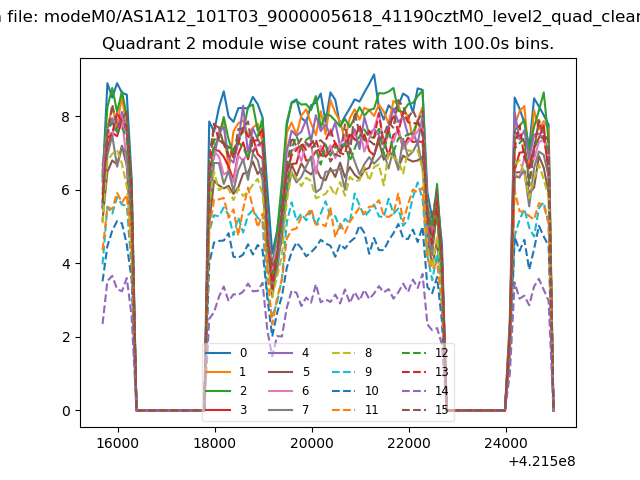
| Module-wise count rates for Quadrant B Data is divided into 100 sec bins |
 |
 |
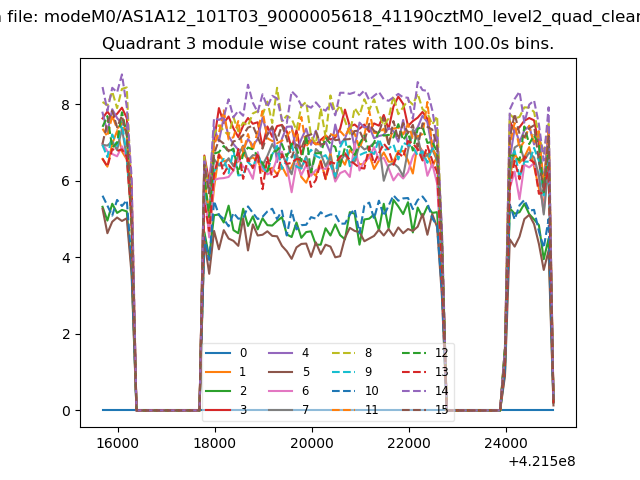
| Module-wise count rates for Quadrant C Data is divided into 100 sec bins |
 |
 |
| Module-wise count rates for Quadrant D Data is divided into 100 sec bins |
 |
 |
| Parameter | Plot |
|---|---|
| CZT HV Monitor | 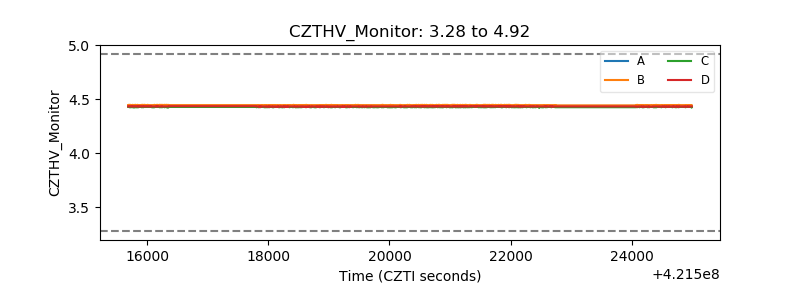 |
| D_VDD | 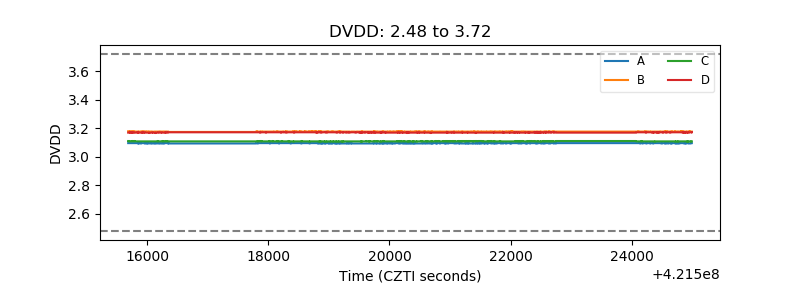 |
| Temperature 1 | 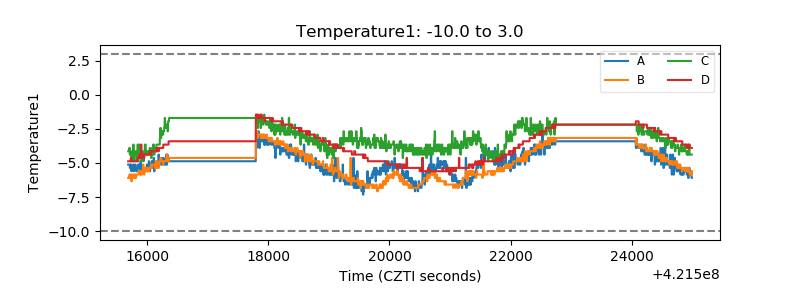 |
| Veto HV Monitor | 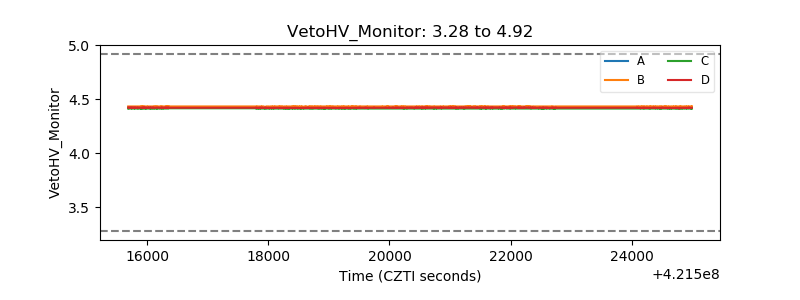 |
| Veto LLD | 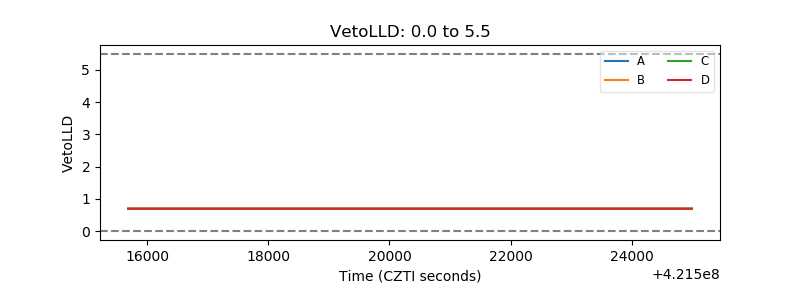 |
| Alpha Counter | 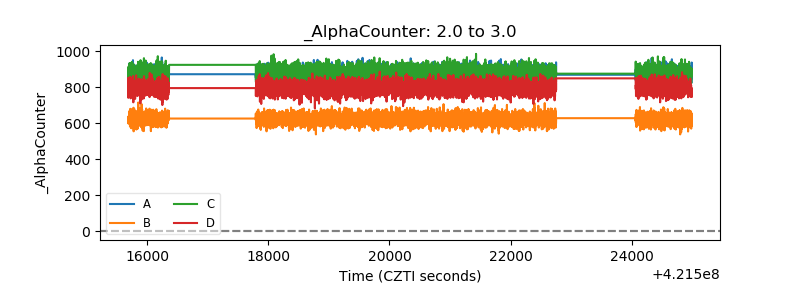 |
| _CPM_Rate | 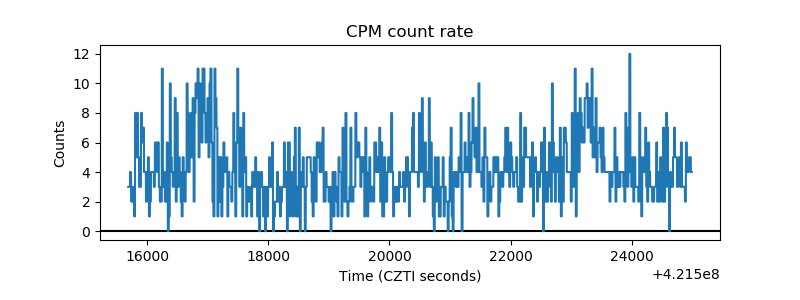 |
| CZT Counter | 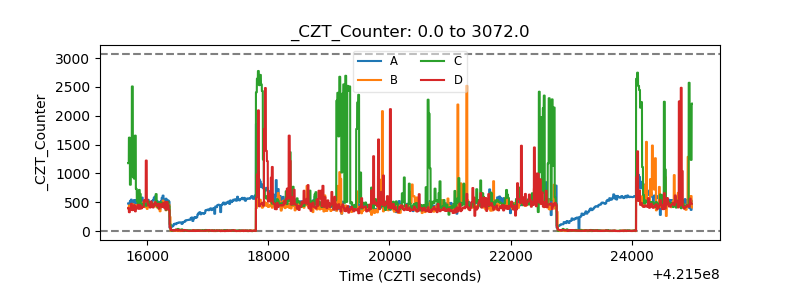 |
| +2.5 Volts monitor | 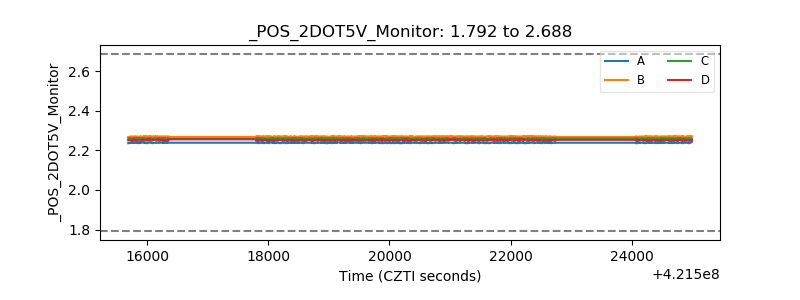 |
| +5 Volts monitor | 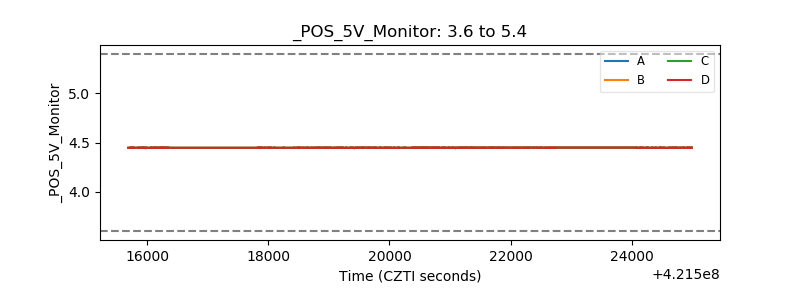 |
| _ROLL_ROT | 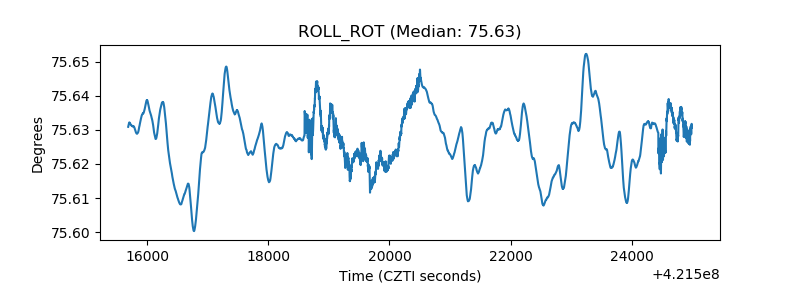 |
| _Roll_DEC | 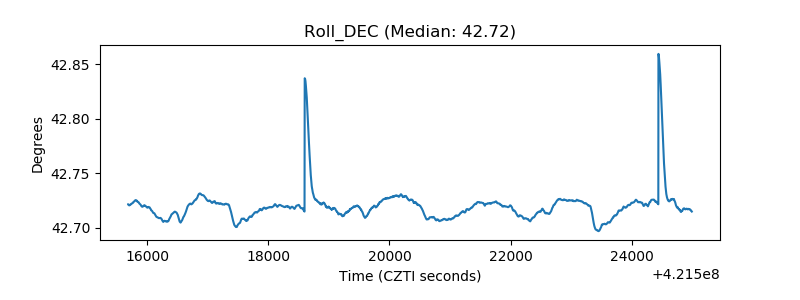 |
| _Roll_RA | 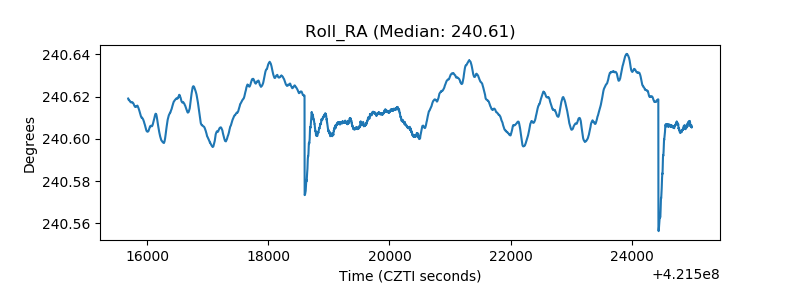 |
| Veto Counter | 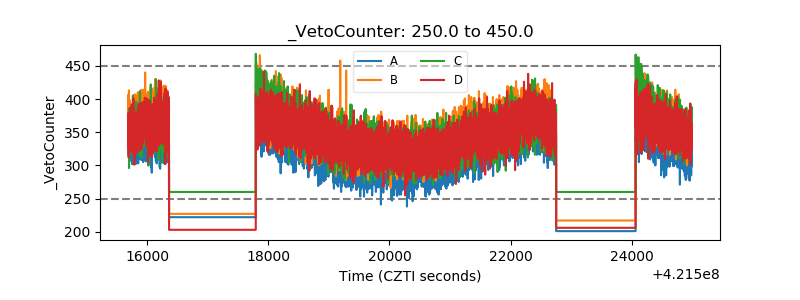 |