| Param | Original file | Final file |
|---|---|---|
| Filename | modeM0/AS1A12_101T03_9000005618_41193cztM0_level2.fits | modeM0/AS1A12_101T03_9000005618_41193cztM0_level2_quad_clean.evt |
| Size (bytes) | 387,354,240 | 89,133,120 |
| Size | 369.4 MB | 85.0 MB |
| Events in quadrant A | 2,910,760 | 616,487 |
| Events in quadrant B | 2,868,055 | 625,842 |
| Events in quadrant C | 5,267,771 | 494,622 |
| Events in quadrant D | 2,845,426 | 561,512 |
| Mode M0 | |||
|---|---|---|---|
| Quadrant | BADHDUFLAG | Total packets | Discarded packets |
| A | 0 | 12262 | 2 |
| B | 0 | 12744 | 2 |
| C | 0 | 19358 | 2 |
| D | 0 | 12868 | 2 |
| Mode M9 | |||
|---|---|---|---|
| Quadrant | BADHDUFLAG | Total packets | Discarded packets |
| A | 0 | 26 | 0 |
| B | 0 | 26 | 0 |
| C | 0 | 26 | 0 |
| D | 0 | 26 | 0 |
| Mode SS | |||
|---|---|---|---|
| Quadrant | BADHDUFLAG | Total packets | Discarded packets |
| A | 0 | 118 | 0 |
| B | 0 | 118 | 0 |
| C | 0 | 118 | 0 |
| D | 0 | 118 | 0 |
| Quadrant | Total seconds | Saturated seconds | Saturation percentage |
|---|---|---|---|
| A | 5730 | 10 | 0.174520% |
| B | 5730 | 87 | 1.518325% |
| C | 5730 | 1167 | 20.366492% |
| D | 5730 | 96 | 1.675393% |
Noise dominated data is calculated using 1-second bins in cleaned event files. If a bin has >2000 counts, and if more than 50% of those come from <1% of pixels, then it is considered to be noise-dominated and hence unusable.
| Quadrant | # 1 sec bins | Bins with >0 counts | Bins with >2000 counts | High rate bins dominated by noise | Noise dominated (total time) | Noise dominated (detector-on time) | Marked lightcurve |
|---|---|---|---|---|---|---|---|
| A | 8355 | 5732 | 3 | 3 | 0.04% | 0.05% | 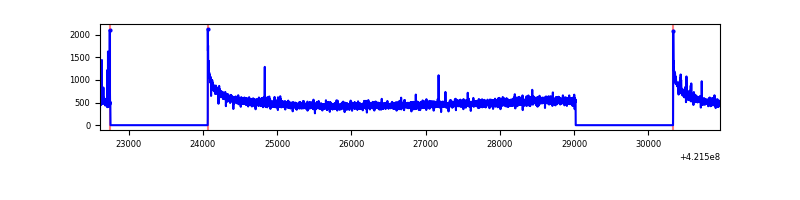 |
| B | 8355 | 5732 | 66 | 66 | 0.79% | 1.15% | 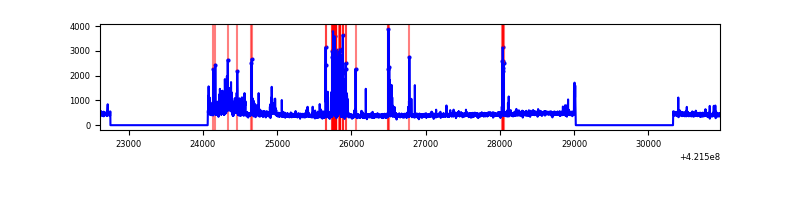 |
| C | 8355 | 5732 | 1115 | 1115 | 13.35% | 19.45% | 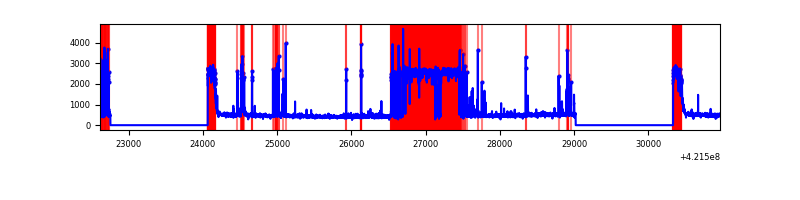 |
| D | 8355 | 5732 | 79 | 79 | 0.95% | 1.38% | 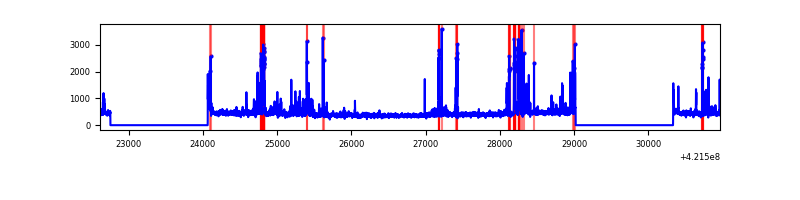 |
Top three noisy pixels from each quadrant. If the there are fewer than three noisy pixels in the level2.evt file, extra rows are filled as -1
| Pixel properties | Quadrant properties | ||||||
|---|---|---|---|---|---|---|---|
| Quadrant | DetID | PixID | Counts | Sigma | Mean | Median | Sigma |
| A | 10 | 83 | 526161 | 4229.77 | 604 | 593 | 124.3 |
| A | 2 | 79 | 18548 | 144.5 | 604 | 593 | 124.3 |
| A | 12 | 189 | 15163 | 117.26 | 604 | 593 | 124.3 |
| B | 5 | 255 | 395581 | 3345.46 | 599 | 583 | 118.1 |
| B | 0 | 229 | 88571 | 745.22 | 599 | 583 | 118.1 |
| B | 0 | 190 | 26283 | 217.67 | 599 | 583 | 118.1 |
| C | 9 | 54 | 2533042 | 21322.42 | 508 | 509 | 118.8 |
| C | 0 | 10 | 538096 | 4526.16 | 508 | 509 | 118.8 |
| C | 15 | 214 | 211134 | 1773.34 | 508 | 509 | 118.8 |
| D | 13 | 249 | 318175 | 2217.97 | 590 | 573 | 143.2 |
| D | 12 | 16 | 165718 | 1153.29 | 590 | 573 | 143.2 |
| D | 2 | 234 | 29897 | 204.78 | 590 | 573 | 143.2 |
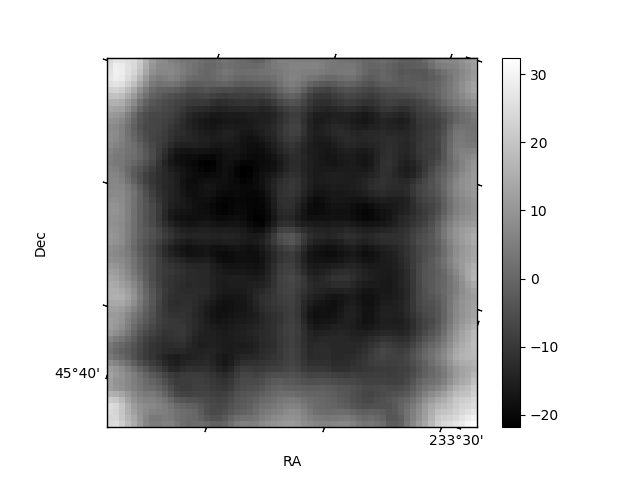
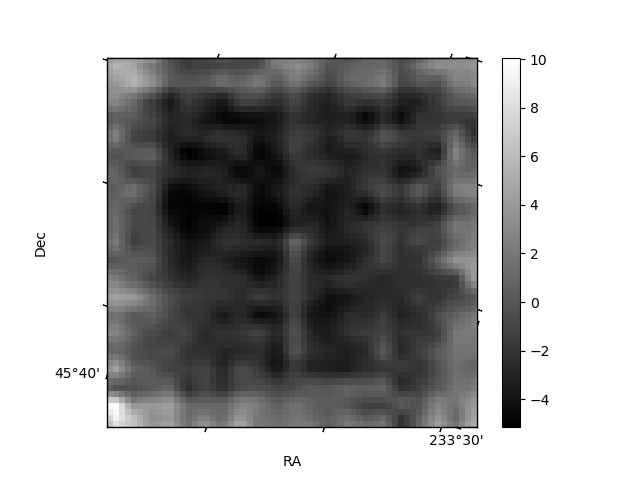
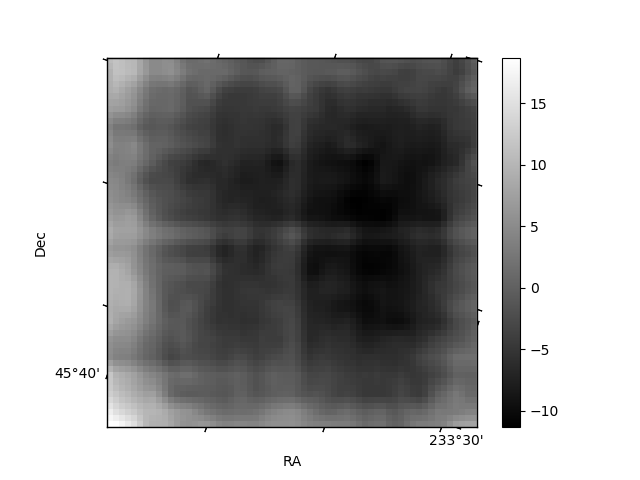
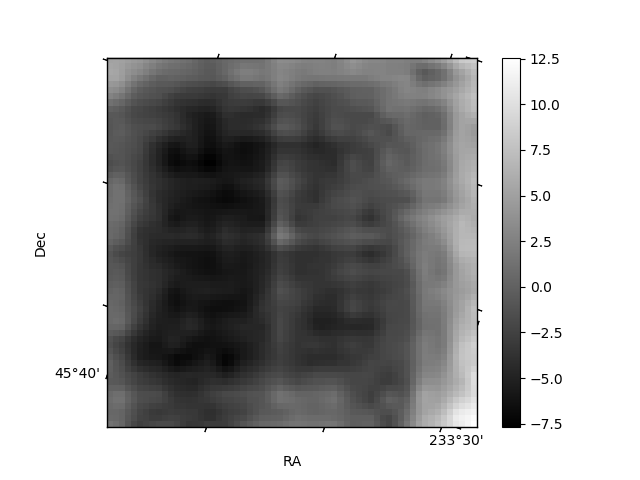
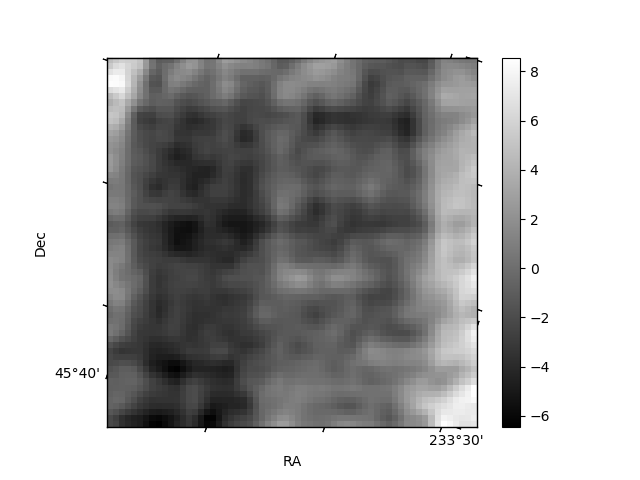
Histogram calculated using DETX and DETY for each event in the final _common_clean file
| Quadrant A | 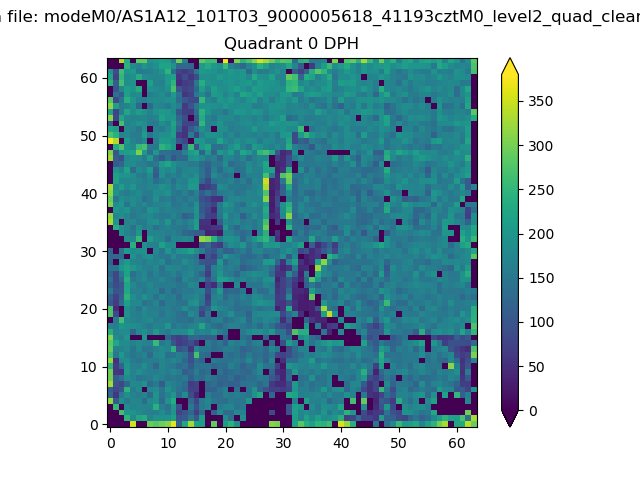 |
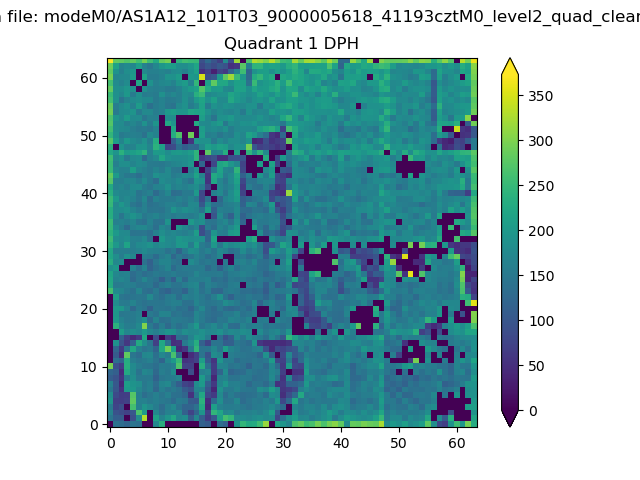 |
Quadrant B |
|---|---|---|---|
| Quadrant D | 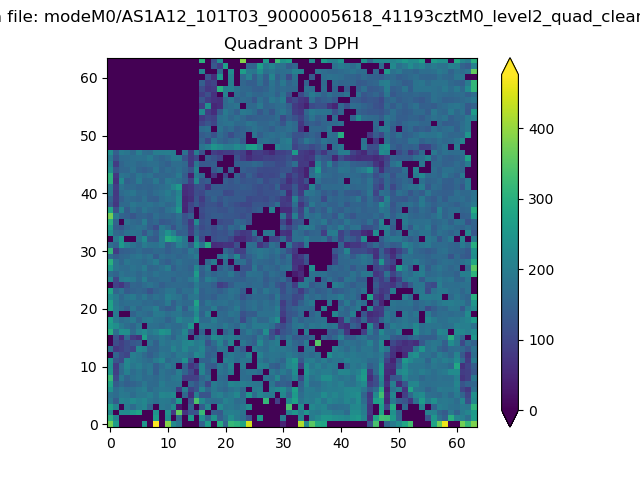 |
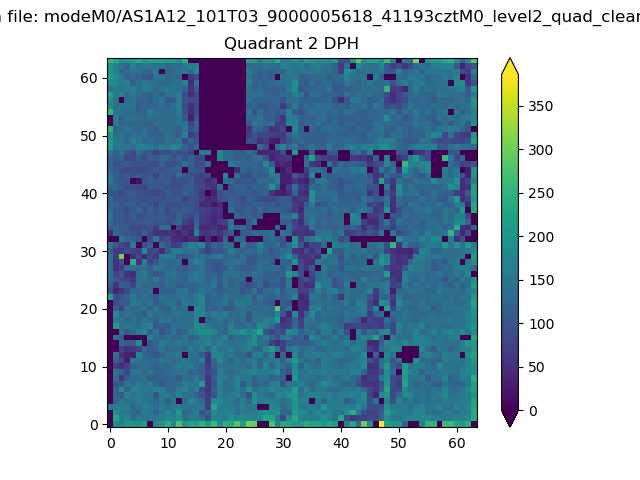 |
Quadrant C |
| Plot type | Count rate plots | Images |
|---|---|---|
| Comparison with Poisson distribution Blue bars denote a histogram of data divided into 1 sec bins. Red curve is a Poisson curve with rate = median count rate of data. |
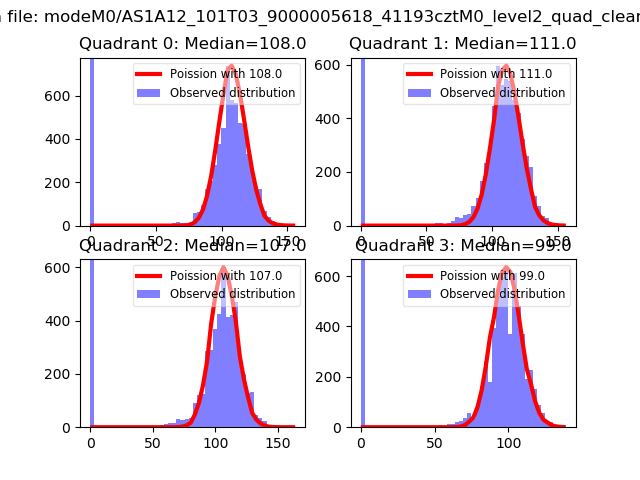 |
 |
| Quadrant-wise count rates Data is divided into 100 sec bins |
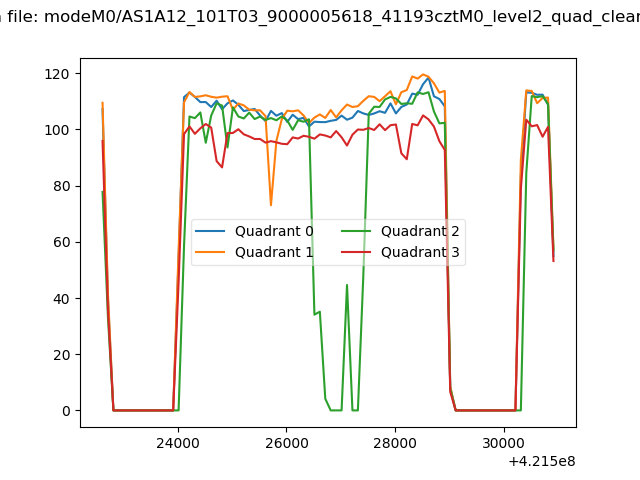 |
|
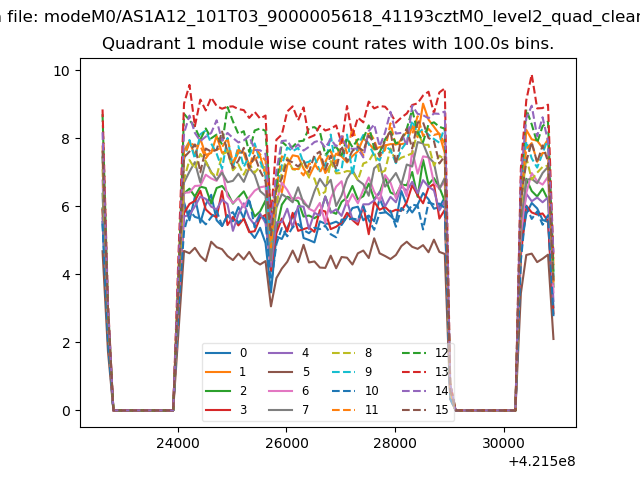
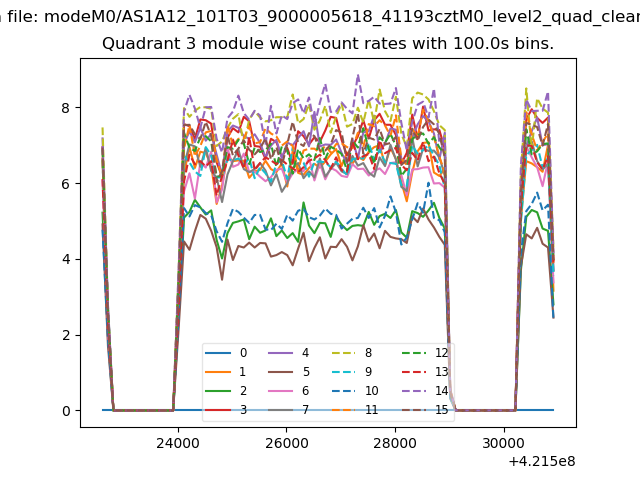
| Module-wise count rates for Quadrant A Data is divided into 100 sec bins |
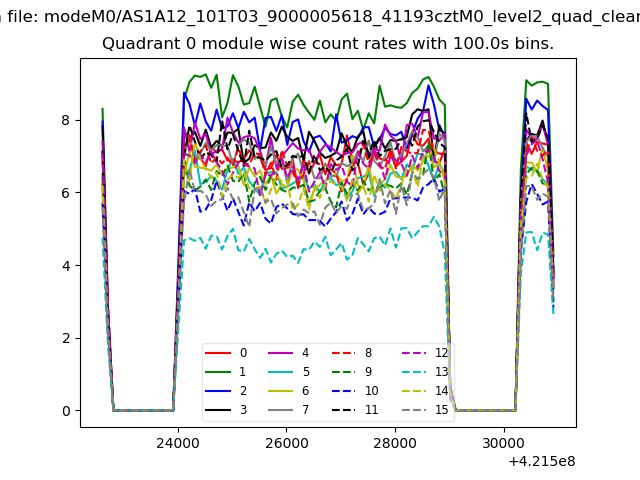 |
 |
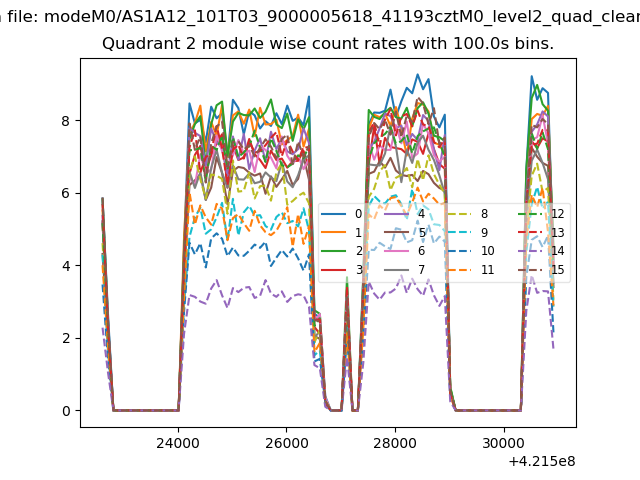
| Module-wise count rates for Quadrant B Data is divided into 100 sec bins |
 |
 |
| Module-wise count rates for Quadrant C Data is divided into 100 sec bins |
 |
 |
| Module-wise count rates for Quadrant D Data is divided into 100 sec bins |
 |
 |
| Parameter | Plot |
|---|---|
| CZT HV Monitor | 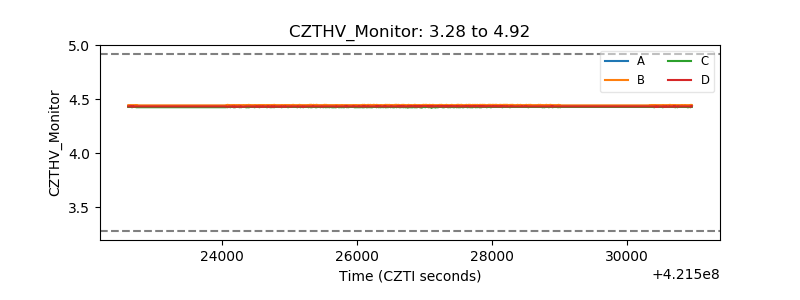 |
| D_VDD | 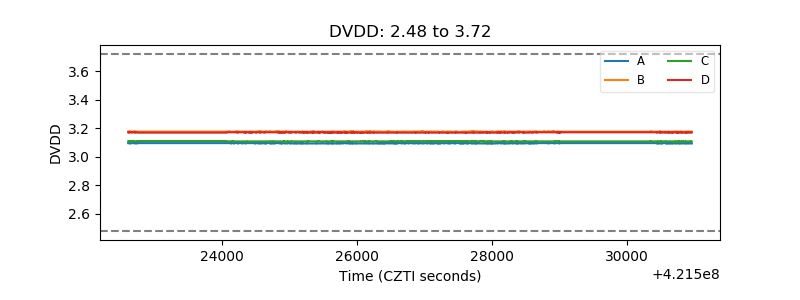 |
| Temperature 1 | 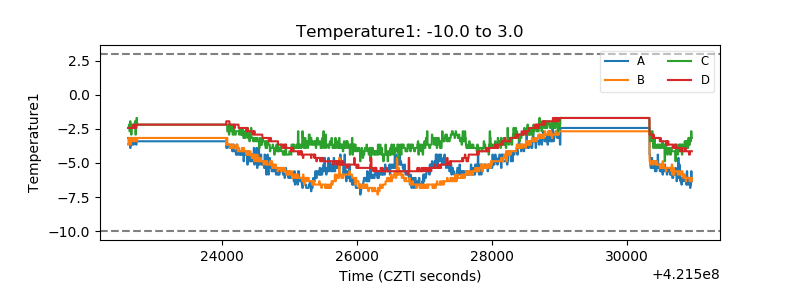 |
| Veto HV Monitor | 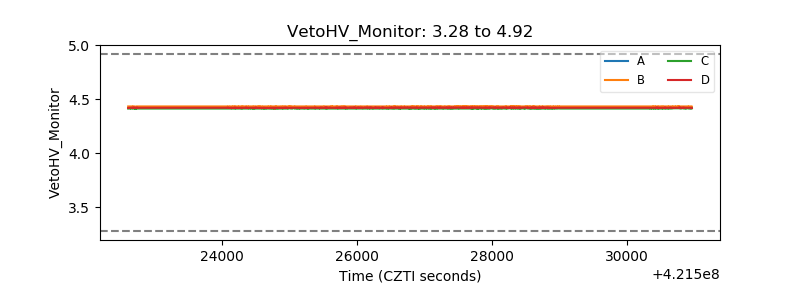 |
| Veto LLD | 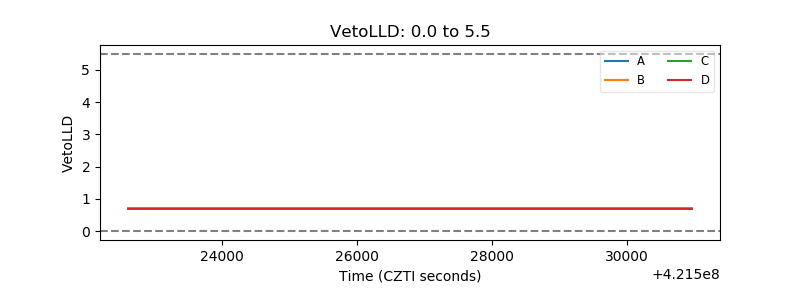 |
| Alpha Counter | 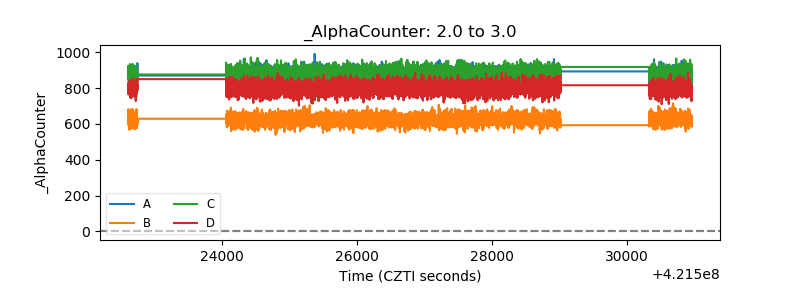 |
| _CPM_Rate | 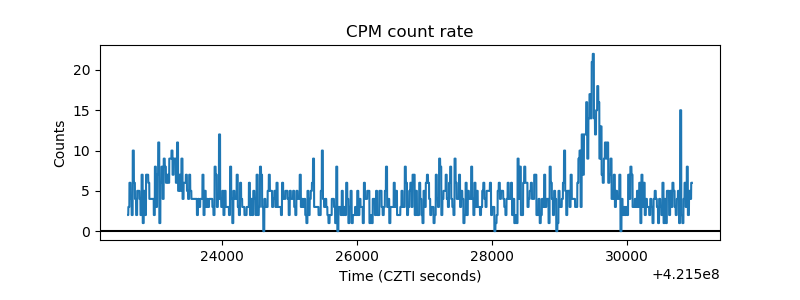 |
| CZT Counter | 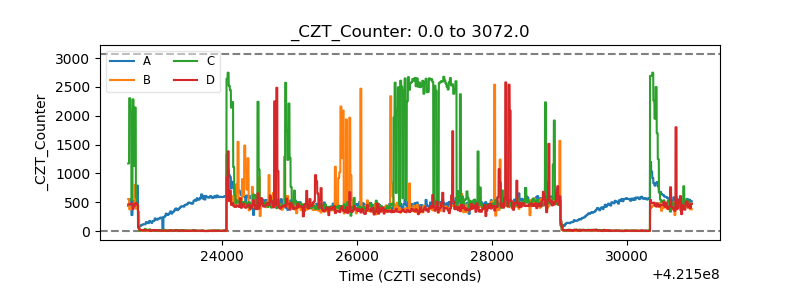 |
| +2.5 Volts monitor | 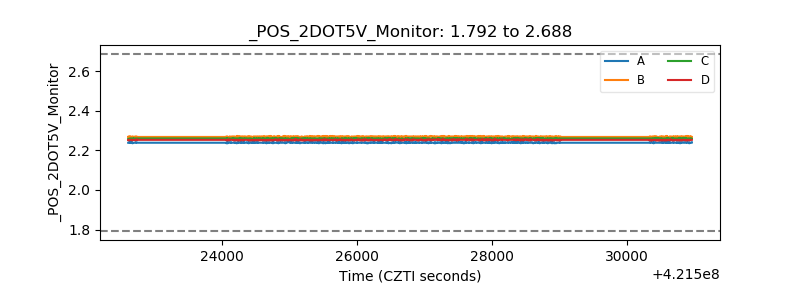 |
| +5 Volts monitor | 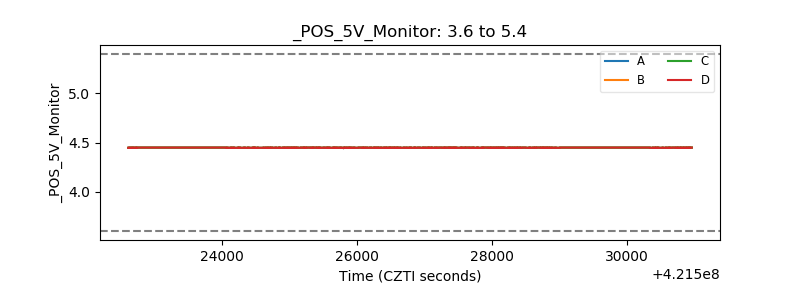 |
| _ROLL_ROT | 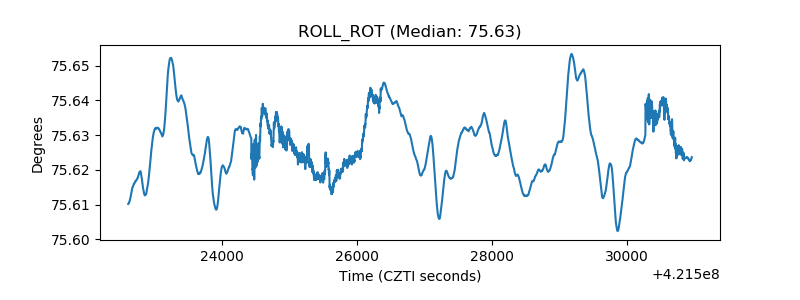 |
| _Roll_DEC | 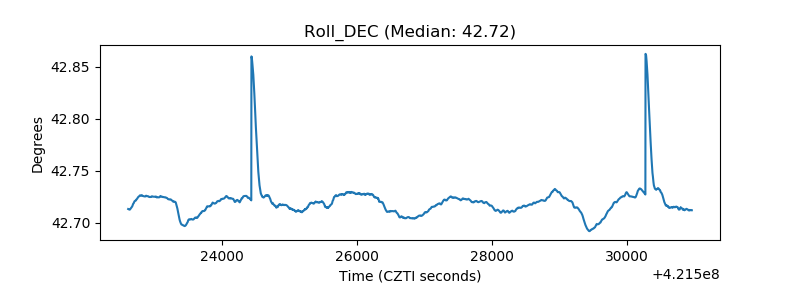 |
| _Roll_RA | 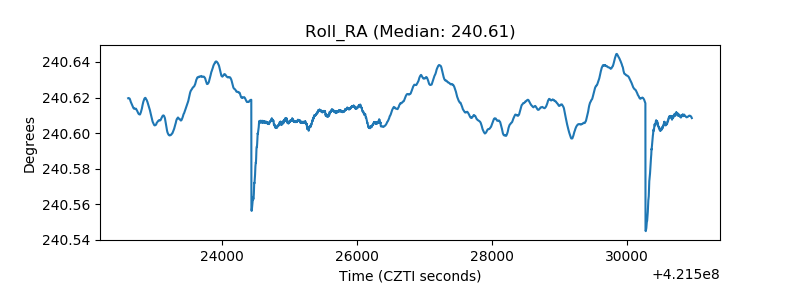 |
| Veto Counter | 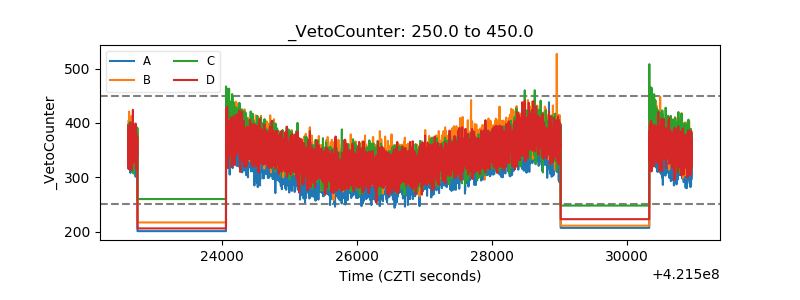 |