| Param | Original file | Final file |
|---|---|---|
| Filename | modeM0/AS1A12_089T09_9000005630_41208cztM0_level2.fits | modeM0/AS1A12_089T09_9000005630_41208cztM0_level2_quad_clean.evt |
| Size (bytes) | 333,253,440 | 92,802,240 |
| Size | 317.8 MB | 88.5 MB |
| Events in quadrant A | 2,895,992 | 617,472 |
| Events in quadrant B | 3,150,271 | 629,726 |
| Events in quadrant C | 2,718,043 | 603,312 |
| Events in quadrant D | 3,124,366 | 557,840 |
| Mode M0 | |||
|---|---|---|---|
| Quadrant | BADHDUFLAG | Total packets | Discarded packets |
| A | 0 | 12166 | 1 |
| B | 0 | 13644 | 1 |
| C | 0 | 11882 | 1 |
| D | 0 | 13650 | 1 |
| Mode M9 | |||
|---|---|---|---|
| Quadrant | BADHDUFLAG | Total packets | Discarded packets |
| A | 0 | 14 | 0 |
| B | 0 | 14 | 0 |
| C | 0 | 14 | 0 |
| D | 0 | 14 | 0 |
| Mode SS | |||
|---|---|---|---|
| Quadrant | BADHDUFLAG | Total packets | Discarded packets |
| A | 0 | 118 | 0 |
| B | 0 | 118 | 0 |
| C | 0 | 118 | 0 |
| D | 0 | 118 | 0 |
| Quadrant | Total seconds | Saturated seconds | Saturation percentage |
|---|---|---|---|
| A | 5743 | 10 | 0.174125% |
| B | 5743 | 89 | 1.549713% |
| C | 5743 | 40 | 0.696500% |
| D | 5743 | 48 | 0.835800% |
Noise dominated data is calculated using 1-second bins in cleaned event files. If a bin has >2000 counts, and if more than 50% of those come from <1% of pixels, then it is considered to be noise-dominated and hence unusable.
| Quadrant | # 1 sec bins | Bins with >0 counts | Bins with >2000 counts | High rate bins dominated by noise | Noise dominated (total time) | Noise dominated (detector-on time) | Marked lightcurve |
|---|---|---|---|---|---|---|---|
| A | 7146 | 5744 | 1 | 1 | 0.01% | 0.02% | 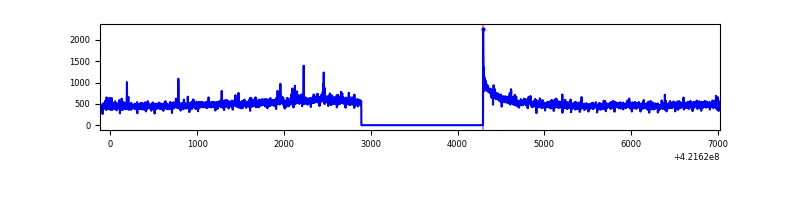 |
| B | 7146 | 5744 | 34 | 34 | 0.48% | 0.59% | 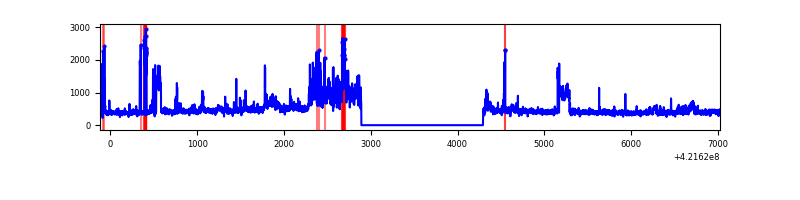 |
| C | 7146 | 5744 | 33 | 33 | 0.46% | 0.57% | 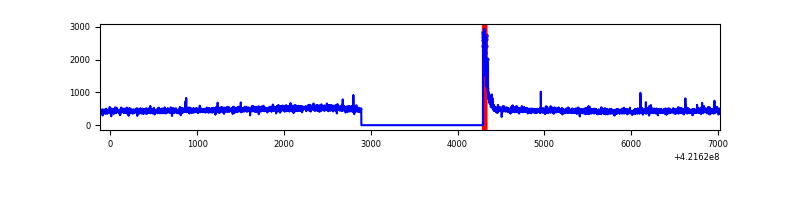 |
| D | 7146 | 5744 | 39 | 39 | 0.55% | 0.68% | 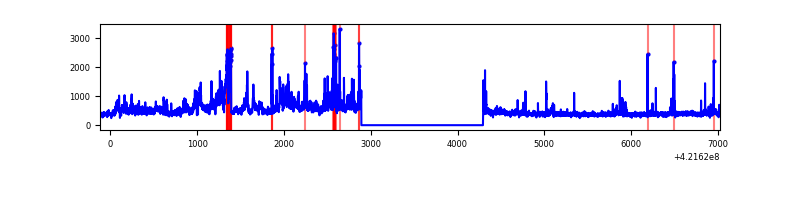 |
Top three noisy pixels from each quadrant. If the there are fewer than three noisy pixels in the level2.evt file, extra rows are filled as -1
| Pixel properties | Quadrant properties | ||||||
|---|---|---|---|---|---|---|---|
| Quadrant | DetID | PixID | Counts | Sigma | Mean | Median | Sigma |
| A | 10 | 83 | 430432 | 3392.81 | 615 | 602 | 126.7 |
| A | 12 | 189 | 57927 | 452.49 | 615 | 602 | 126.7 |
| A | 2 | 79 | 19843 | 151.88 | 615 | 602 | 126.7 |
| B | 0 | 229 | 384140 | 3234.44 | 605 | 587 | 118.6 |
| B | 0 | 186 | 337985 | 2845.22 | 605 | 587 | 118.6 |
| B | 5 | 255 | 53612 | 447.15 | 605 | 587 | 118.6 |
| C | 15 | 214 | 240755 | 1702.25 | 602 | 606 | 141.1 |
| C | 0 | 10 | 116317 | 820.2 | 602 | 606 | 141.1 |
| C | 14 | 254 | 7534 | 49.11 | 602 | 606 | 141.1 |
| D | 6 | 112 | 668921 | 4505.48 | 602 | 586 | 148.3 |
| D | 2 | 249 | 47803 | 318.31 | 602 | 586 | 148.3 |
| D | 12 | 16 | 40025 | 265.87 | 602 | 586 | 148.3 |
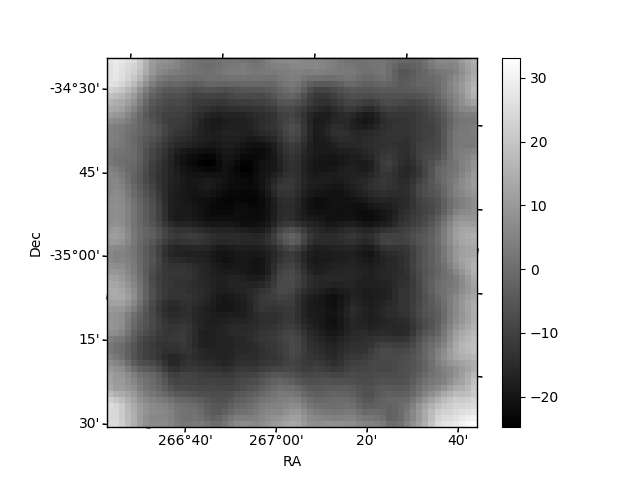
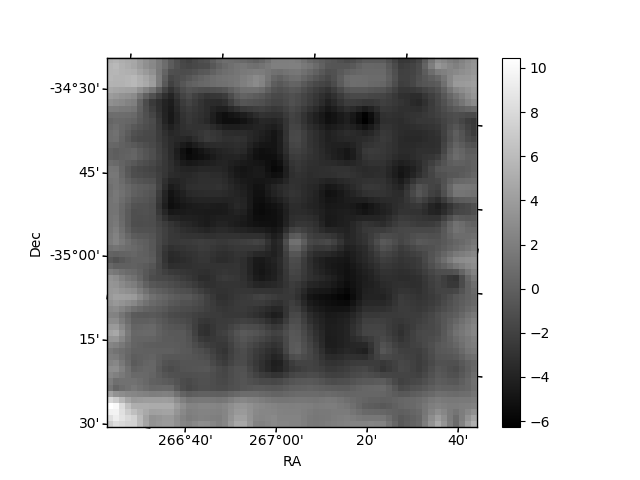
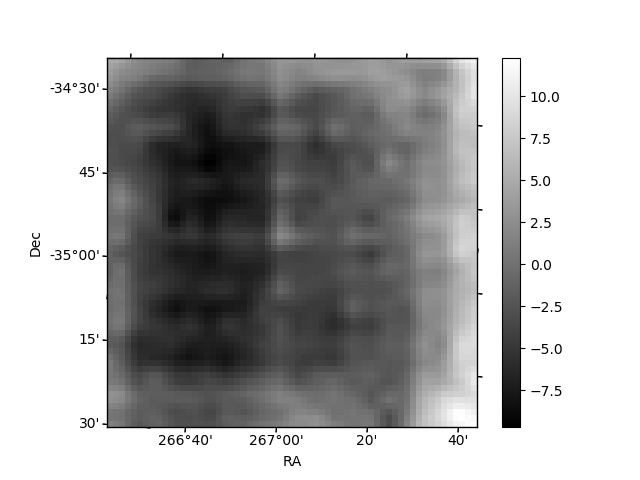
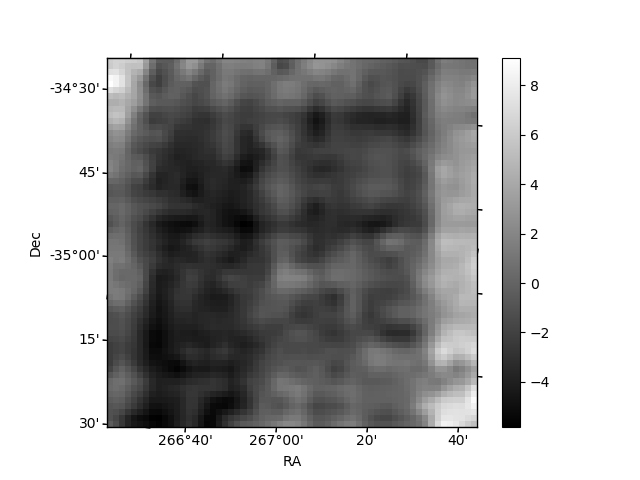
Histogram calculated using DETX and DETY for each event in the final _common_clean file
| Quadrant A | 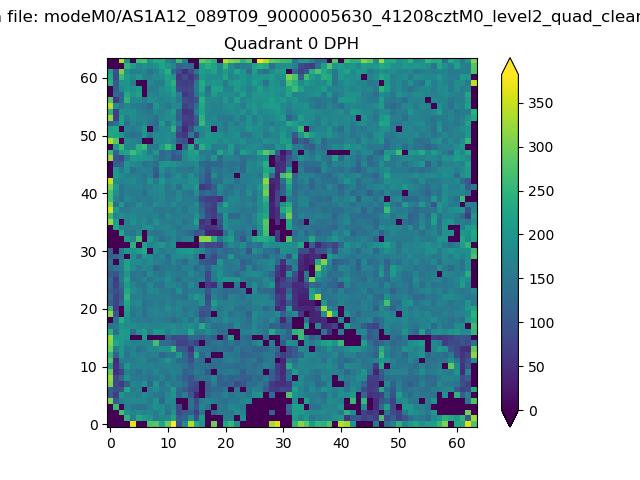 |
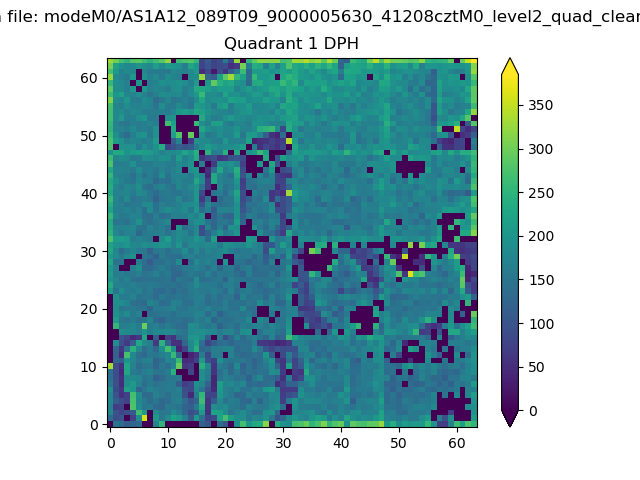 |
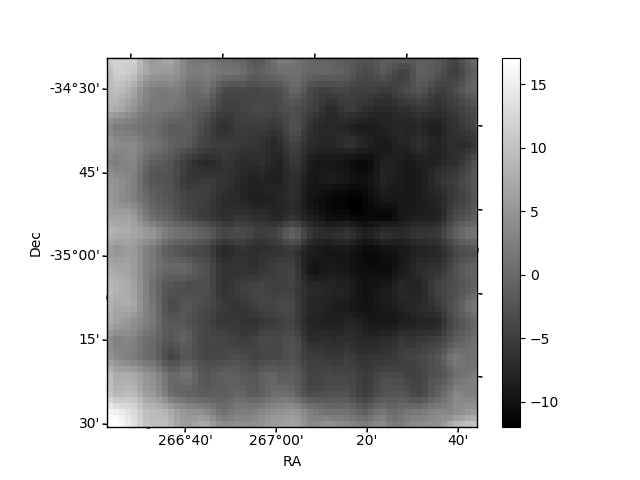
Quadrant B |
|---|---|---|---|
| Quadrant D | 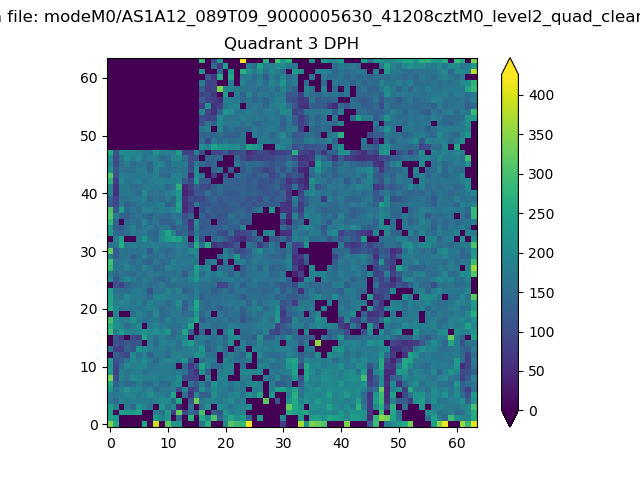 |
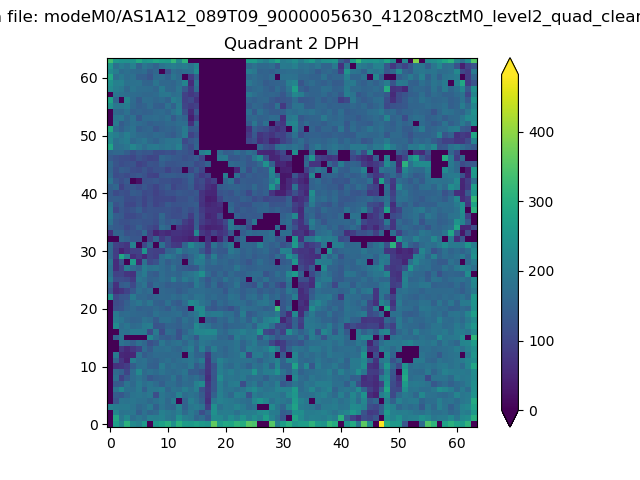 |
Quadrant C |
| Plot type | Count rate plots | Images |
|---|---|---|
| Comparison with Poisson distribution Blue bars denote a histogram of data divided into 1 sec bins. Red curve is a Poisson curve with rate = median count rate of data. |
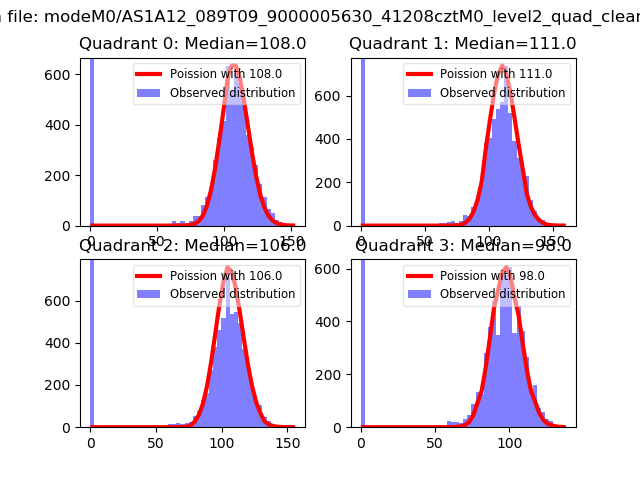 |
 |
| Quadrant-wise count rates Data is divided into 100 sec bins |
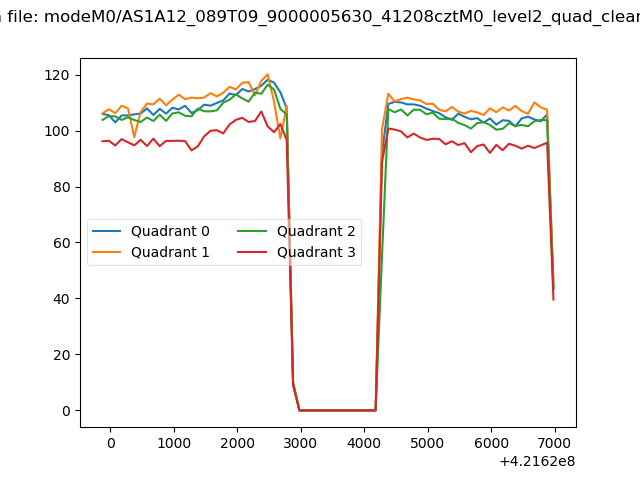 |
|
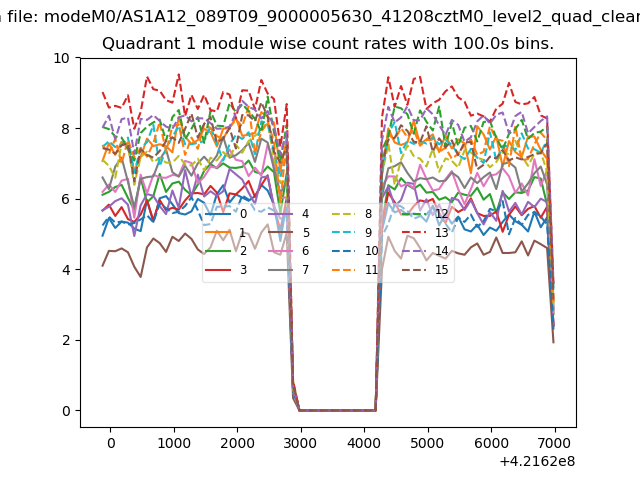
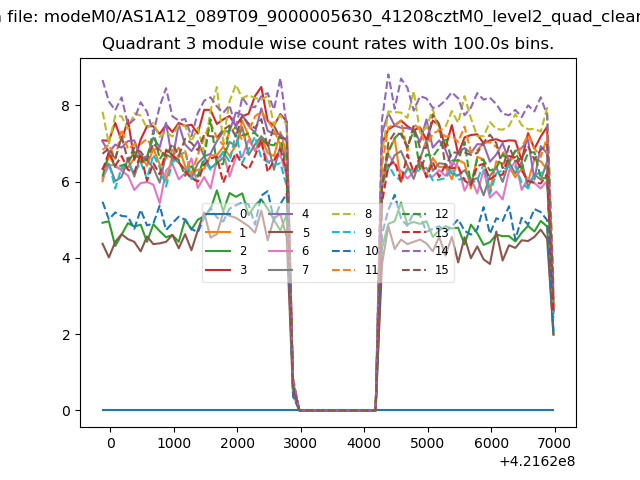
| Module-wise count rates for Quadrant A Data is divided into 100 sec bins |
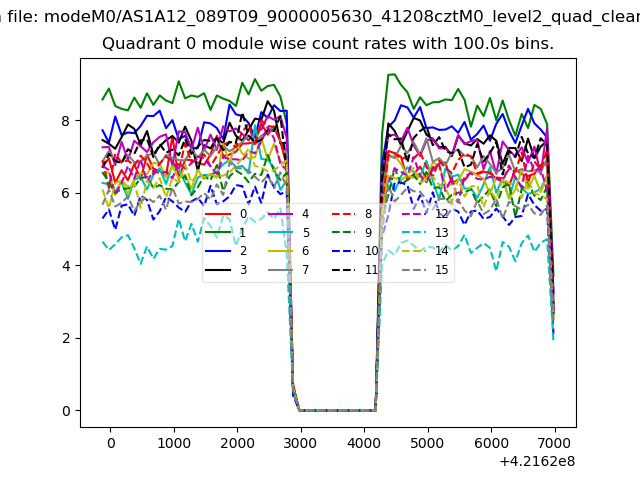 |
 |
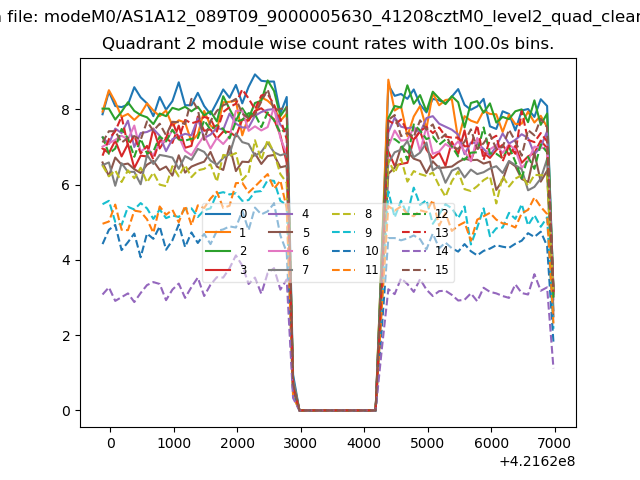
| Module-wise count rates for Quadrant B Data is divided into 100 sec bins |
 |
 |
| Module-wise count rates for Quadrant C Data is divided into 100 sec bins |
 |
 |
| Module-wise count rates for Quadrant D Data is divided into 100 sec bins |
 |
 |
| Parameter | Plot |
|---|---|
| CZT HV Monitor | 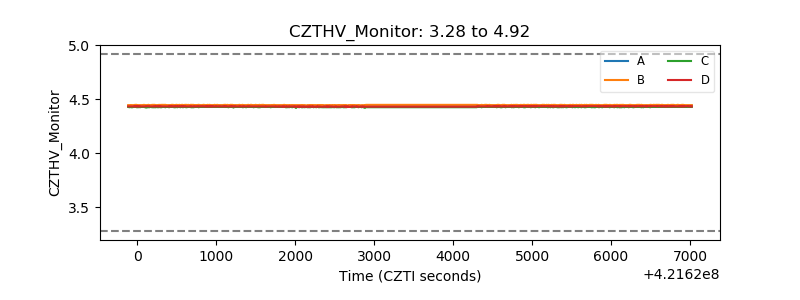 |
| D_VDD | 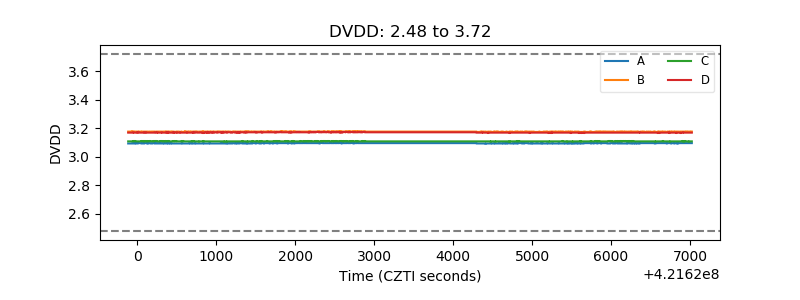 |
| Temperature 1 | 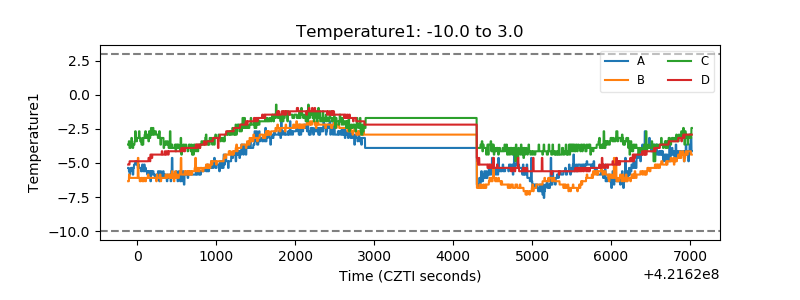 |
| Veto HV Monitor |  |
| Veto LLD | 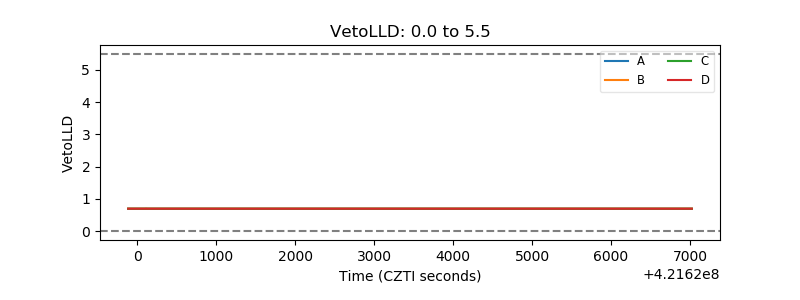 |
| Alpha Counter | 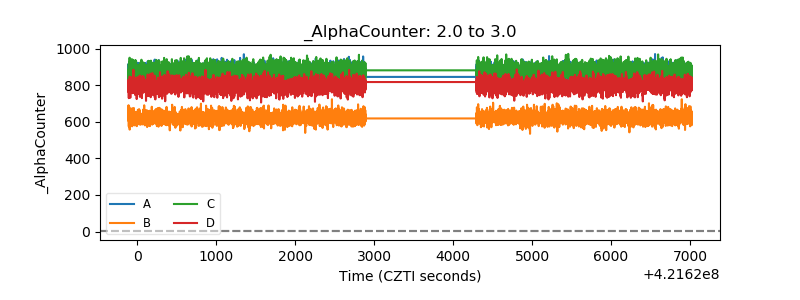 |
| _CPM_Rate | 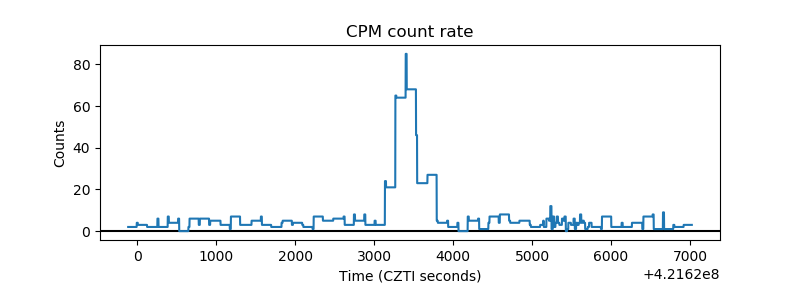 |
| CZT Counter | 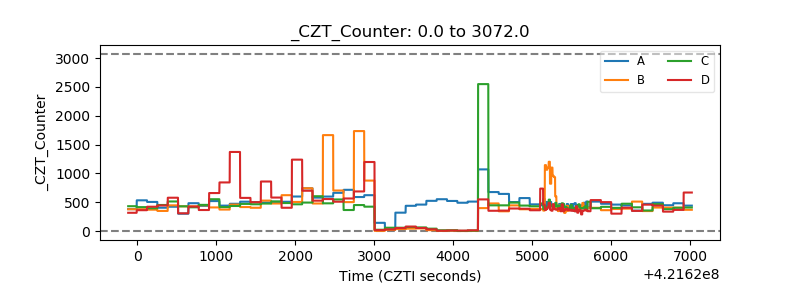 |
| +2.5 Volts monitor | 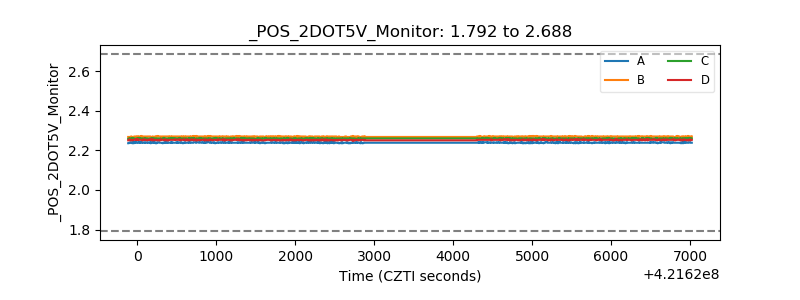 |
| +5 Volts monitor | 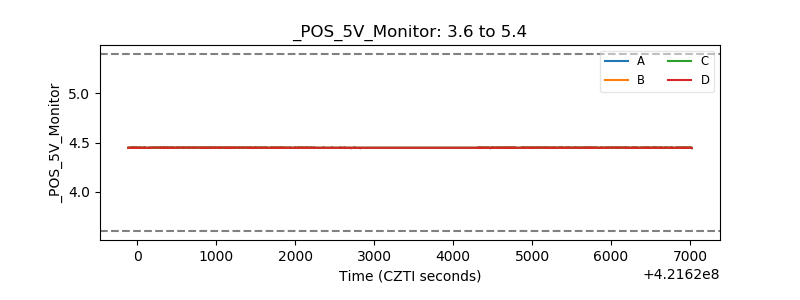 |
| _ROLL_ROT | 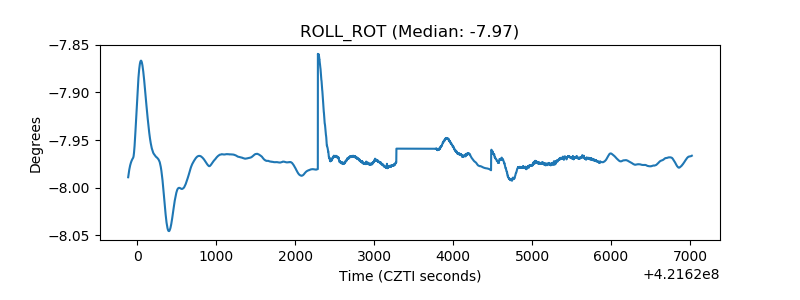 |
| _Roll_DEC | 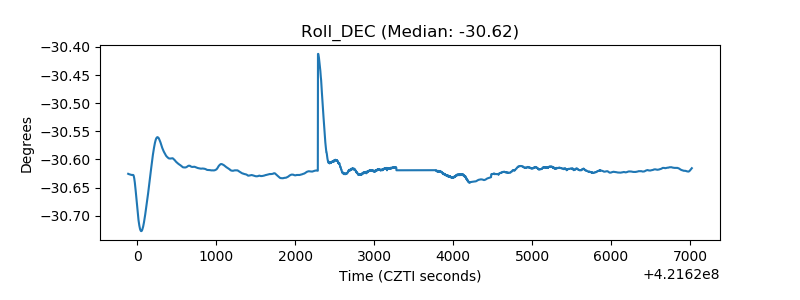 |
| _Roll_RA | 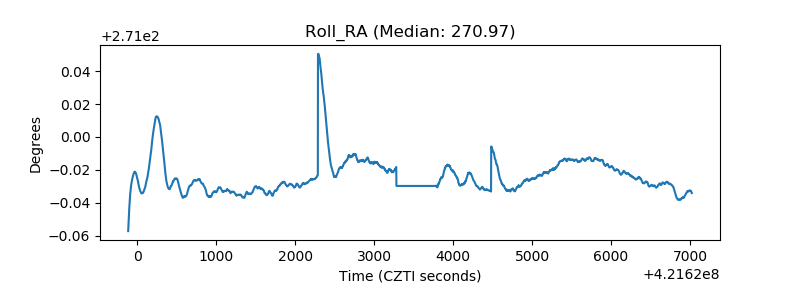 |
| Veto Counter | 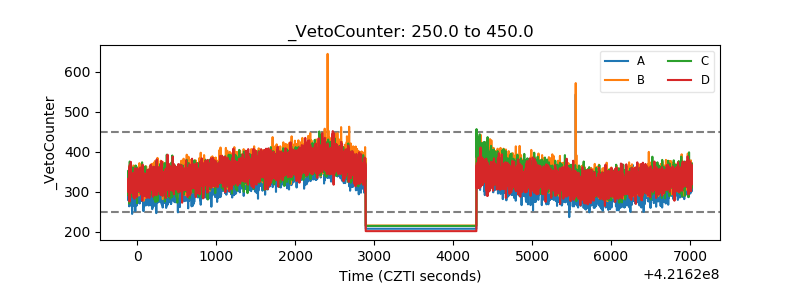 |