| Param | Original file | Final file |
|---|---|---|
| Filename | modeM0/AS1A12_089T12_9000005626_41204cztM0_level2.fits | modeM0/AS1A12_089T12_9000005626_41204cztM0_level2_quad_clean.evt |
| Size (bytes) | 318,067,200 | 68,662,080 |
| Size | 303.3 MB | 65.5 MB |
| Events in quadrant A | 2,226,967 | 485,734 |
| Events in quadrant B | 3,861,313 | 407,126 |
| Events in quadrant C | 2,316,036 | 461,187 |
| Events in quadrant D | 3,024,845 | 414,494 |
| Mode M9 | |||
|---|---|---|---|
| Quadrant | BADHDUFLAG | Total packets | Discarded packets |
| A | 0 | 11 | 0 |
| B | 0 | 11 | 0 |
| C | 0 | 11 | 0 |
| D | 0 | 11 | 0 |
| Mode SS | |||
|---|---|---|---|
| Quadrant | BADHDUFLAG | Total packets | Discarded packets |
| A | 0 | 88 | 0 |
| B | 0 | 88 | 0 |
| C | 0 | 88 | 0 |
| D | 0 | 88 | 0 |
| Mode M0 | |||
|---|---|---|---|
| Quadrant | BADHDUFLAG | Total packets | Discarded packets |
| A | 0 | 9349 | 1 |
| B | 0 | 14613 | 1 |
| C | 0 | 9858 | 1 |
| D | 0 | 12320 | 1 |
| Quadrant | Total seconds | Saturated seconds | Saturation percentage |
|---|---|---|---|
| A | 4414 | 9 | 0.203897% |
| B | 4414 | 870 | 19.710014% |
| C | 4414 | 110 | 2.492071% |
| D | 4414 | 298 | 6.751246% |
Noise dominated data is calculated using 1-second bins in cleaned event files. If a bin has >2000 counts, and if more than 50% of those come from <1% of pixels, then it is considered to be noise-dominated and hence unusable.
| Quadrant | # 1 sec bins | Bins with >0 counts | Bins with >2000 counts | High rate bins dominated by noise | Noise dominated (total time) | Noise dominated (detector-on time) | Marked lightcurve |
|---|---|---|---|---|---|---|---|
| A | 4414 | 4414 | 3 | 3 | 0.07% | 0.07% | 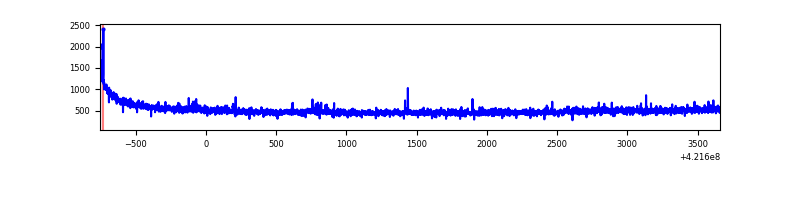 |
| B | 4414 | 4414 | 598 | 598 | 13.55% | 13.55% | 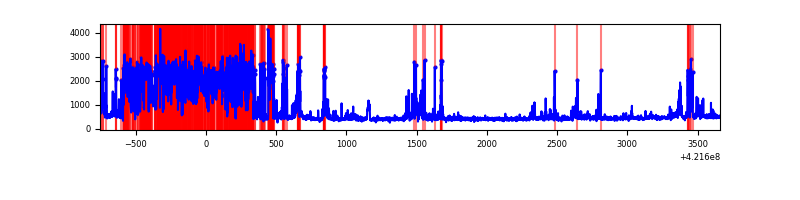 |
| C | 4414 | 4414 | 106 | 106 | 2.40% | 2.40% | 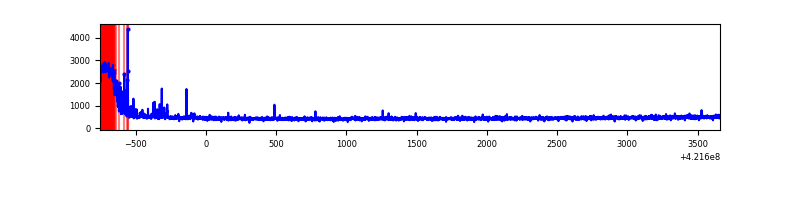 |
| D | 4414 | 4414 | 281 | 281 | 6.37% | 6.37% | 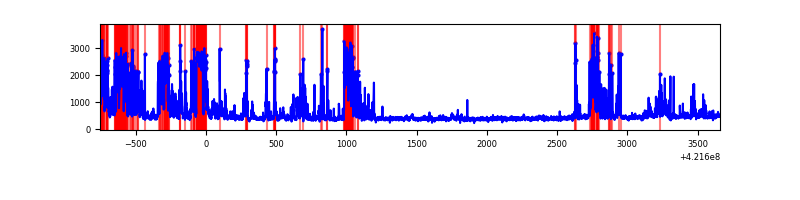 |
Top three noisy pixels from each quadrant. If the there are fewer than three noisy pixels in the level2.evt file, extra rows are filled as -1
| Pixel properties | Quadrant properties | ||||||
|---|---|---|---|---|---|---|---|
| Quadrant | DetID | PixID | Counts | Sigma | Mean | Median | Sigma |
| A | 10 | 83 | 368042 | 3784.35 | 469 | 461 | 97.1 |
| A | 12 | 189 | 39488 | 401.79 | 469 | 461 | 97.1 |
| A | 13 | 254 | 6453 | 61.69 | 469 | 461 | 97.1 |
| B | 5 | 255 | 1721240 | 20957.55 | 417 | 406 | 82.1 |
| B | 0 | 229 | 459263 | 5588.29 | 417 | 406 | 82.1 |
| B | 5 | 185 | 22155 | 264.87 | 417 | 406 | 82.1 |
| C | 0 | 10 | 260794 | 2438.83 | 454 | 458 | 106.7 |
| C | 15 | 214 | 180295 | 1684.71 | 454 | 458 | 106.7 |
| C | 14 | 254 | 99882 | 931.4 | 454 | 458 | 106.7 |
| D | 12 | 16 | 798502 | 7182.97 | 447 | 434 | 111.1 |
| D | 13 | 249 | 359663 | 3233.22 | 447 | 434 | 111.1 |
| D | 2 | 249 | 88631 | 793.81 | 447 | 434 | 111.1 |
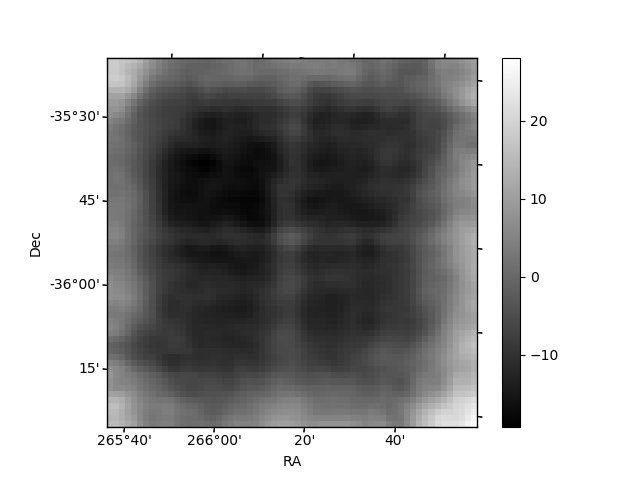
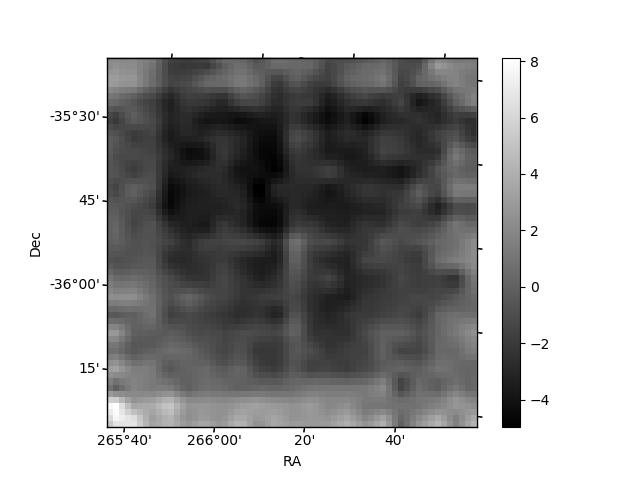
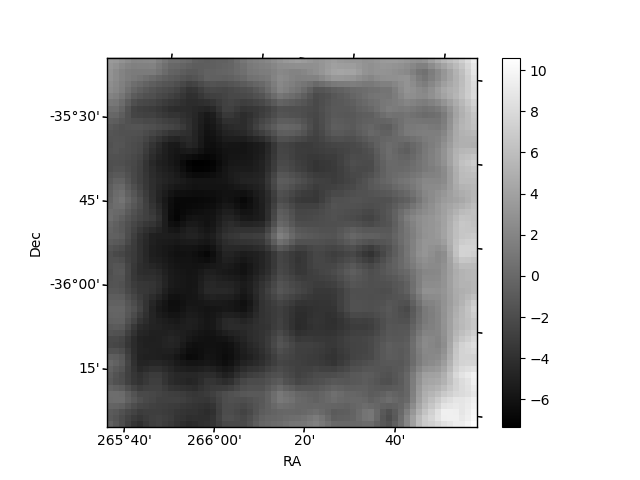
Histogram calculated using DETX and DETY for each event in the final _common_clean file
| Quadrant A | 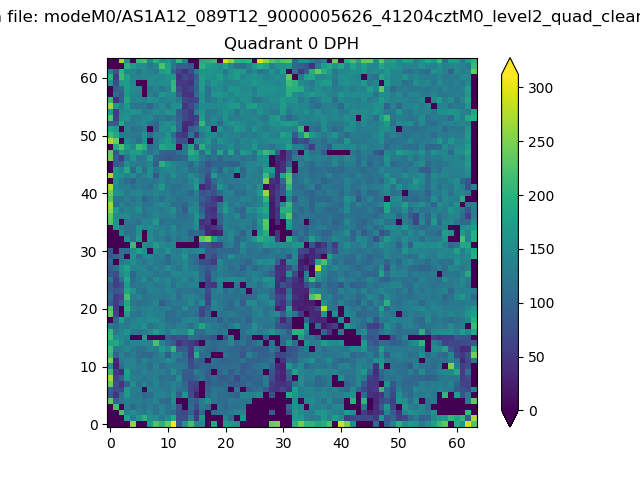 |
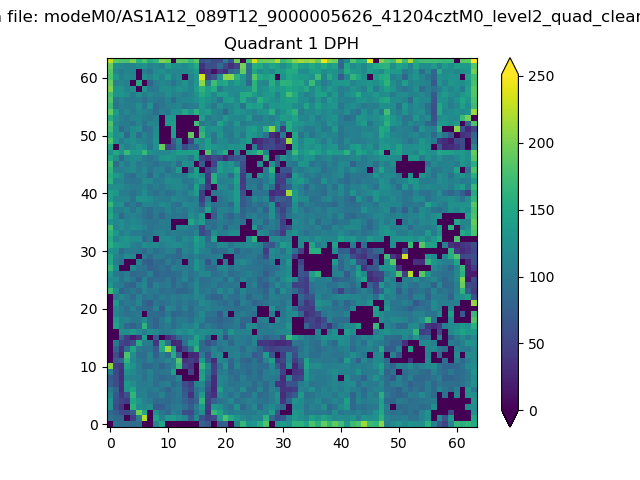 |
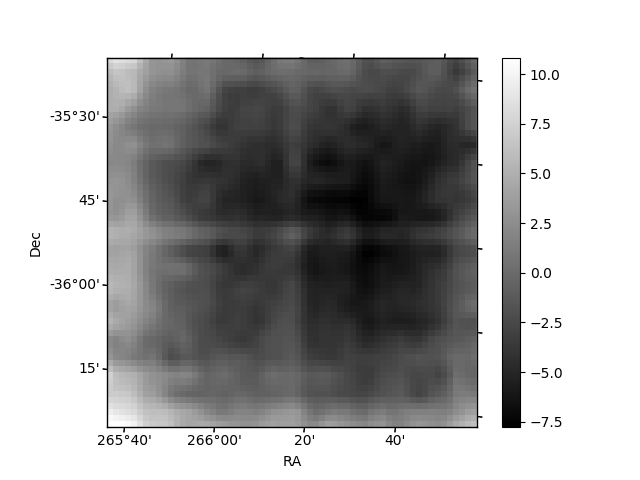
Quadrant B |
|---|---|---|---|
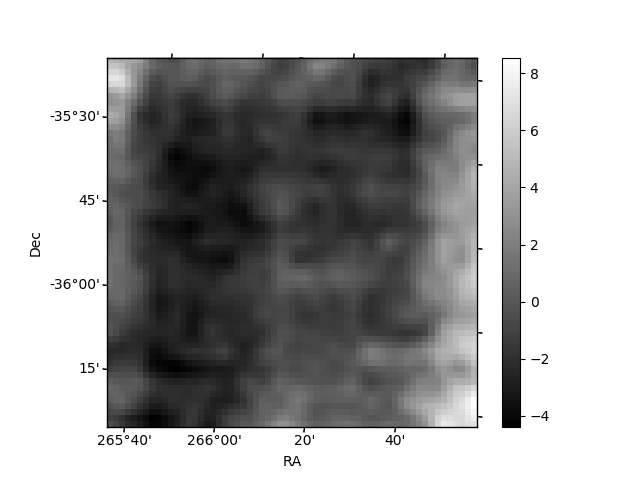
| Quadrant D | 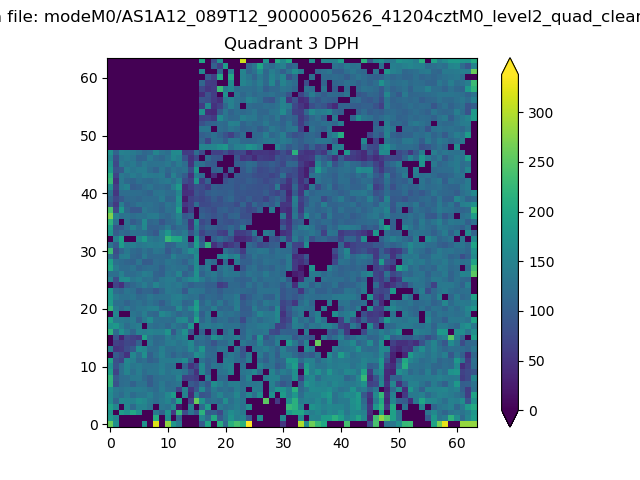 |
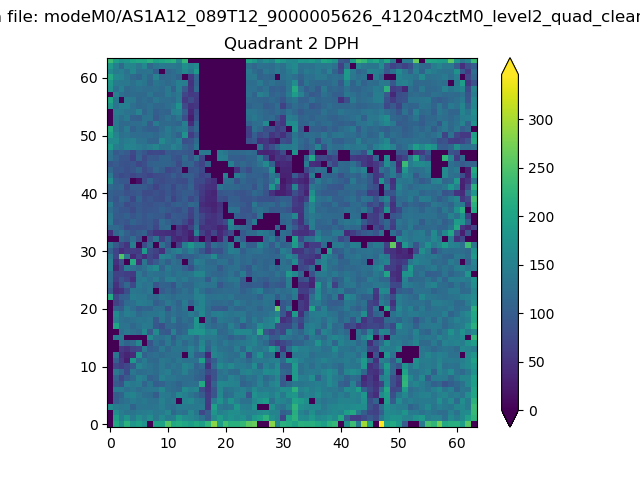 |
Quadrant C |
| Plot type | Count rate plots | Images |
|---|---|---|
| Comparison with Poisson distribution Blue bars denote a histogram of data divided into 1 sec bins. Red curve is a Poisson curve with rate = median count rate of data. |
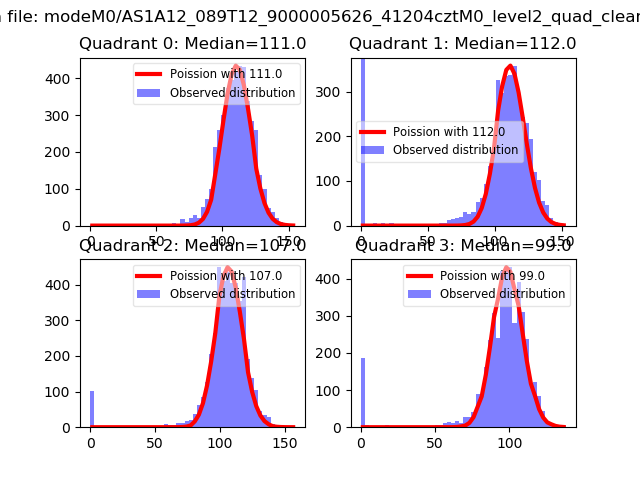 |
 |
| Quadrant-wise count rates Data is divided into 100 sec bins |
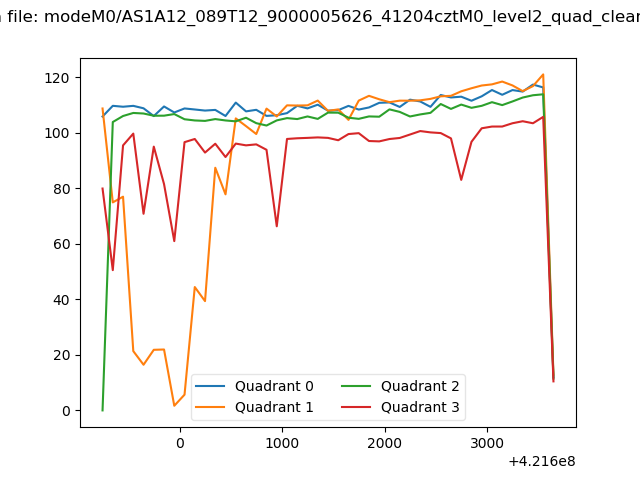 |
|
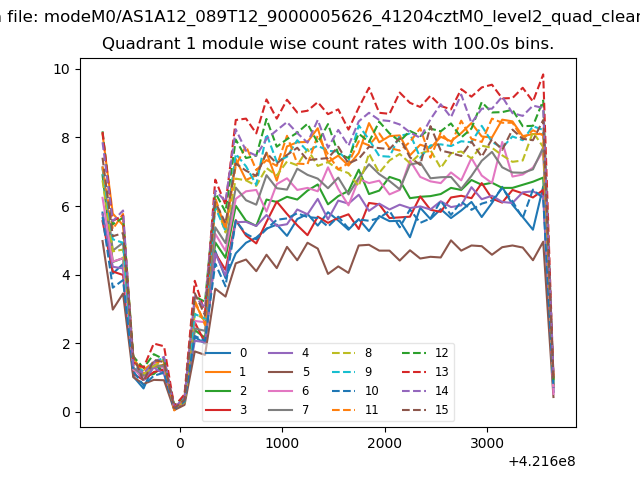
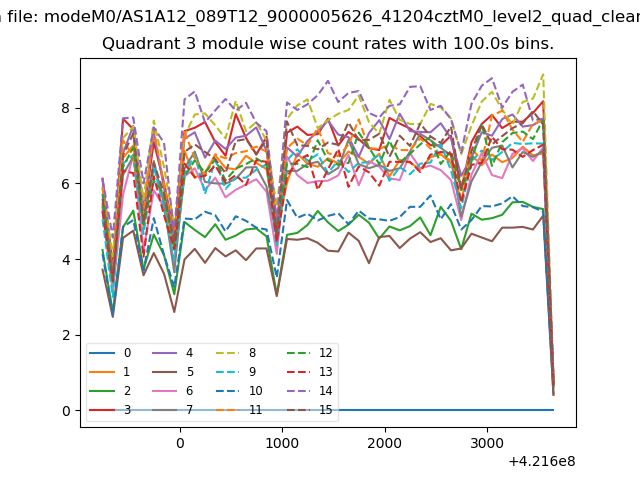
| Module-wise count rates for Quadrant A Data is divided into 100 sec bins |
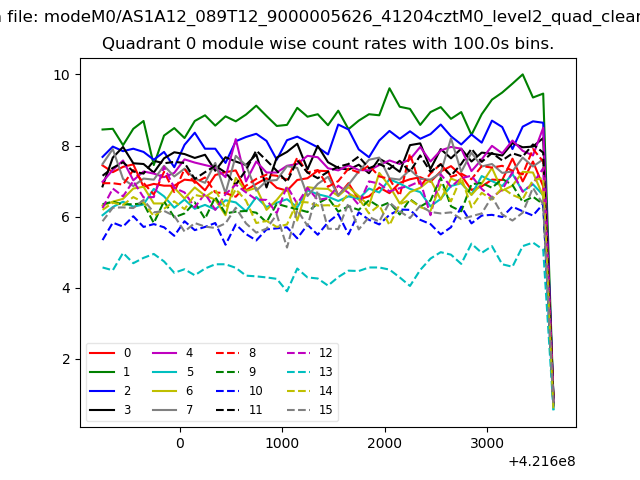 |
 |
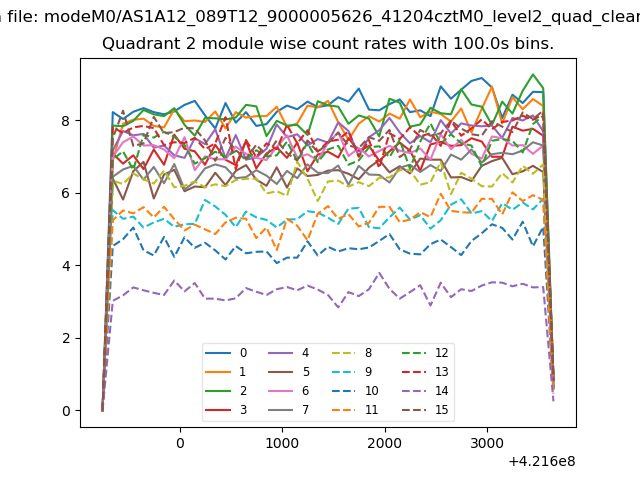
| Module-wise count rates for Quadrant B Data is divided into 100 sec bins |
 |
 |
| Module-wise count rates for Quadrant C Data is divided into 100 sec bins |
 |
 |
| Module-wise count rates for Quadrant D Data is divided into 100 sec bins |
 |
 |
| Parameter | Plot |
|---|---|
| CZT HV Monitor | 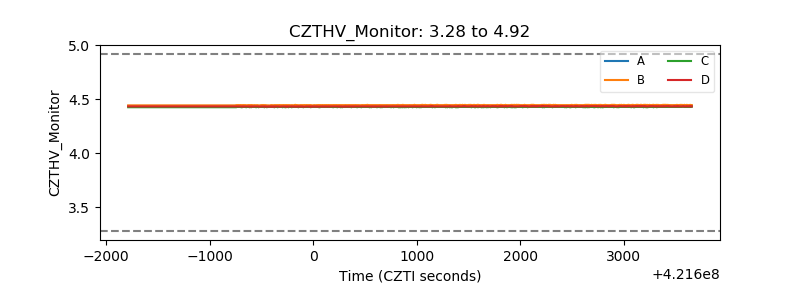 |
| D_VDD | 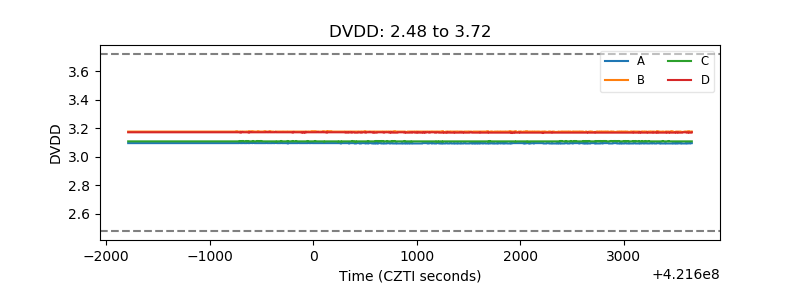 |
| Temperature 1 | 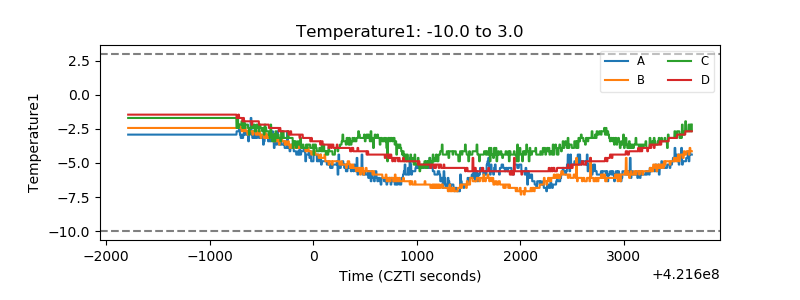 |
| Veto HV Monitor | 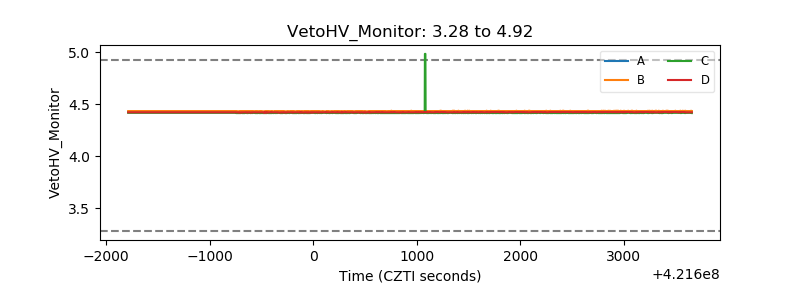 |
| Veto LLD | 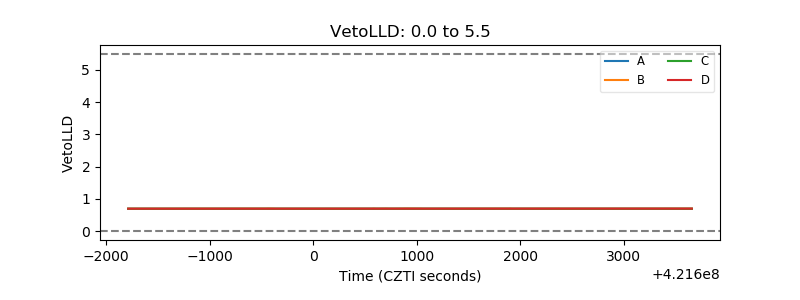 |
| Alpha Counter | 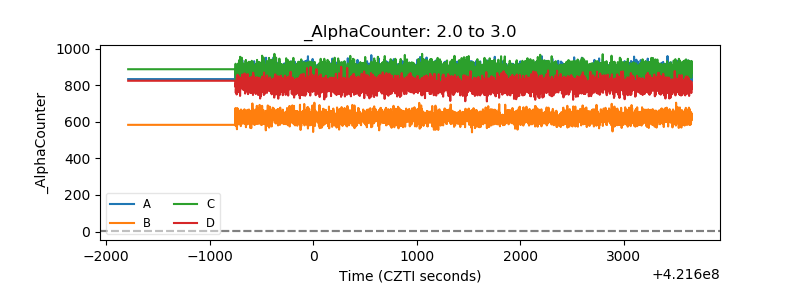 |
| _CPM_Rate | 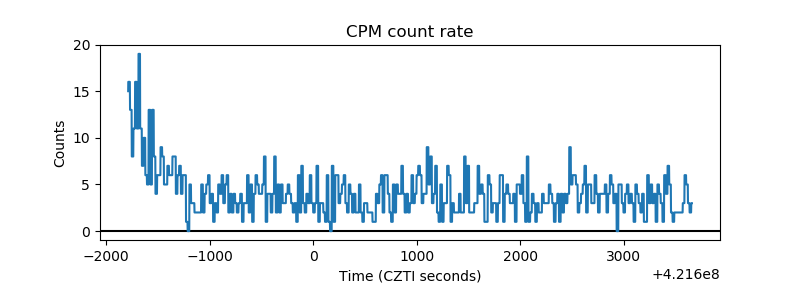 |
| CZT Counter | 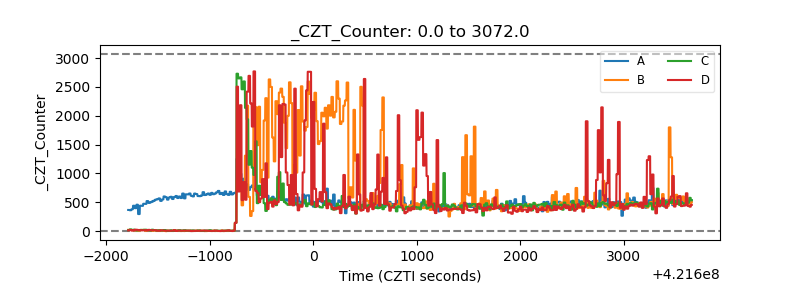 |
| +2.5 Volts monitor | 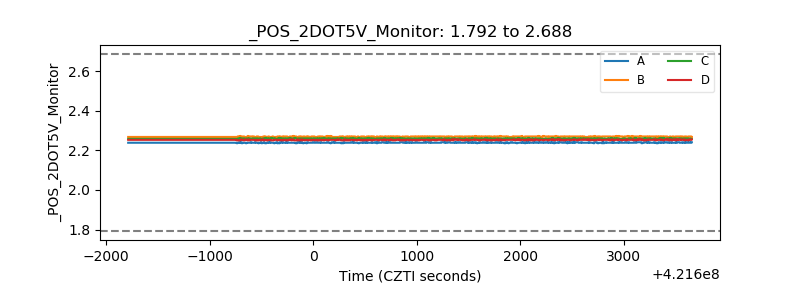 |
| +5 Volts monitor | 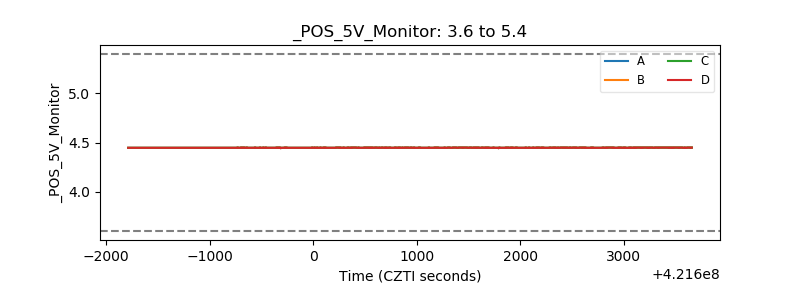 |
| _ROLL_ROT | 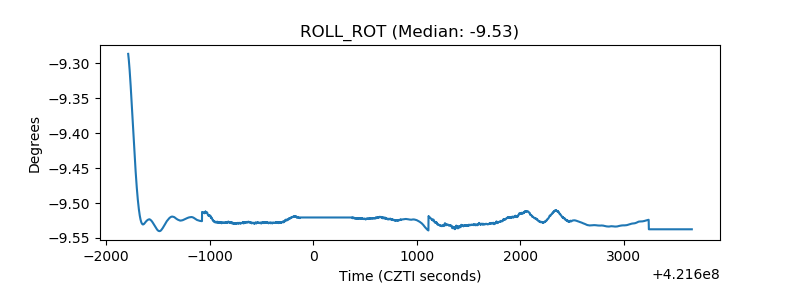 |
| _Roll_DEC | 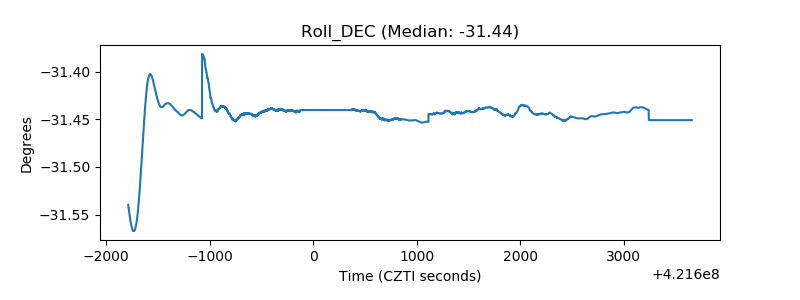 |
| _Roll_RA | 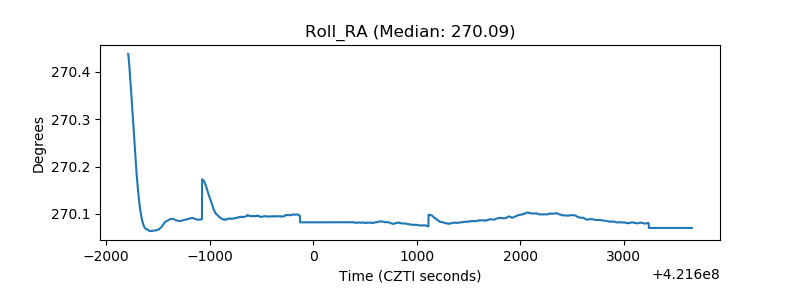 |
| Veto Counter | 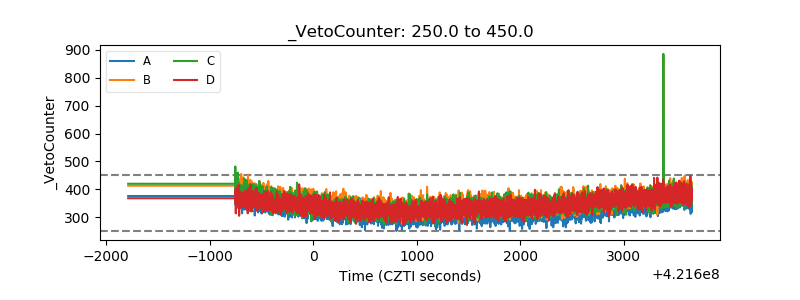 |