| Param | Original file | Final file |
|---|---|---|
| Filename | modeM0/AS1A12_100T01_9000005628_41204cztM0_level2.fits | modeM0/AS1A12_100T01_9000005628_41204cztM0_level2_quad_clean.evt |
| Size (bytes) | 59,806,080 | 15,007,680 |
| Size | 57.0 MB | 14.3 MB |
| Events in quadrant A | 563,738 | 100,283 |
| Events in quadrant B | 607,369 | 100,158 |
| Events in quadrant C | 438,359 | 96,276 |
| Events in quadrant D | 531,413 | 88,686 |
| Mode M9 | |||
|---|---|---|---|
| Quadrant | BADHDUFLAG | Total packets | Discarded packets |
| A | 0 | 3 | 0 |
| B | 0 | 3 | 0 |
| C | 0 | 3 | 0 |
| D | 0 | 3 | 0 |
| Mode M0 | |||
|---|---|---|---|
| Quadrant | BADHDUFLAG | Total packets | Discarded packets |
| A | 0 | 2238 | 2 |
| B | 0 | 2389 | 1 |
| C | 0 | 1836 | 1 |
| D | 0 | 2192 | 1 |
| Mode SS | |||
|---|---|---|---|
| Quadrant | BADHDUFLAG | Total packets | Discarded packets |
| A | 0 | 16 | 0 |
| B | 0 | 16 | 0 |
| C | 0 | 16 | 0 |
| D | 0 | 16 | 0 |
| Quadrant | Total seconds | Saturated seconds | Saturation percentage |
|---|---|---|---|
| A | 895 | 5 | 0.558659% |
| B | 895 | 5 | 0.558659% |
| C | 895 | 2 | 0.223464% |
| D | 895 | 18 | 2.011173% |
Noise dominated data is calculated using 1-second bins in cleaned event files. If a bin has >2000 counts, and if more than 50% of those come from <1% of pixels, then it is considered to be noise-dominated and hence unusable.
| Quadrant | # 1 sec bins | Bins with >0 counts | Bins with >2000 counts | High rate bins dominated by noise | Noise dominated (total time) | Noise dominated (detector-on time) | Marked lightcurve |
|---|---|---|---|---|---|---|---|
| A | 895 | 895 | 2 | 2 | 0.22% | 0.22% |  |
| B | 895 | 895 | 2 | 2 | 0.22% | 0.22% |  |
| C | 895 | 895 | 1 | 1 | 0.11% | 0.11% |  |
| D | 895 | 895 | 15 | 15 | 1.68% | 1.68% |  |
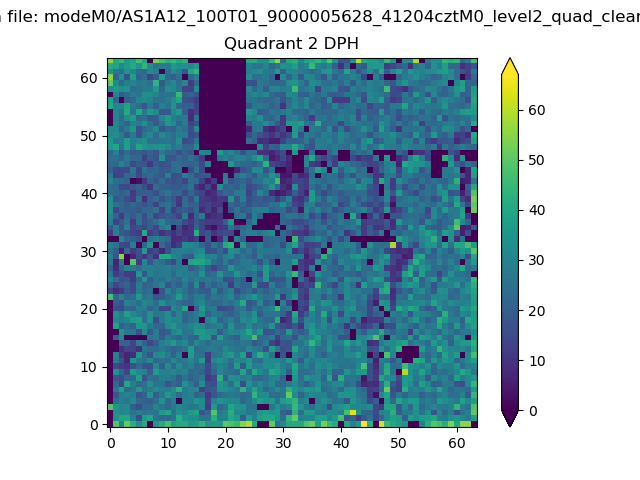
Top three noisy pixels from each quadrant. If the there are fewer than three noisy pixels in the level2.evt file, extra rows are filled as -1
| Pixel properties | Quadrant properties | ||||||
|---|---|---|---|---|---|---|---|
| Quadrant | DetID | PixID | Counts | Sigma | Mean | Median | Sigma |
| A | 10 | 83 | 164396 | 7180.87 | 100 | 98 | 22.9 |
| A | 13 | 6 | 4556 | 194.84 | 100 | 98 | 22.9 |
| A | 12 | 189 | 3556 | 151.14 | 100 | 98 | 22.9 |
| B | 0 | 186 | 170781 | 7959.24 | 98 | 95 | 21.4 |
| B | 0 | 229 | 20569 | 954.72 | 98 | 95 | 21.4 |
| B | 5 | 255 | 17491 | 811.19 | 98 | 95 | 21.4 |
| C | 15 | 214 | 43091 | 1750.6 | 97 | 97 | 24.6 |
| C | 0 | 10 | 8304 | 334.17 | 97 | 97 | 24.6 |
| C | 15 | 111 | 3683 | 146.01 | 97 | 97 | 24.6 |
| D | 12 | 16 | 57776 | 2202.95 | 99 | 95 | 26.2 |
| D | 13 | 249 | 28515 | 1085.41 | 99 | 95 | 26.2 |
| D | 12 | 233 | 27820 | 1058.87 | 99 | 95 | 26.2 |
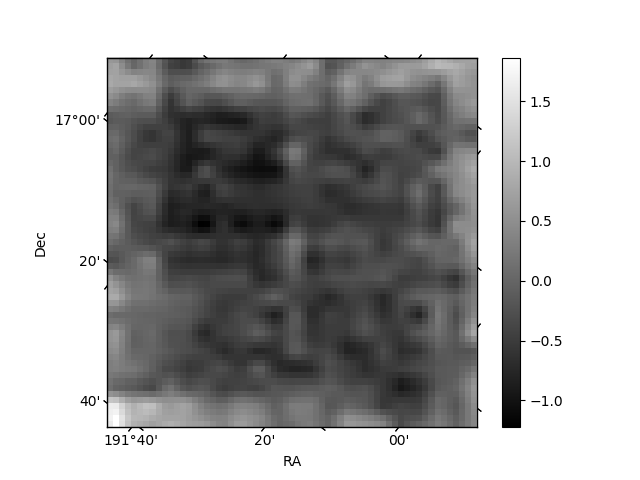
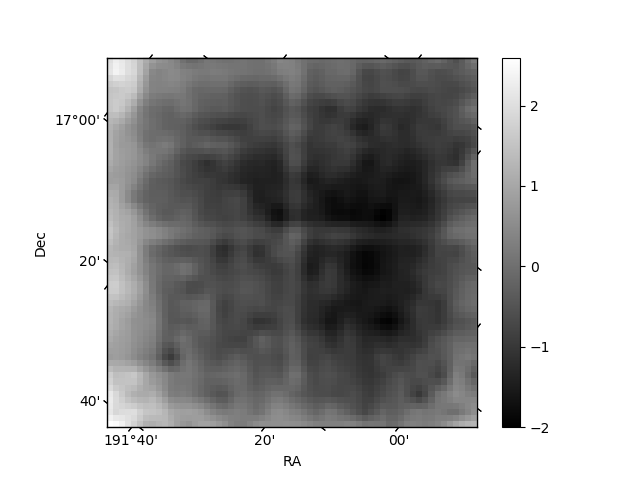
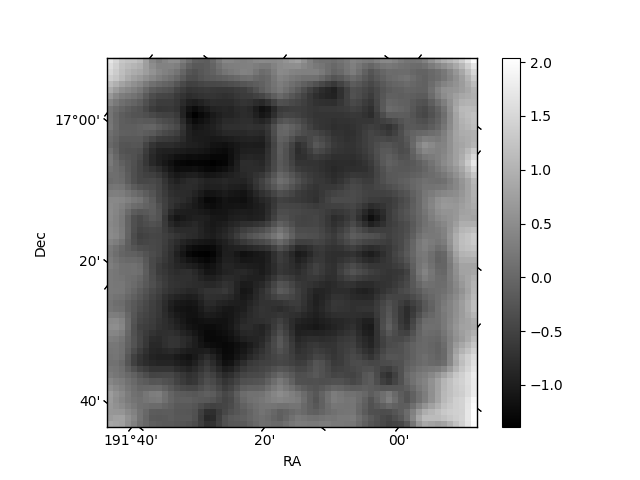
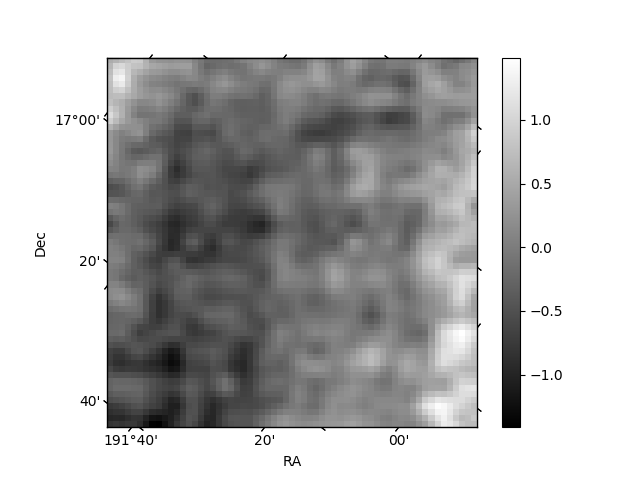
Histogram calculated using DETX and DETY for each event in the final _common_clean file
| Quadrant A | 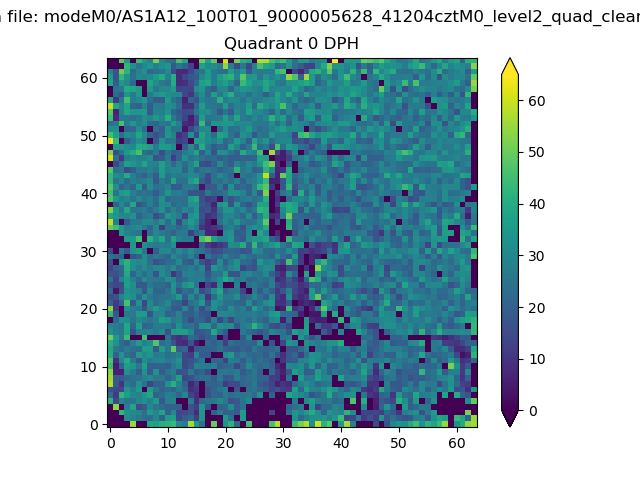 |
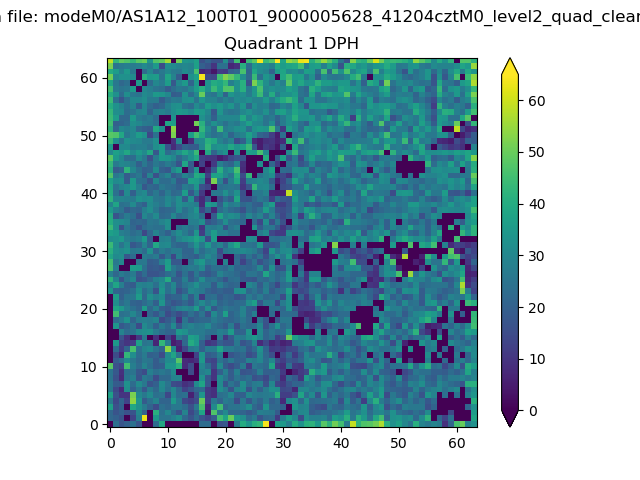 |
Quadrant B |
|---|---|---|---|
| Quadrant D | 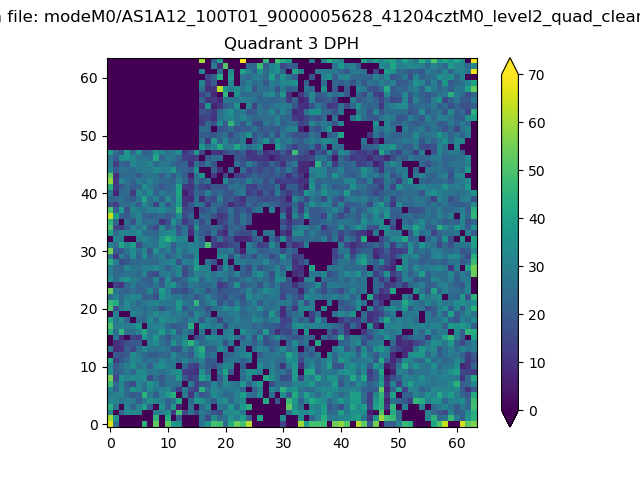 |
 |
Quadrant C |
| Plot type | Count rate plots | Images |
|---|---|---|
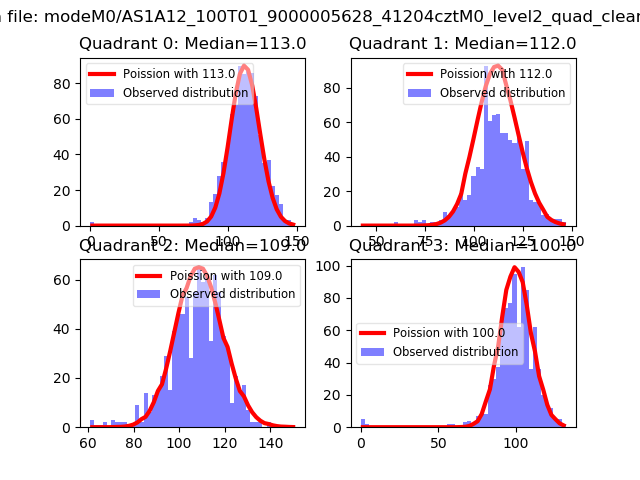
| Comparison with Poisson distribution Blue bars denote a histogram of data divided into 1 sec bins. Red curve is a Poisson curve with rate = median count rate of data. |
 |
 |
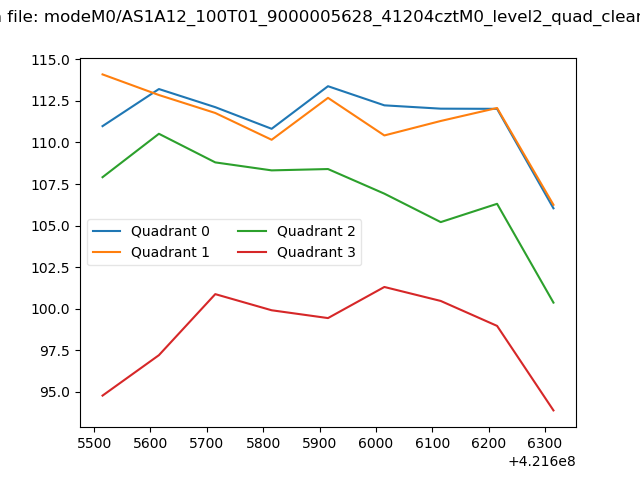
| Quadrant-wise count rates Data is divided into 100 sec bins |
 |
|
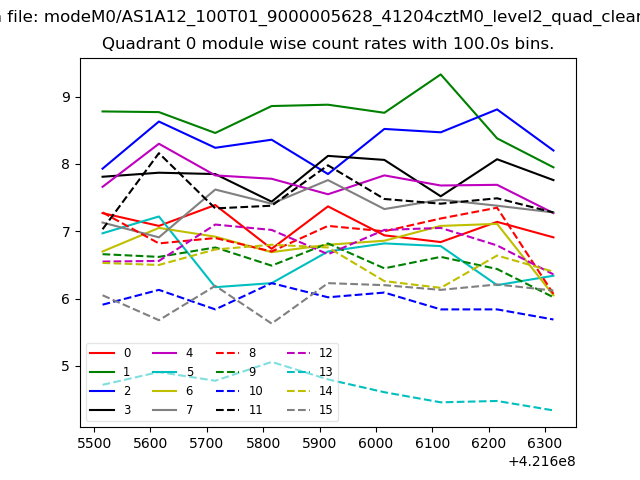
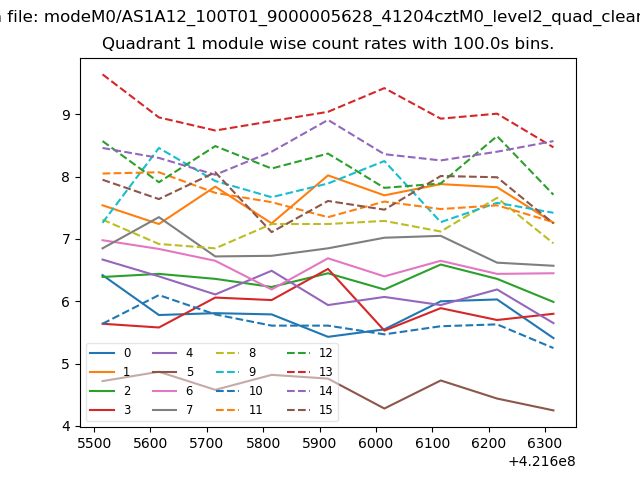
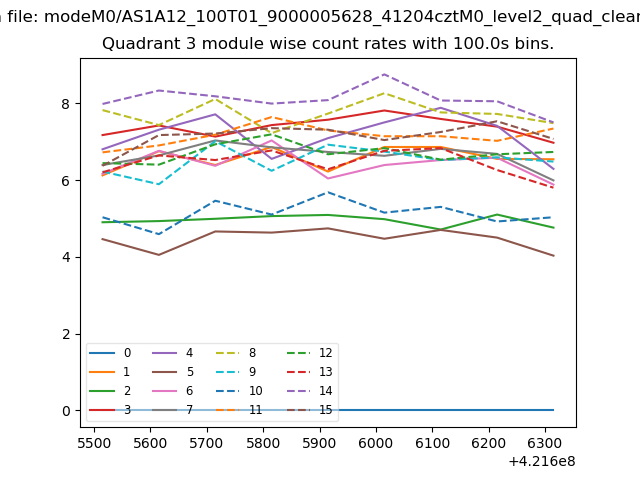
| Module-wise count rates for Quadrant A Data is divided into 100 sec bins |
 |
 |
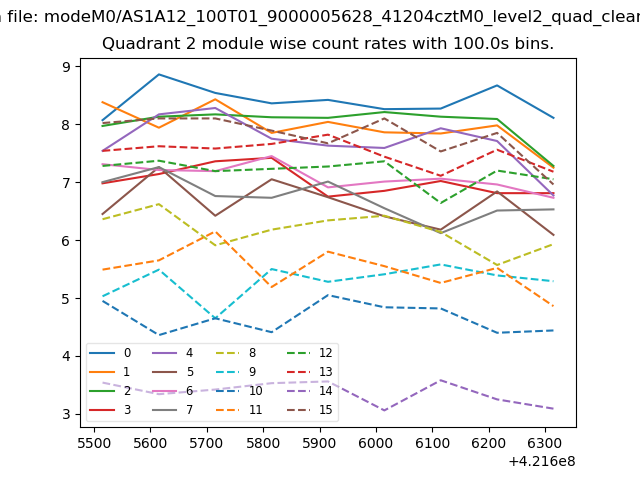
| Module-wise count rates for Quadrant B Data is divided into 100 sec bins |
 |
 |
| Module-wise count rates for Quadrant C Data is divided into 100 sec bins |
 |
 |
| Module-wise count rates for Quadrant D Data is divided into 100 sec bins |
 |
 |
| Parameter | Plot |
|---|---|
| CZT HV Monitor |  |
| D_VDD | 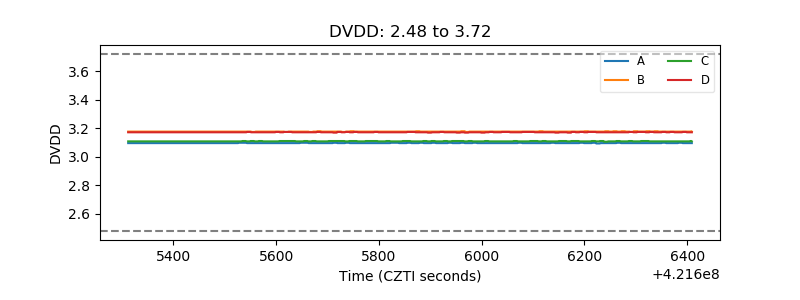 |
| Temperature 1 | 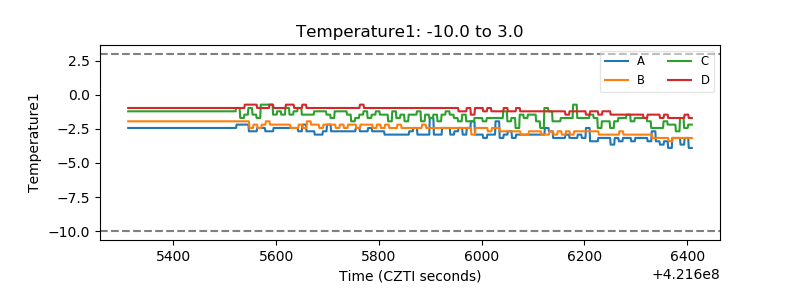 |
| Veto HV Monitor | 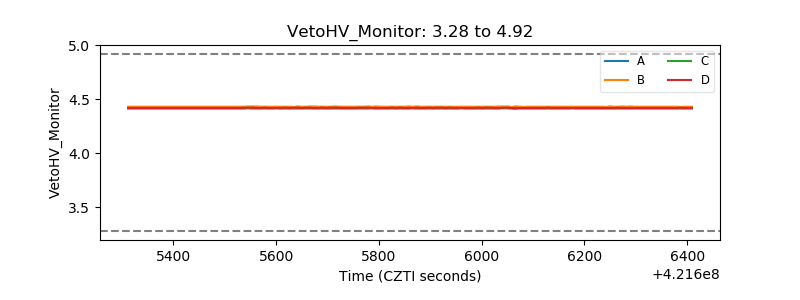 |
| Veto LLD |  |
| Alpha Counter | 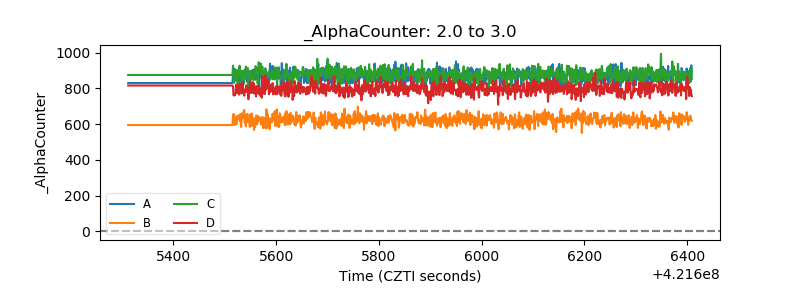 |
| _CPM_Rate | 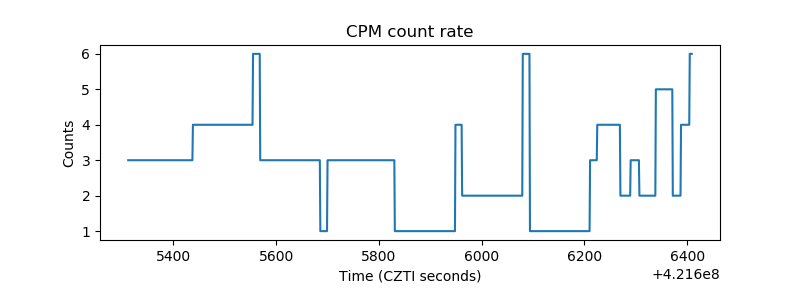 |
| CZT Counter | 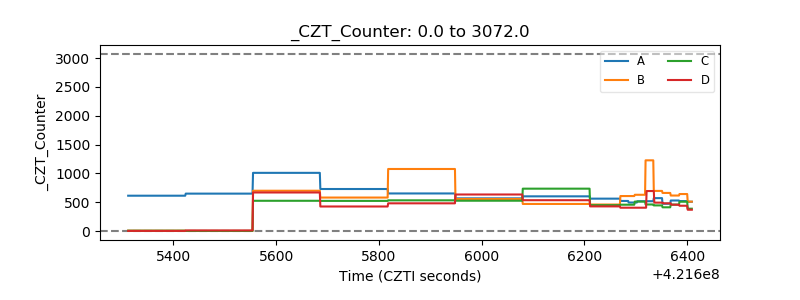 |
| +2.5 Volts monitor |  |
| +5 Volts monitor | 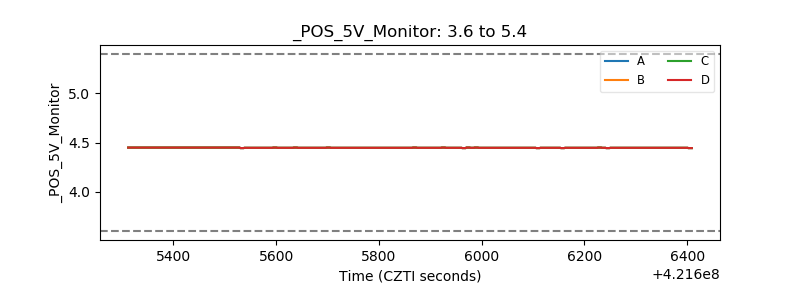 |
| _ROLL_ROT | 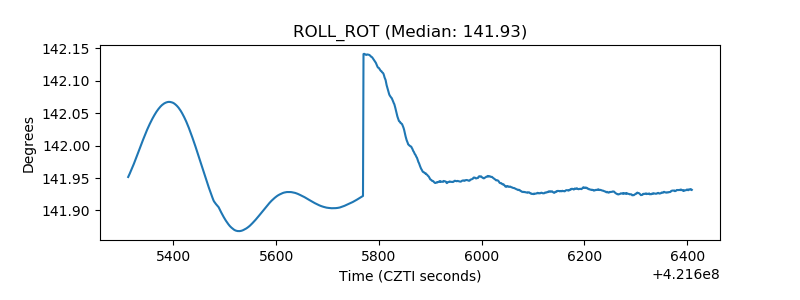 |
| _Roll_DEC | 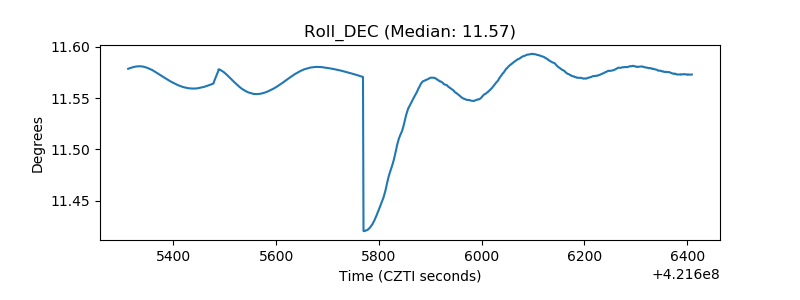 |
| _Roll_RA | 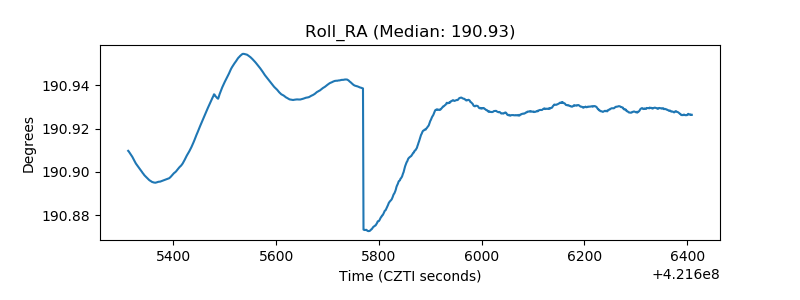 |
| Veto Counter | 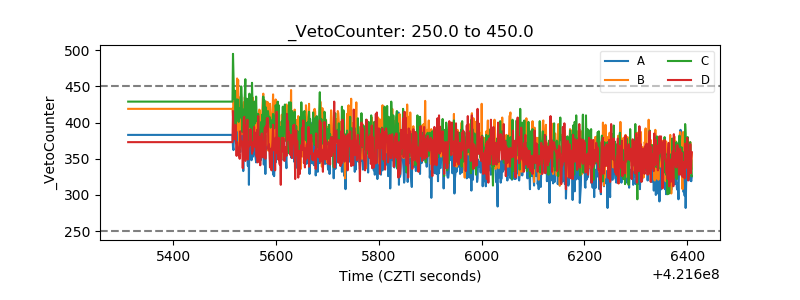 |