| Param | Original file | Final file |
|---|---|---|
| Filename | modeM0/AS1A12_100T01_9000005628_41205cztM0_level2.fits | modeM0/AS1A12_100T01_9000005628_41205cztM0_level2_quad_clean.evt |
| Size (bytes) | 336,297,600 | 96,531,840 |
| Size | 320.7 MB | 92.1 MB |
| Events in quadrant A | 3,126,356 | 648,291 |
| Events in quadrant B | 3,221,950 | 651,630 |
| Events in quadrant C | 2,774,432 | 626,334 |
| Events in quadrant D | 2,861,871 | 580,818 |
| Mode M9 | |||
|---|---|---|---|
| Quadrant | BADHDUFLAG | Total packets | Discarded packets |
| A | 0 | 16 | 0 |
| B | 0 | 16 | 0 |
| C | 0 | 16 | 0 |
| D | 0 | 16 | 0 |
| Mode M0 | |||
|---|---|---|---|
| Quadrant | BADHDUFLAG | Total packets | Discarded packets |
| A | 0 | 12929 | 3 |
| B | 0 | 13777 | 2 |
| C | 0 | 12183 | 2 |
| D | 0 | 13045 | 2 |
| Mode SS | |||
|---|---|---|---|
| Quadrant | BADHDUFLAG | Total packets | Discarded packets |
| A | 0 | 120 | 0 |
| B | 0 | 120 | 0 |
| C | 0 | 120 | 0 |
| D | 0 | 120 | 0 |
| Quadrant | Total seconds | Saturated seconds | Saturation percentage |
|---|---|---|---|
| A | 5955 | 13 | 0.218304% |
| B | 5955 | 68 | 1.141898% |
| C | 5955 | 23 | 0.386230% |
| D | 5955 | 60 | 1.007557% |
Noise dominated data is calculated using 1-second bins in cleaned event files. If a bin has >2000 counts, and if more than 50% of those come from <1% of pixels, then it is considered to be noise-dominated and hence unusable.
| Quadrant | # 1 sec bins | Bins with >0 counts | Bins with >2000 counts | High rate bins dominated by noise | Noise dominated (total time) | Noise dominated (detector-on time) | Marked lightcurve |
|---|---|---|---|---|---|---|---|
| A | 7268 | 5956 | 4 | 4 | 0.06% | 0.07% | 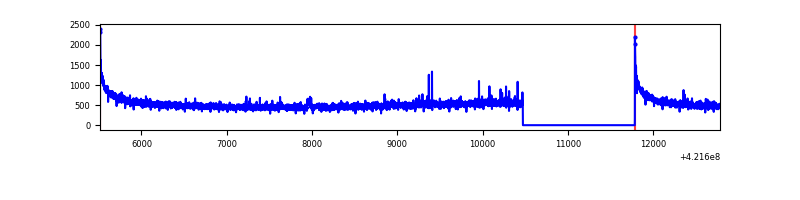 |
| B | 7268 | 5956 | 54 | 54 | 0.74% | 0.91% | 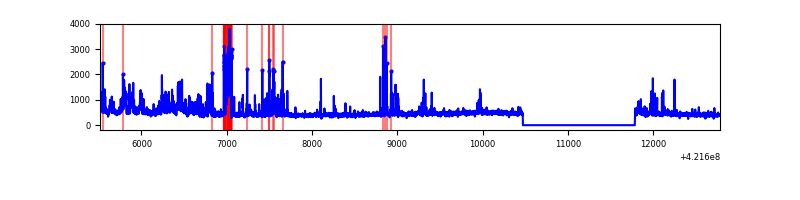 |
| C | 7268 | 5956 | 18 | 18 | 0.25% | 0.30% | 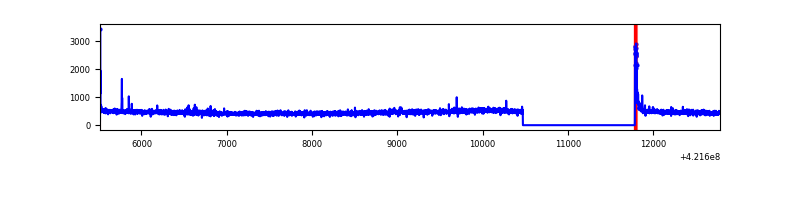 |
| D | 7268 | 5956 | 53 | 53 | 0.73% | 0.89% | 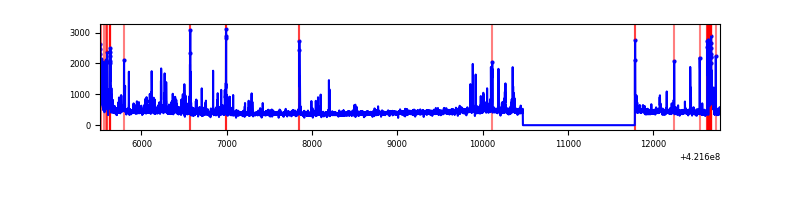 |
Top three noisy pixels from each quadrant. If the there are fewer than three noisy pixels in the level2.evt file, extra rows are filled as -1
| Pixel properties | Quadrant properties | ||||||
|---|---|---|---|---|---|---|---|
| Quadrant | DetID | PixID | Counts | Sigma | Mean | Median | Sigma |
| A | 10 | 83 | 578702 | 4374.74 | 640 | 628 | 132.1 |
| A | 12 | 189 | 36256 | 269.62 | 640 | 628 | 132.1 |
| A | 13 | 6 | 14065 | 101.69 | 640 | 628 | 132.1 |
| B | 0 | 186 | 237337 | 1927.11 | 631 | 613 | 122.8 |
| B | 5 | 255 | 222142 | 1803.41 | 631 | 613 | 122.8 |
| B | 0 | 229 | 221505 | 1798.23 | 631 | 613 | 122.8 |
| C | 15 | 214 | 256917 | 1741.71 | 624 | 630 | 147.1 |
| C | 0 | 10 | 68941 | 464.24 | 624 | 630 | 147.1 |
| C | 15 | 159 | 7464 | 46.44 | 624 | 630 | 147.1 |
| D | 12 | 16 | 131822 | 858.18 | 623 | 606 | 152.9 |
| D | 2 | 120 | 122230 | 795.44 | 623 | 606 | 152.9 |
| D | 2 | 249 | 74118 | 480.78 | 623 | 606 | 152.9 |
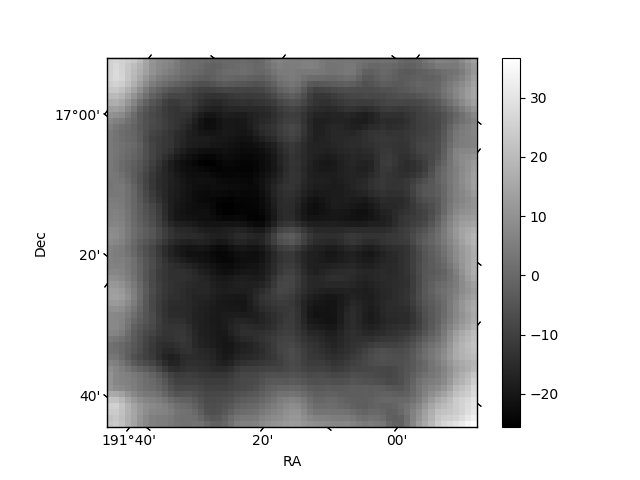
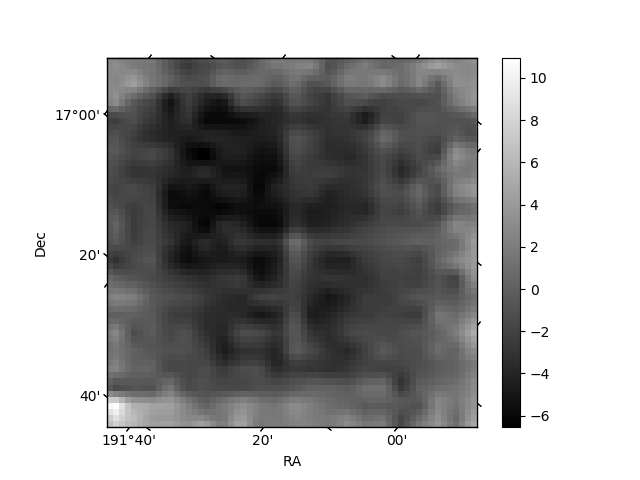
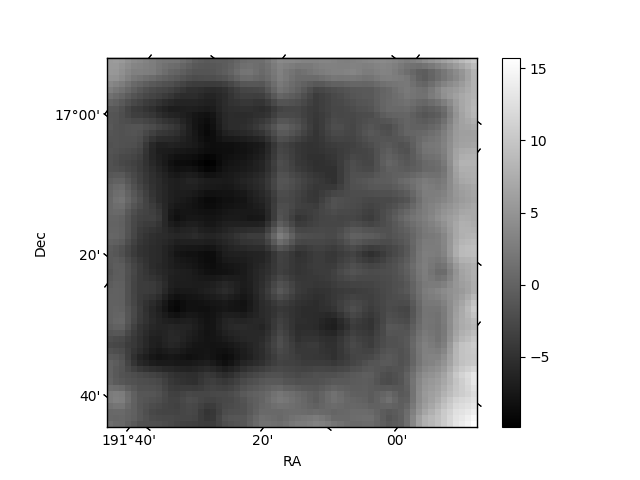
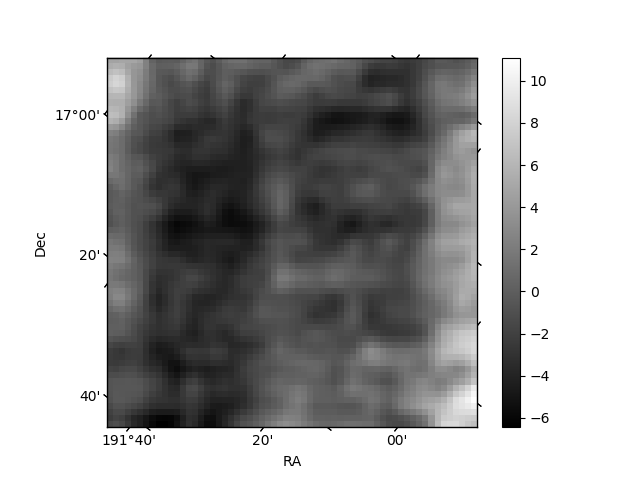
Histogram calculated using DETX and DETY for each event in the final _common_clean file
| Quadrant A | 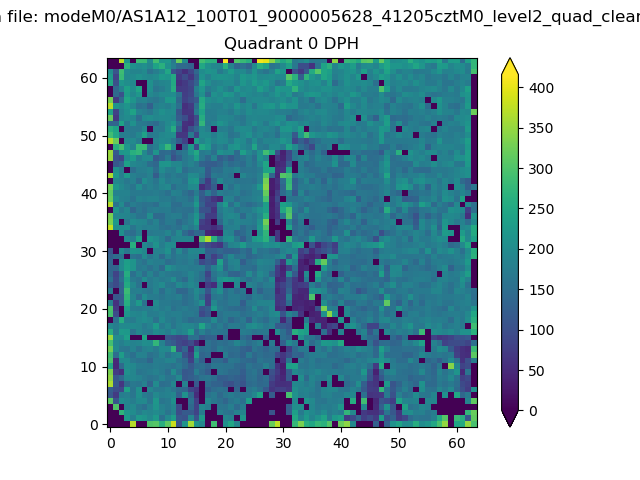 |
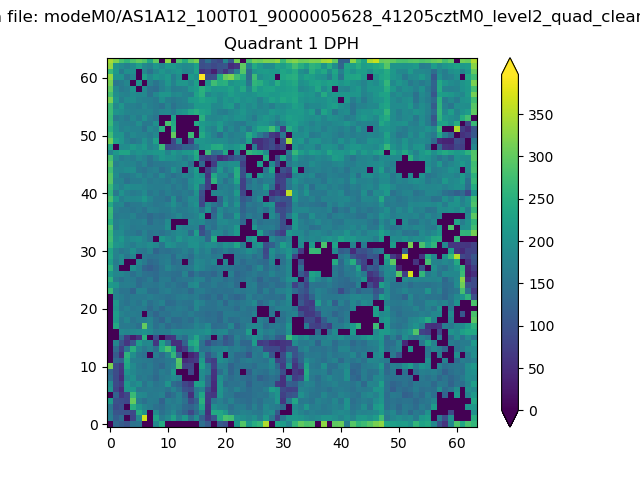 |
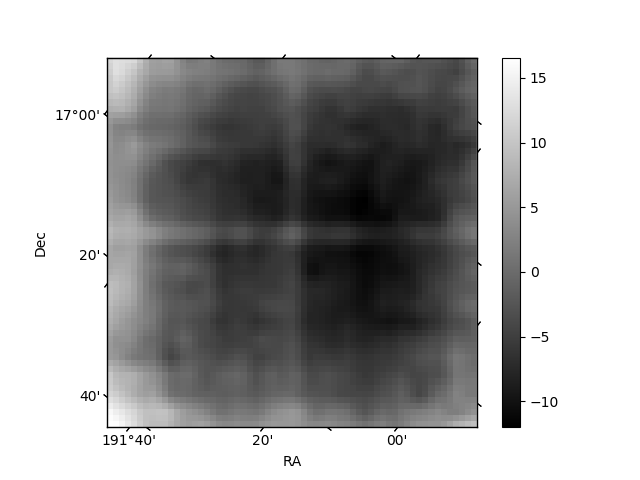
Quadrant B |
|---|---|---|---|
| Quadrant D | 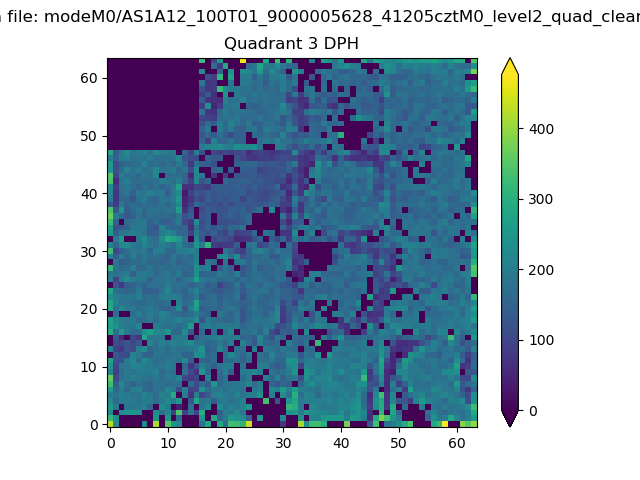 |
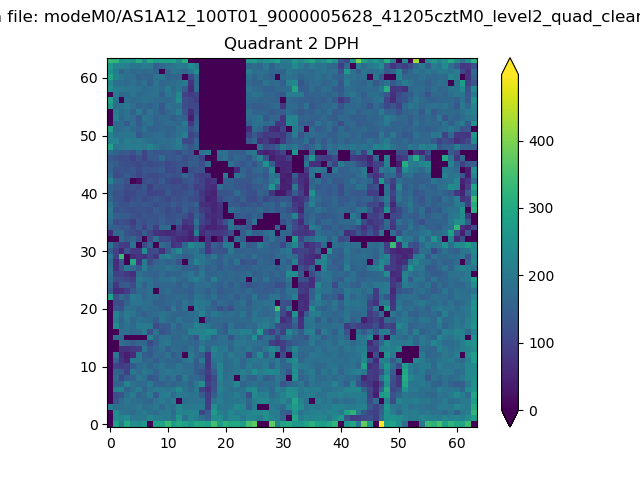 |
Quadrant C |
| Plot type | Count rate plots | Images |
|---|---|---|
| Comparison with Poisson distribution Blue bars denote a histogram of data divided into 1 sec bins. Red curve is a Poisson curve with rate = median count rate of data. |
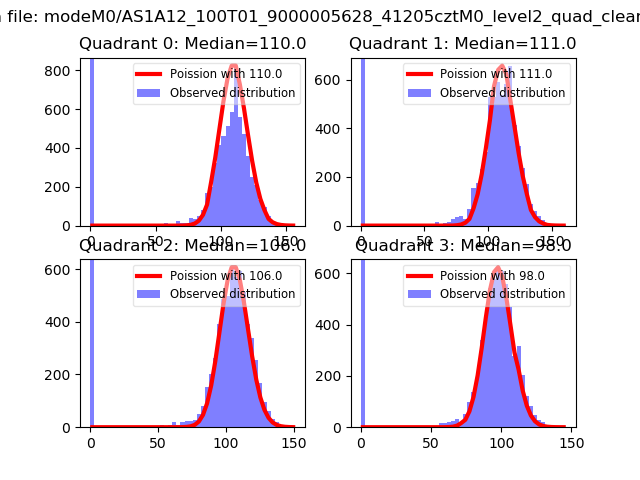 |
 |
| Quadrant-wise count rates Data is divided into 100 sec bins |
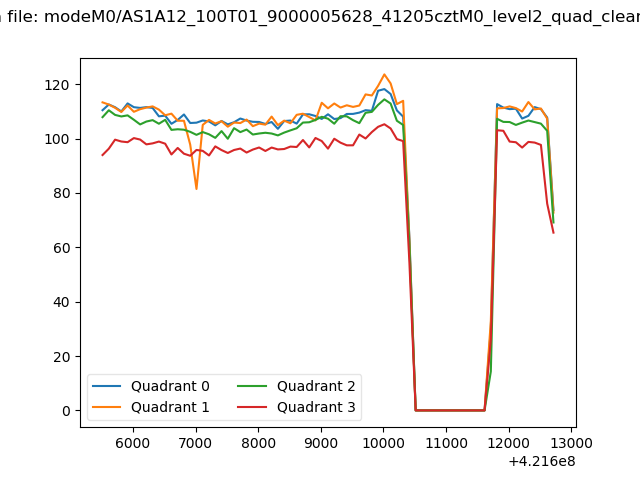 |
|
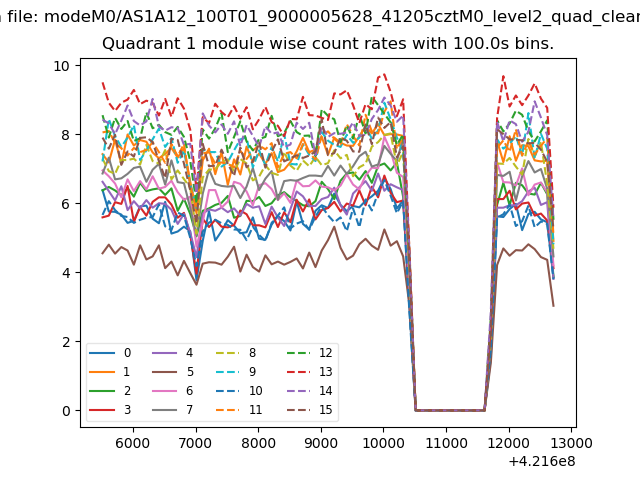
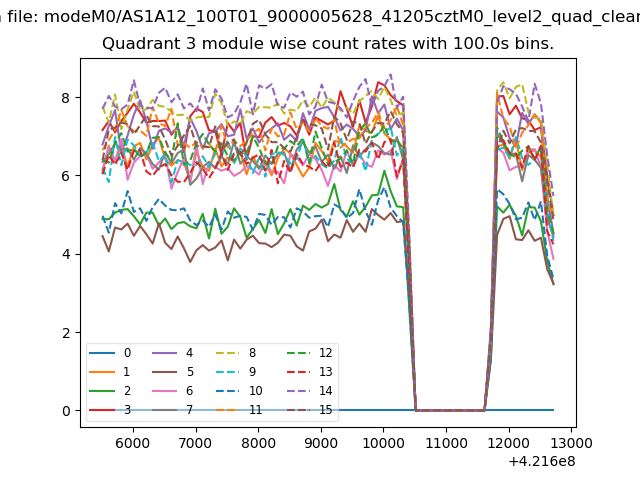
| Module-wise count rates for Quadrant A Data is divided into 100 sec bins |
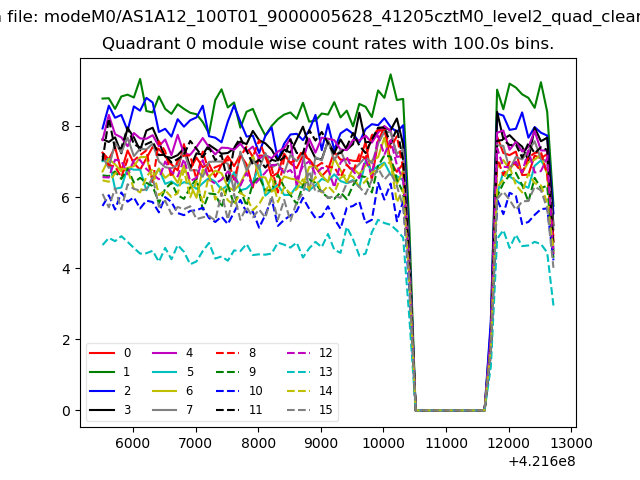 |
 |
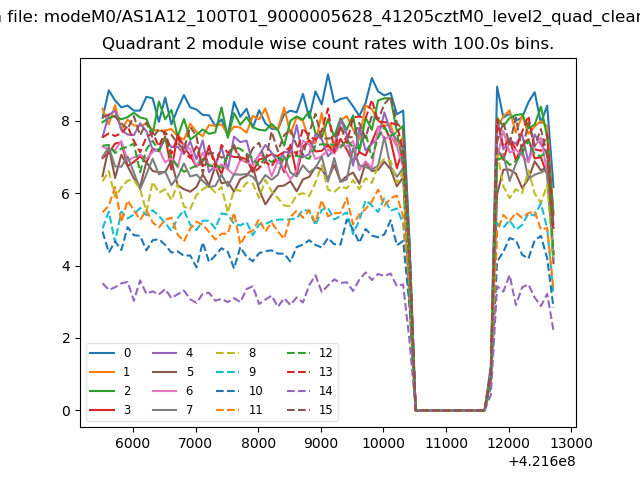
| Module-wise count rates for Quadrant B Data is divided into 100 sec bins |
 |
 |
| Module-wise count rates for Quadrant C Data is divided into 100 sec bins |
 |
 |
| Module-wise count rates for Quadrant D Data is divided into 100 sec bins |
 |
 |
| Parameter | Plot |
|---|---|
| CZT HV Monitor |  |
| D_VDD | 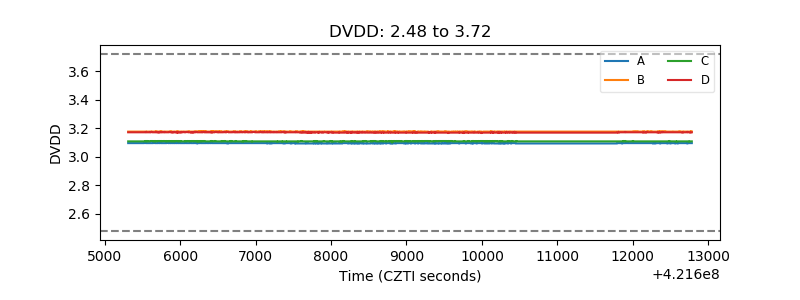 |
| Temperature 1 | 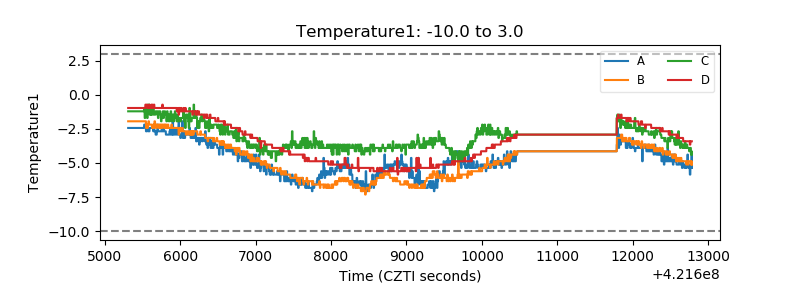 |
| Veto HV Monitor | 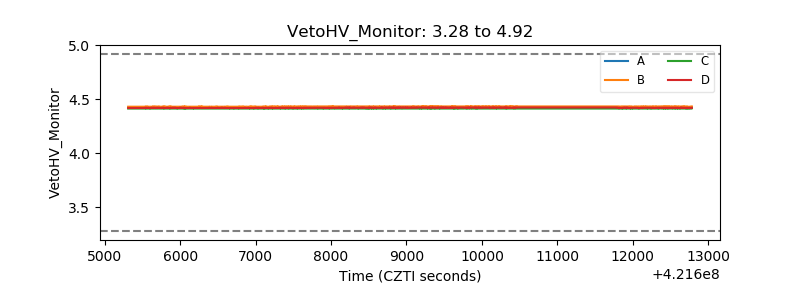 |
| Veto LLD | 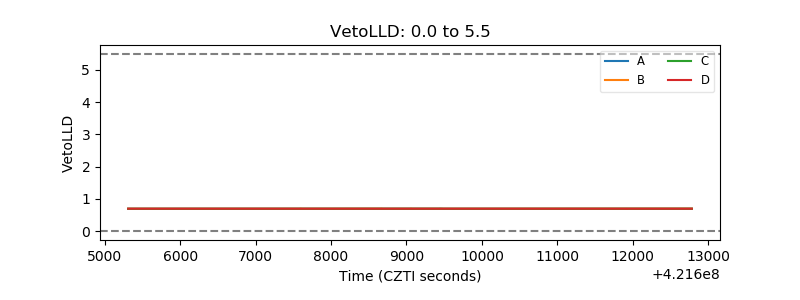 |
| Alpha Counter | 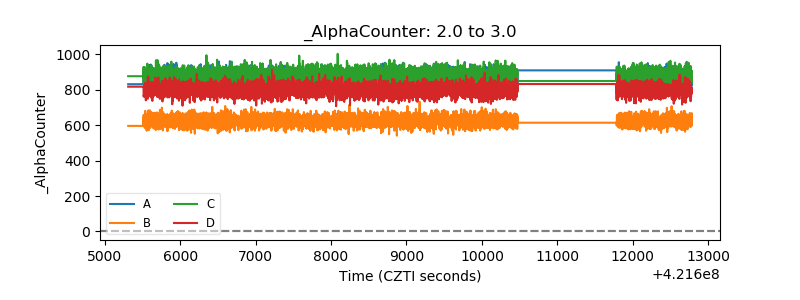 |
| _CPM_Rate | 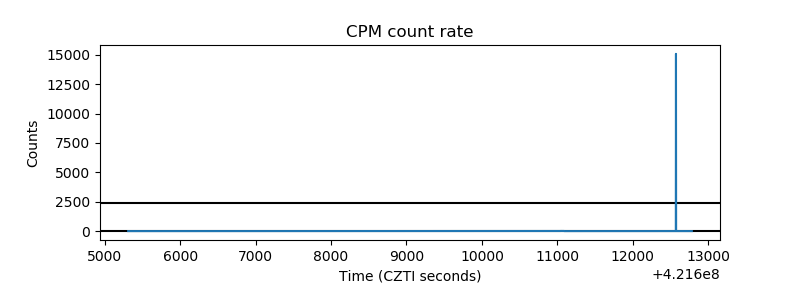 |
| CZT Counter | 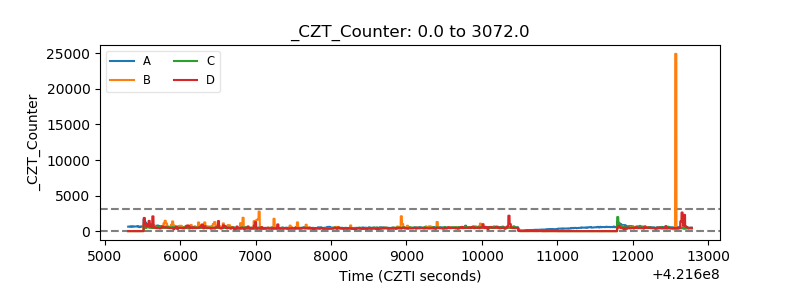 |
| +2.5 Volts monitor | 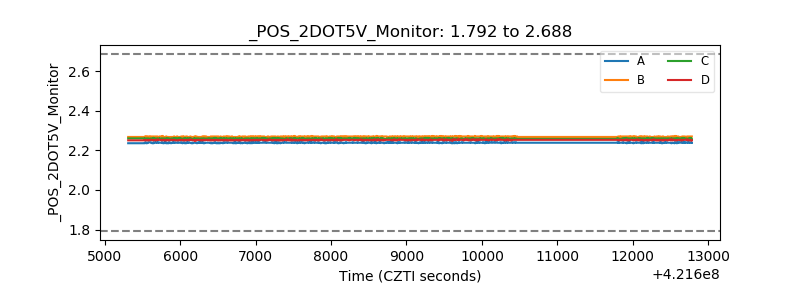 |
| +5 Volts monitor | 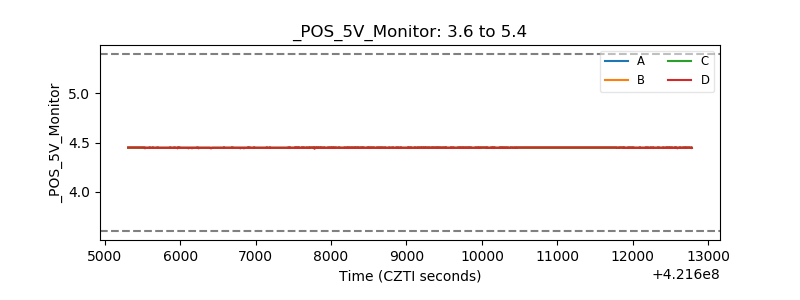 |
| _ROLL_ROT | 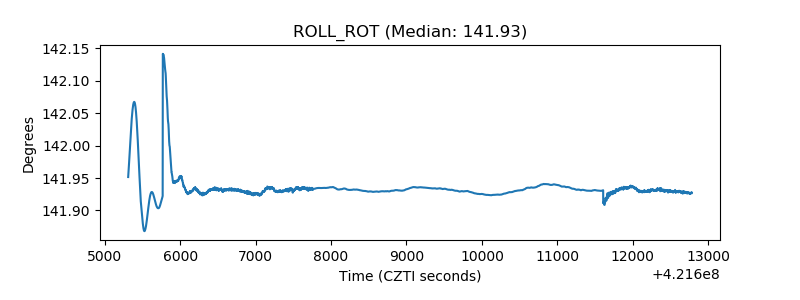 |
| _Roll_DEC | 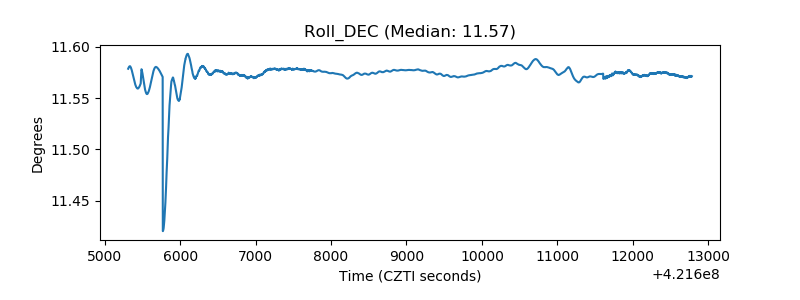 |
| _Roll_RA | 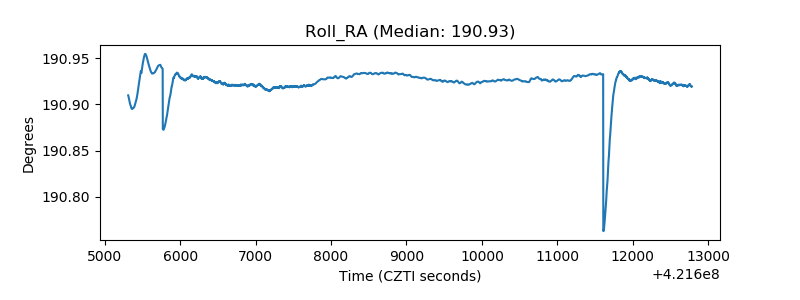 |
| Veto Counter | 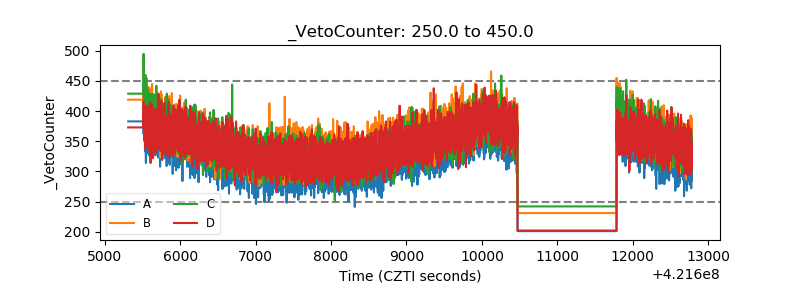 |