| Param | Original file | Final file |
|---|---|---|
| Filename | modeM0/AS1C07_001T12_9000005632_41208cztM0_level2.fits | modeM0/AS1C07_001T12_9000005632_41208cztM0_level2_quad_clean.evt |
| Size (bytes) | 126,964,800 | 27,705,600 |
| Size | 121.1 MB | 26.4 MB |
| Events in quadrant A | 976,754 | 188,231 |
| Events in quadrant B | 1,336,974 | 182,751 |
| Events in quadrant C | 986,709 | 177,712 |
| Events in quadrant D | 1,265,650 | 165,906 |
| Mode M0 | |||
|---|---|---|---|
| Quadrant | BADHDUFLAG | Total packets | Discarded packets |
| A | 0 | 3953 | 2 |
| B | 0 | 5216 | 1 |
| C | 0 | 3948 | 1 |
| D | 0 | 4919 | 1 |
| Mode M9 | |||
|---|---|---|---|
| Quadrant | BADHDUFLAG | Total packets | Discarded packets |
| A | 0 | 15 | 0 |
| B | 0 | 15 | 0 |
| C | 0 | 15 | 0 |
| D | 0 | 15 | 0 |
| Mode SS | |||
|---|---|---|---|
| Quadrant | BADHDUFLAG | Total packets | Discarded packets |
| A | 0 | 38 | 0 |
| B | 0 | 38 | 0 |
| C | 0 | 38 | 0 |
| D | 0 | 38 | 0 |
| Quadrant | Total seconds | Saturated seconds | Saturation percentage |
|---|---|---|---|
| A | 1686 | 4 | 0.237248% |
| B | 1686 | 115 | 6.820878% |
| C | 1686 | 60 | 3.558719% |
| D | 1686 | 70 | 4.151839% |
Noise dominated data is calculated using 1-second bins in cleaned event files. If a bin has >2000 counts, and if more than 50% of those come from <1% of pixels, then it is considered to be noise-dominated and hence unusable.
| Quadrant | # 1 sec bins | Bins with >0 counts | Bins with >2000 counts | High rate bins dominated by noise | Noise dominated (total time) | Noise dominated (detector-on time) | Marked lightcurve |
|---|---|---|---|---|---|---|---|
| A | 3210 | 1688 | 3 | 3 | 0.09% | 0.18% | 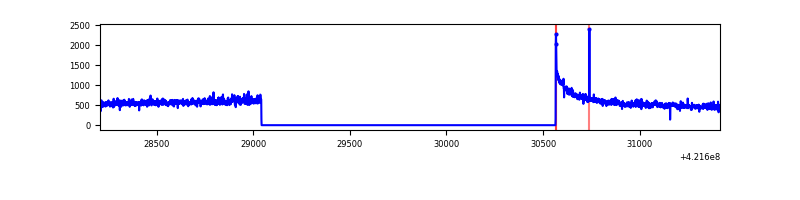 |
| B | 3210 | 1688 | 60 | 60 | 1.87% | 3.55% | 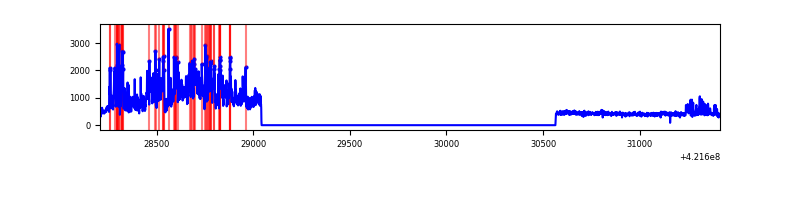 |
| C | 3210 | 1688 | 57 | 57 | 1.78% | 3.38% | 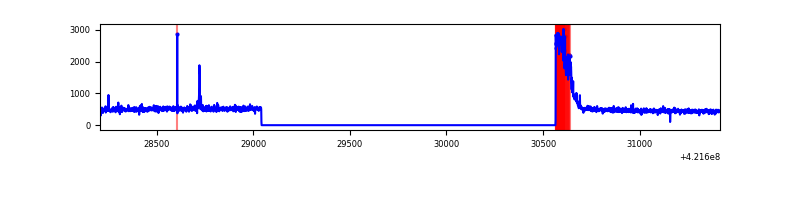 |
| D | 3210 | 1688 | 66 | 66 | 2.06% | 3.91% | 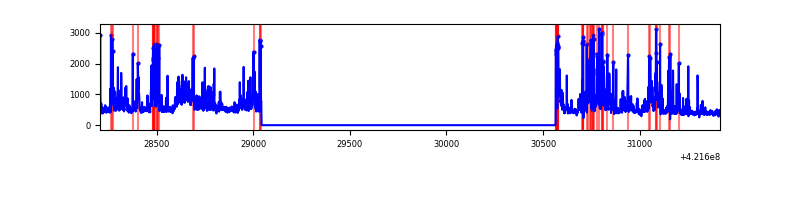 |
Top three noisy pixels from each quadrant. If the there are fewer than three noisy pixels in the level2.evt file, extra rows are filled as -1
| Pixel properties | Quadrant properties | ||||||
|---|---|---|---|---|---|---|---|
| Quadrant | DetID | PixID | Counts | Sigma | Mean | Median | Sigma |
| A | 10 | 83 | 211914 | 5121.63 | 190 | 185 | 41.3 |
| A | 12 | 189 | 20555 | 492.74 | 190 | 185 | 41.3 |
| A | 13 | 6 | 4407 | 102.13 | 190 | 185 | 41.3 |
| B | 0 | 186 | 461519 | 12445.61 | 185 | 180 | 37.1 |
| B | 15 | 85 | 53792 | 1446.3 | 185 | 180 | 37.1 |
| B | 0 | 229 | 50156 | 1348.21 | 185 | 180 | 37.1 |
| C | 0 | 10 | 178496 | 3999.2 | 184 | 184 | 44.6 |
| C | 15 | 214 | 74327 | 1662.88 | 184 | 184 | 44.6 |
| C | 14 | 254 | 7629 | 166.97 | 184 | 184 | 44.6 |
| D | 12 | 16 | 357746 | 7549.71 | 184 | 178 | 47.4 |
| D | 13 | 249 | 76087 | 1602.75 | 184 | 178 | 47.4 |
| D | 2 | 120 | 41792 | 878.64 | 184 | 178 | 47.4 |
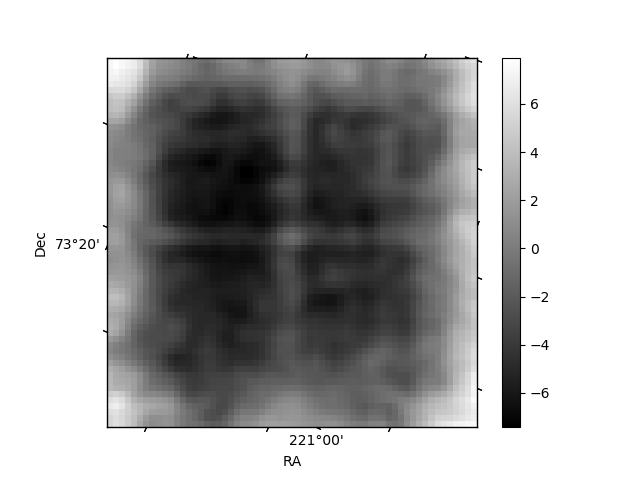
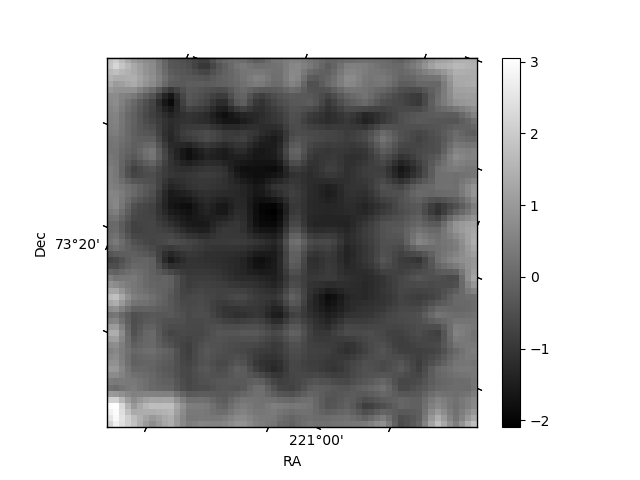
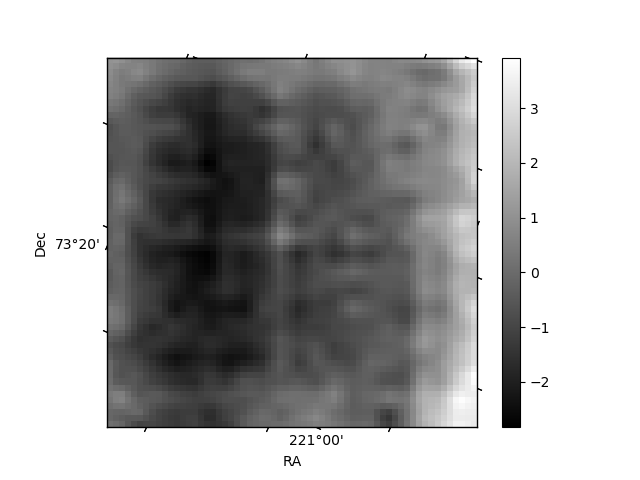
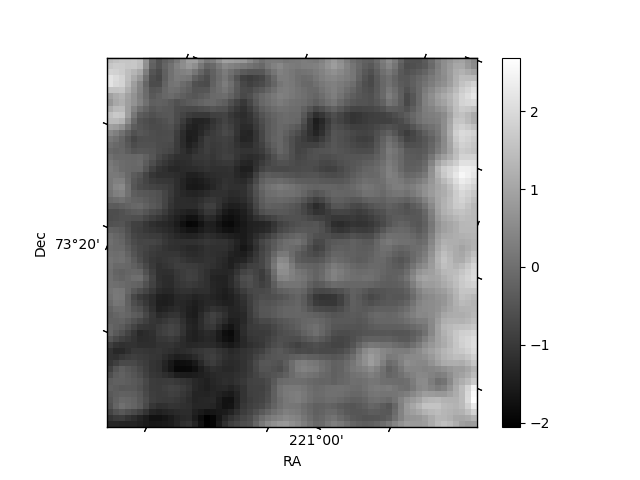
Histogram calculated using DETX and DETY for each event in the final _common_clean file
| Quadrant A | 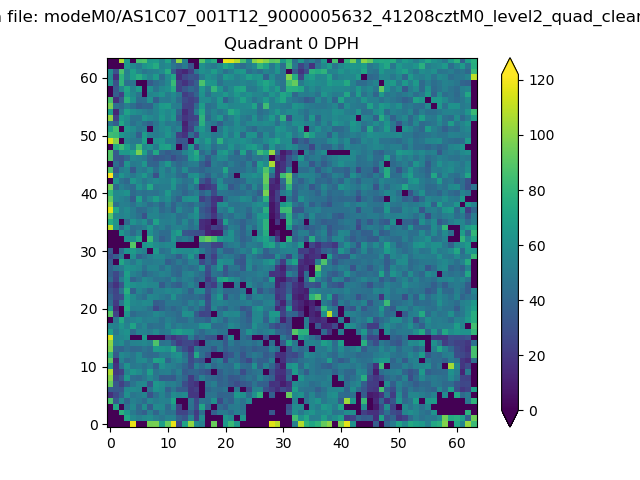 |
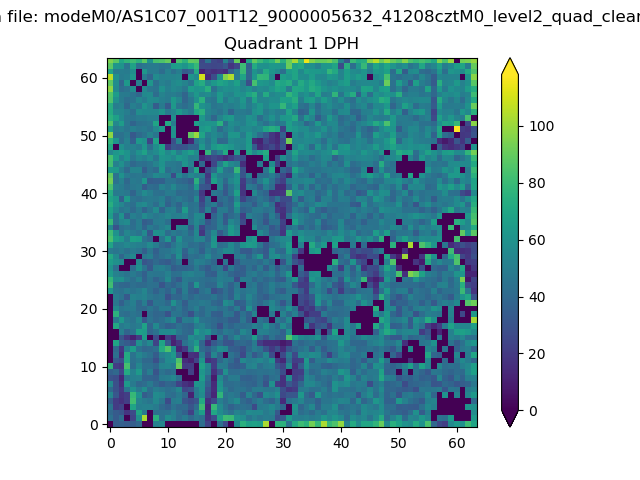 |
Quadrant B |
|---|---|---|---|
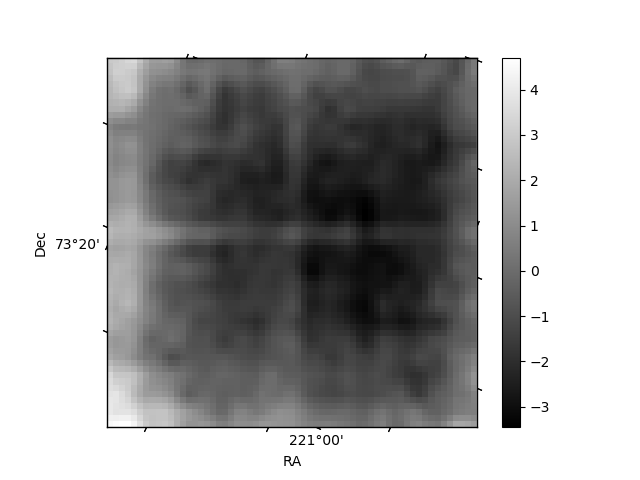
| Quadrant D | 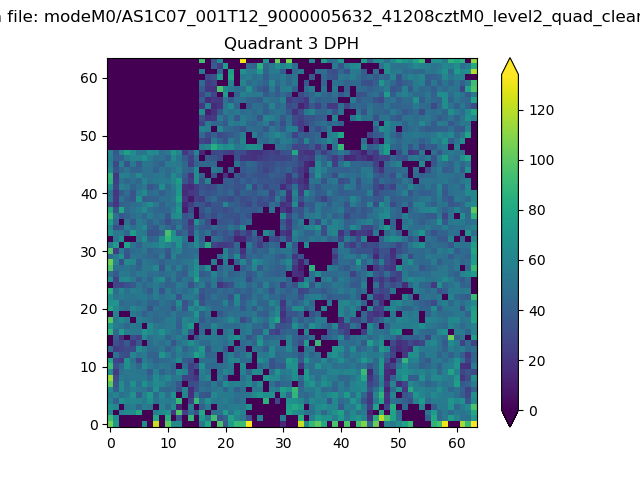 |
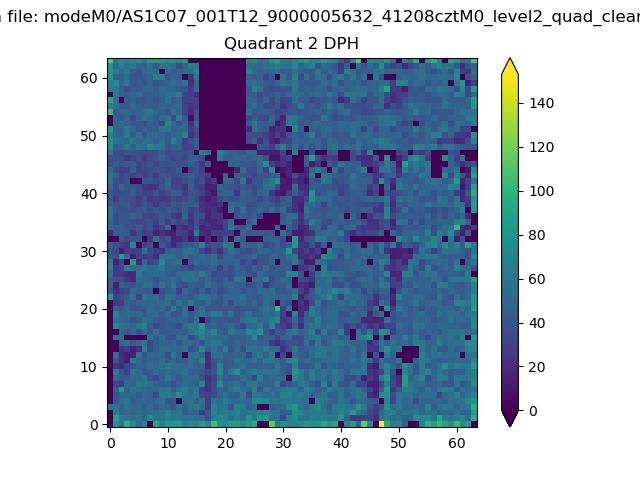 |
Quadrant C |
| Plot type | Count rate plots | Images |
|---|---|---|
| Comparison with Poisson distribution Blue bars denote a histogram of data divided into 1 sec bins. Red curve is a Poisson curve with rate = median count rate of data. |
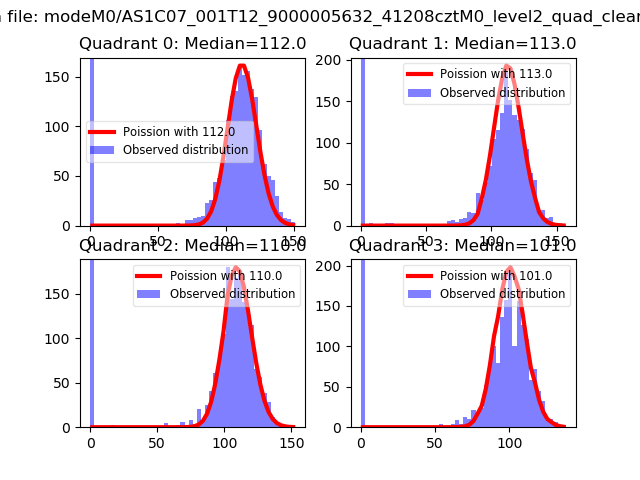 |
 |
| Quadrant-wise count rates Data is divided into 100 sec bins |
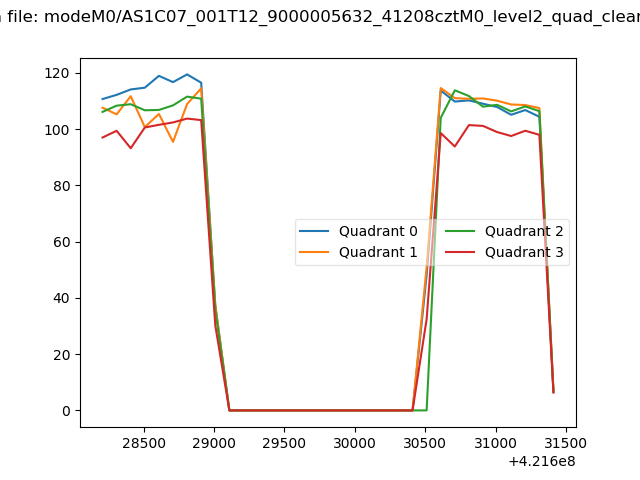 |
|
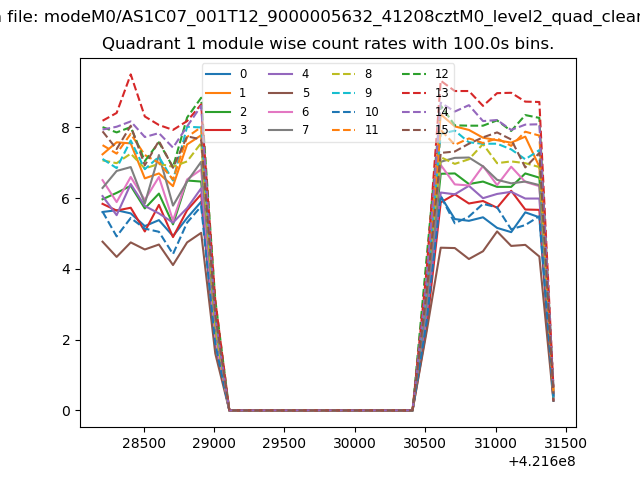
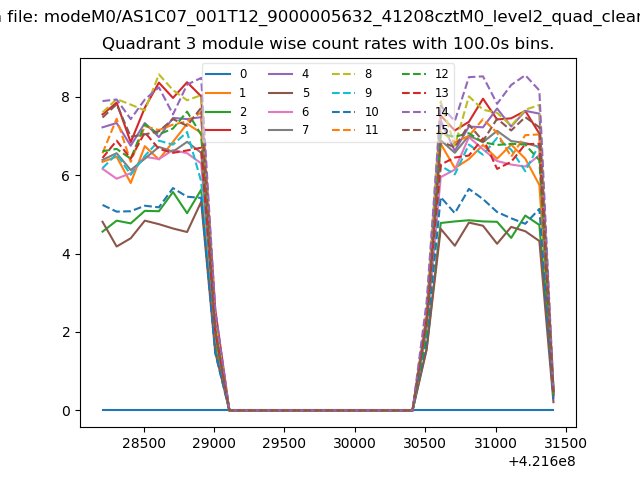
| Module-wise count rates for Quadrant A Data is divided into 100 sec bins |
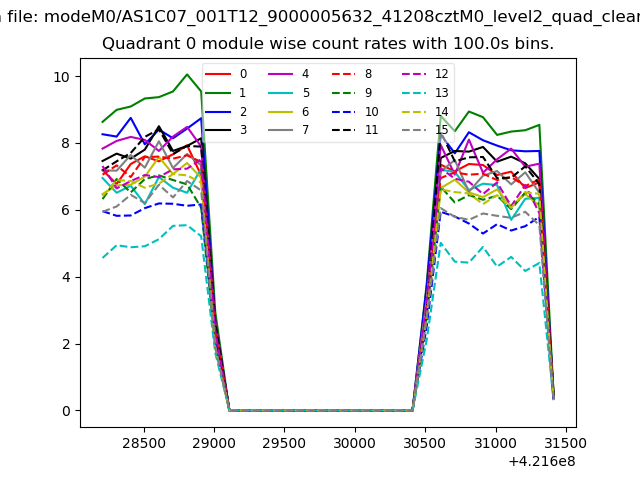 |
 |
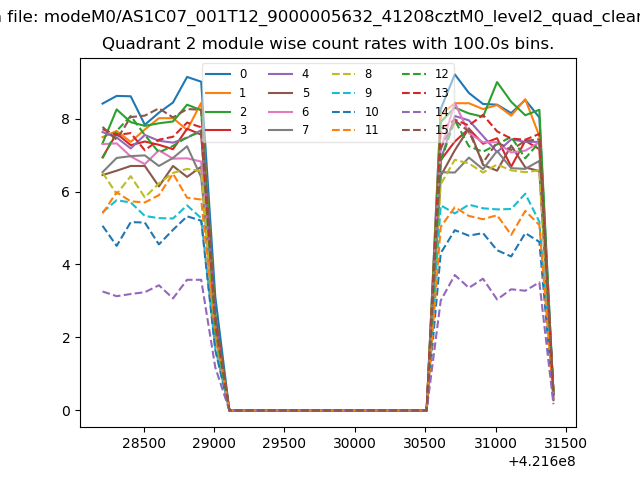
| Module-wise count rates for Quadrant B Data is divided into 100 sec bins |
 |
 |
| Module-wise count rates for Quadrant C Data is divided into 100 sec bins |
 |
 |
| Module-wise count rates for Quadrant D Data is divided into 100 sec bins |
 |
 |
| Parameter | Plot |
|---|---|
| CZT HV Monitor | 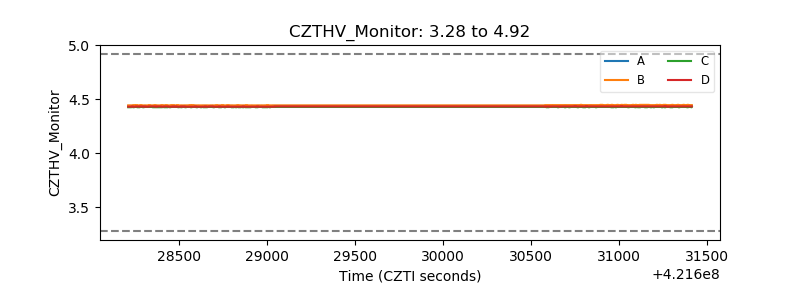 |
| D_VDD | 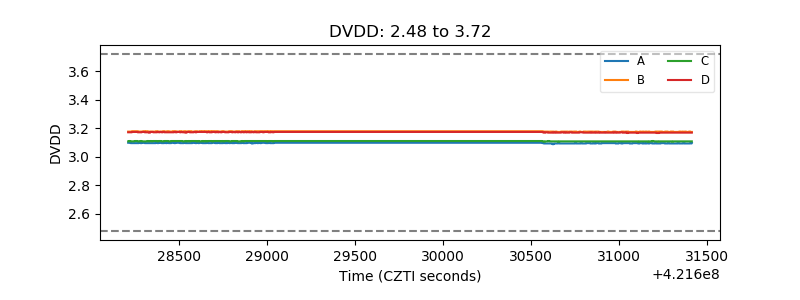 |
| Temperature 1 | 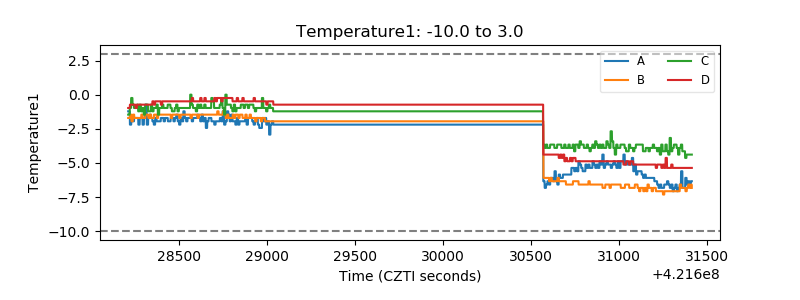 |
| Veto HV Monitor | 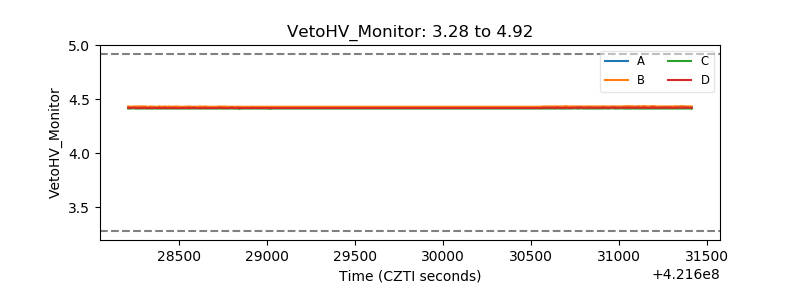 |
| Veto LLD | 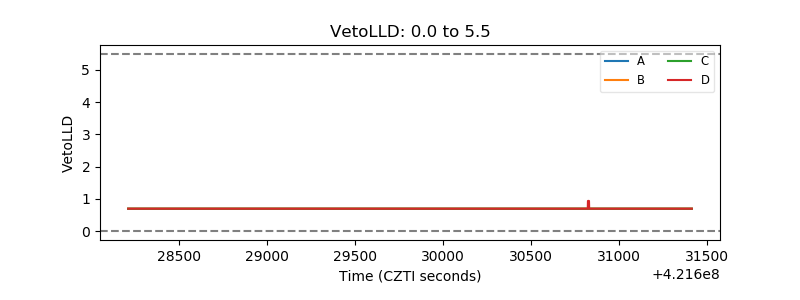 |
| Alpha Counter | 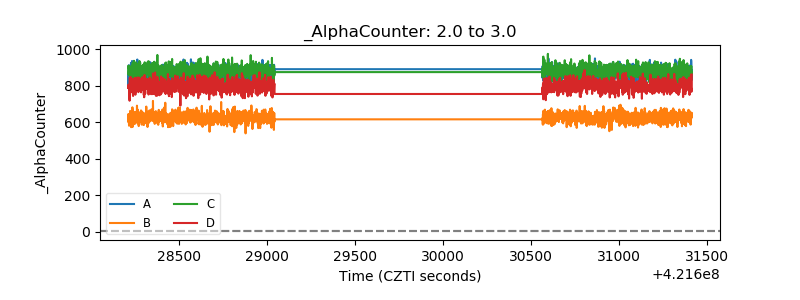 |
| _CPM_Rate | 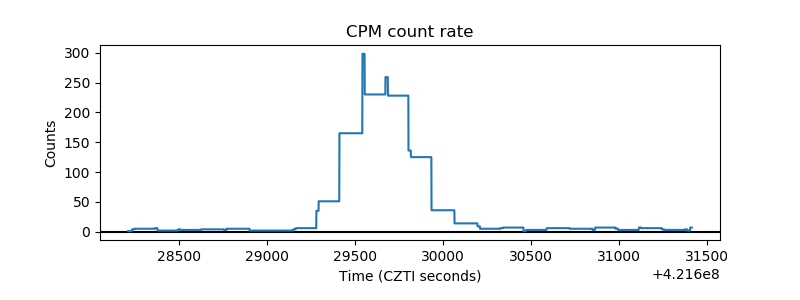 |
| CZT Counter | 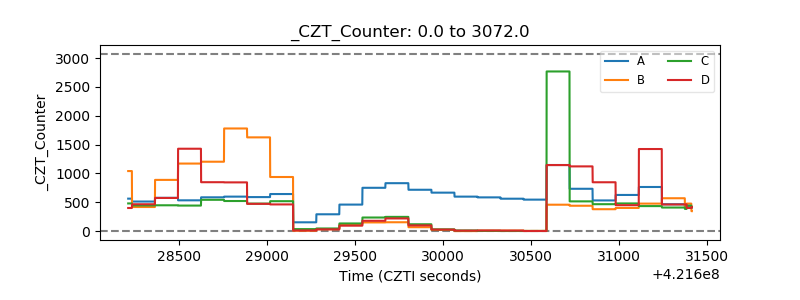 |
| +2.5 Volts monitor | 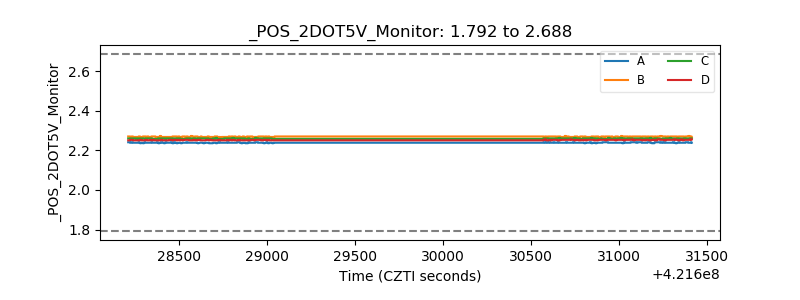 |
| +5 Volts monitor | 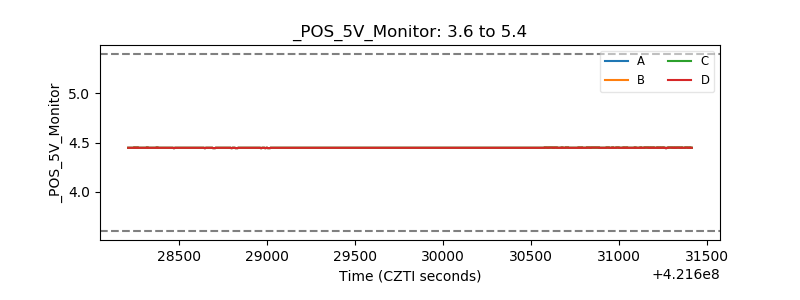 |
| _ROLL_ROT | 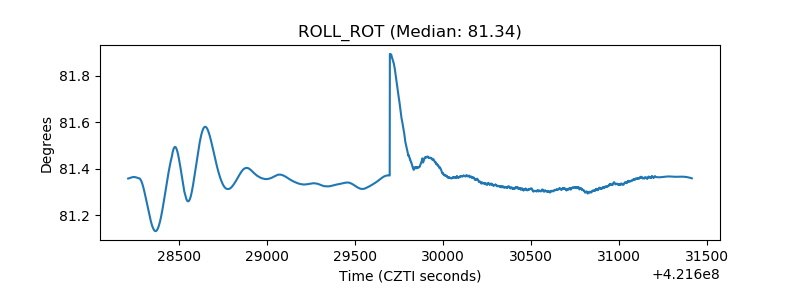 |
| _Roll_DEC | 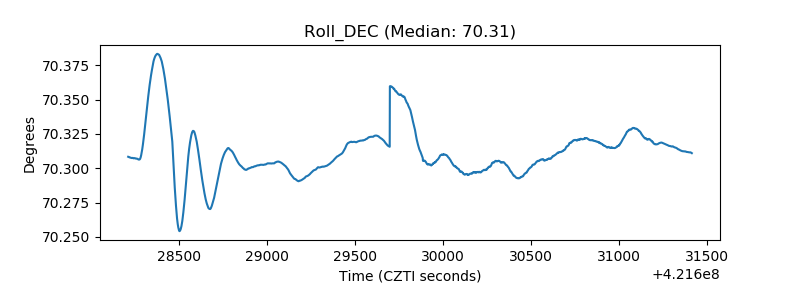 |
| _Roll_RA | 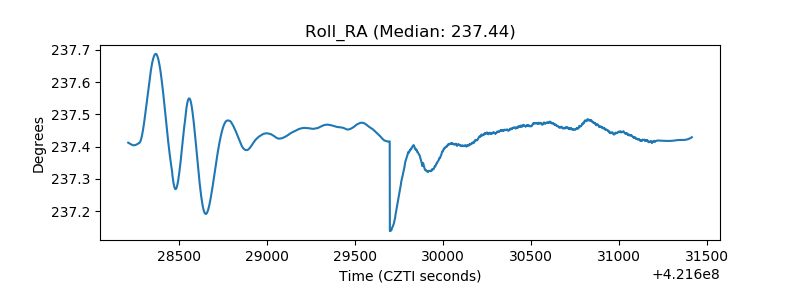 |
| Veto Counter | 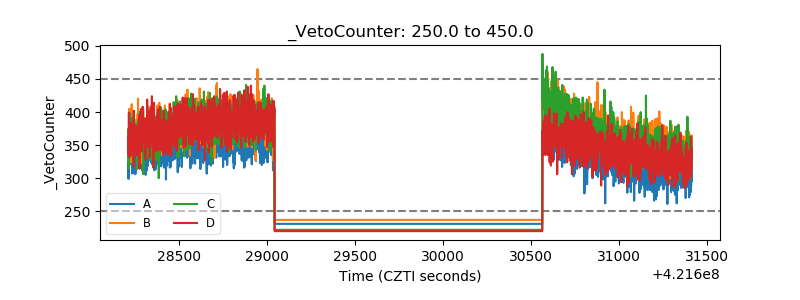 |