| Param | Original file | Final file |
|---|---|---|
| Filename | modeM0/AS1C07_001T12_9000005632_41209cztM0_level2.fits | modeM0/AS1C07_001T12_9000005632_41209cztM0_level2_quad_clean.evt |
| Size (bytes) | 331,614,720 | 88,640,640 |
| Size | 316.3 MB | 84.5 MB |
| Events in quadrant A | 2,842,109 | 590,179 |
| Events in quadrant B | 2,748,636 | 601,659 |
| Events in quadrant C | 3,131,893 | 575,659 |
| Events in quadrant D | 3,121,337 | 529,446 |
| Mode M0 | |||
|---|---|---|---|
| Quadrant | BADHDUFLAG | Total packets | Discarded packets |
| A | 0 | 11997 | 3 |
| B | 0 | 12486 | 2 |
| C | 0 | 13258 | 2 |
| D | 0 | 13544 | 2 |
| Mode M9 | |||
|---|---|---|---|
| Quadrant | BADHDUFLAG | Total packets | Discarded packets |
| A | 0 | 30 | 0 |
| B | 0 | 30 | 0 |
| C | 0 | 30 | 0 |
| D | 0 | 31 | 0 |
| Mode SS | |||
|---|---|---|---|
| Quadrant | BADHDUFLAG | Total packets | Discarded packets |
| A | 0 | 112 | 0 |
| B | 0 | 112 | 0 |
| C | 0 | 112 | 0 |
| D | 0 | 112 | 0 |
| Quadrant | Total seconds | Saturated seconds | Saturation percentage |
|---|---|---|---|
| A | 5533 | 6 | 0.108440% |
| B | 5533 | 35 | 0.632568% |
| C | 5533 | 149 | 2.692933% |
| D | 5533 | 156 | 2.819447% |
Noise dominated data is calculated using 1-second bins in cleaned event files. If a bin has >2000 counts, and if more than 50% of those come from <1% of pixels, then it is considered to be noise-dominated and hence unusable.
| Quadrant | # 1 sec bins | Bins with >0 counts | Bins with >2000 counts | High rate bins dominated by noise | Noise dominated (total time) | Noise dominated (detector-on time) | Marked lightcurve |
|---|---|---|---|---|---|---|---|
| A | 7207 | 5535 | 4 | 4 | 0.06% | 0.07% | 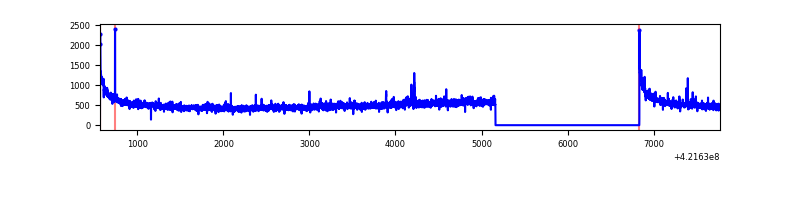 |
| B | 7207 | 5535 | 17 | 17 | 0.24% | 0.31% | 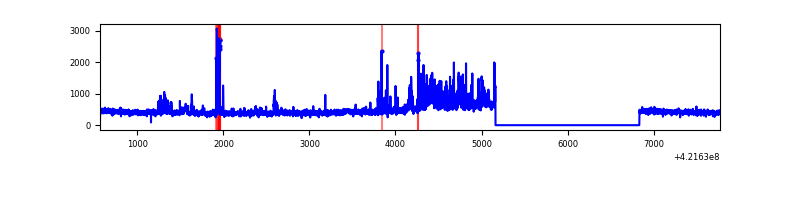 |
| C | 7207 | 5535 | 139 | 139 | 1.93% | 2.51% | 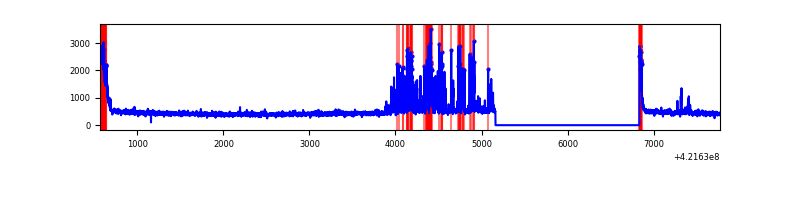 |
| D | 7207 | 5535 | 135 | 135 | 1.87% | 2.44% | 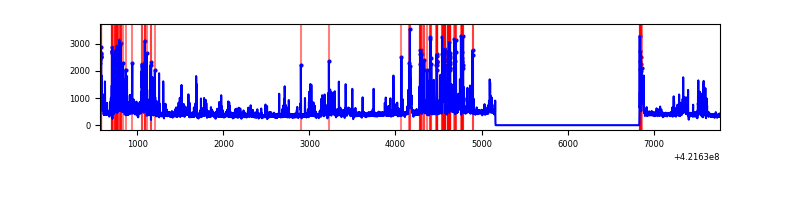 |
Top three noisy pixels from each quadrant. If the there are fewer than three noisy pixels in the level2.evt file, extra rows are filled as -1
| Pixel properties | Quadrant properties | ||||||
|---|---|---|---|---|---|---|---|
| Quadrant | DetID | PixID | Counts | Sigma | Mean | Median | Sigma |
| A | 10 | 83 | 535951 | 4549.99 | 572 | 560 | 117.7 |
| A | 12 | 189 | 61067 | 514.22 | 572 | 560 | 117.7 |
| A | 2 | 79 | 16692 | 137.1 | 572 | 560 | 117.7 |
| B | 0 | 186 | 236253 | 2138.65 | 569 | 554 | 110.2 |
| B | 0 | 229 | 155002 | 1401.4 | 569 | 554 | 110.2 |
| B | 0 | 190 | 110576 | 998.3 | 569 | 554 | 110.2 |
| C | 14 | 254 | 475083 | 3699.96 | 555 | 559 | 128.3 |
| C | 0 | 10 | 239175 | 1860.54 | 555 | 559 | 128.3 |
| C | 15 | 214 | 235936 | 1835.28 | 555 | 559 | 128.3 |
| D | 13 | 249 | 409659 | 3031.1 | 551 | 534 | 135.0 |
| D | 12 | 16 | 402889 | 2980.94 | 551 | 534 | 135.0 |
| D | 2 | 249 | 59721 | 438.5 | 551 | 534 | 135.0 |
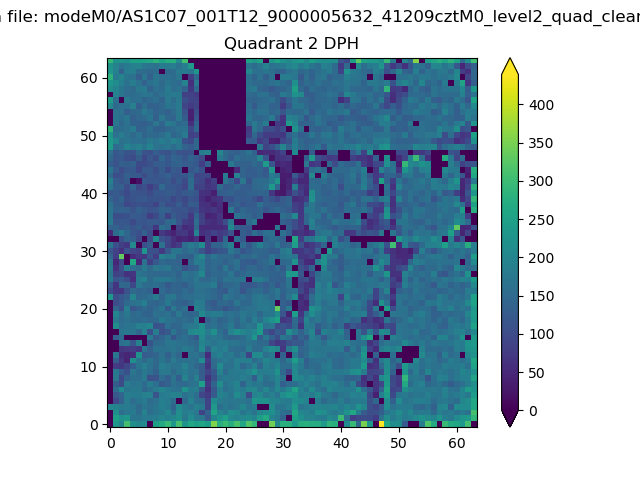
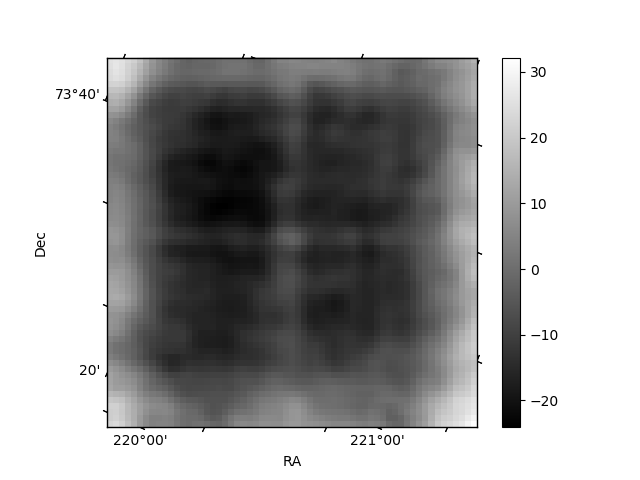
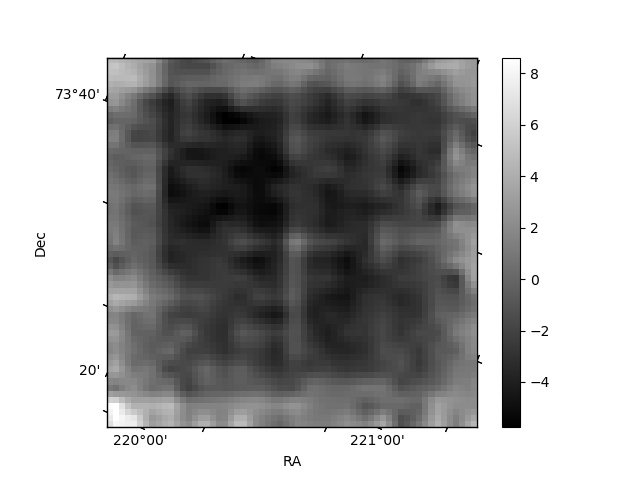
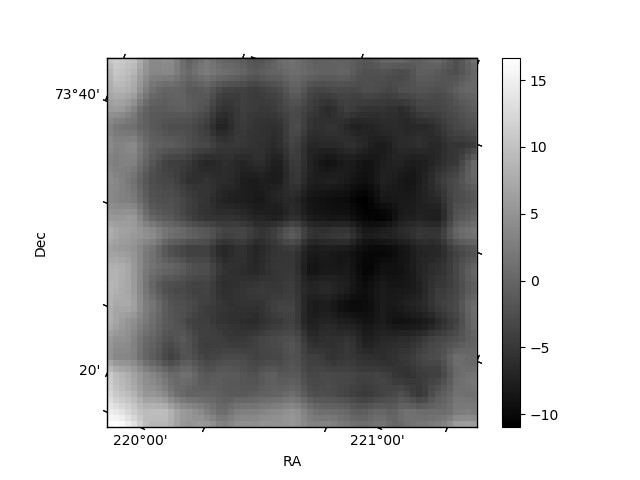
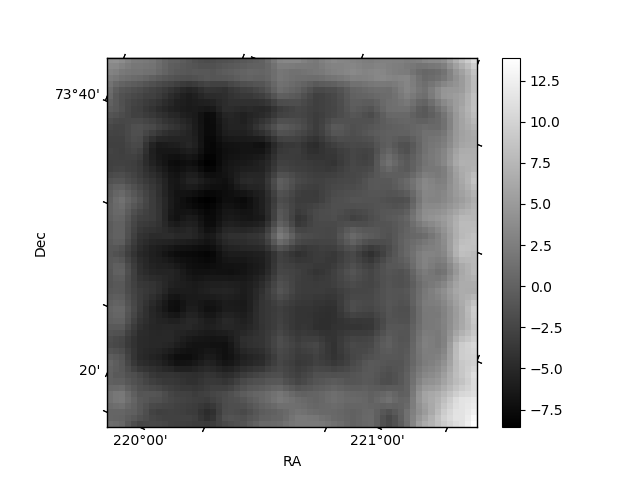
Histogram calculated using DETX and DETY for each event in the final _common_clean file
| Quadrant A | 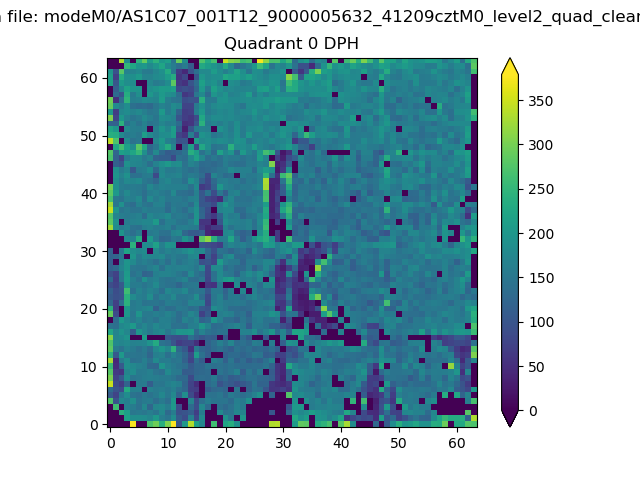 |
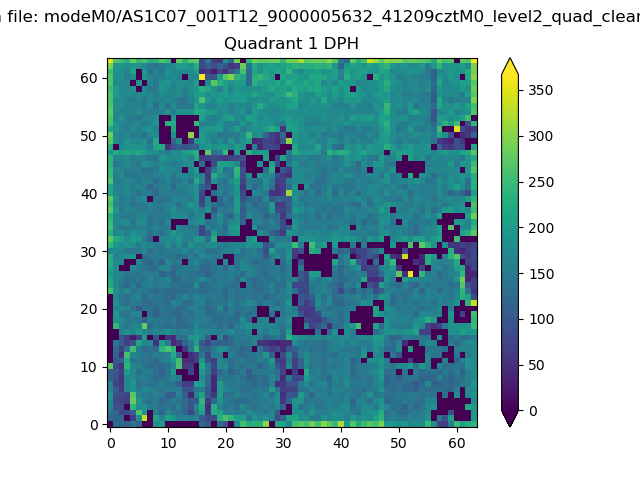 |
Quadrant B |
|---|---|---|---|
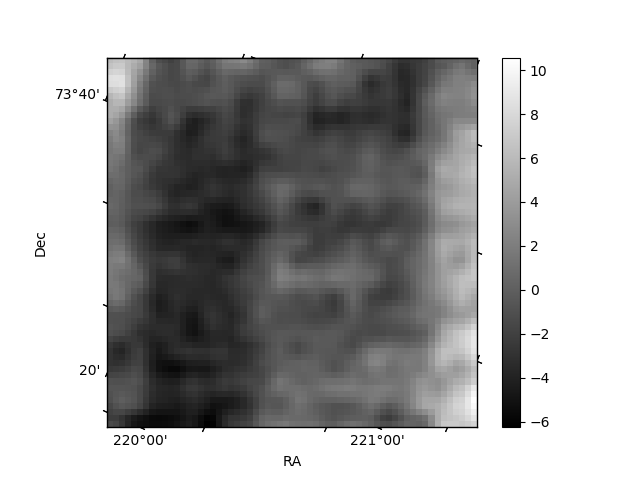
| Quadrant D | 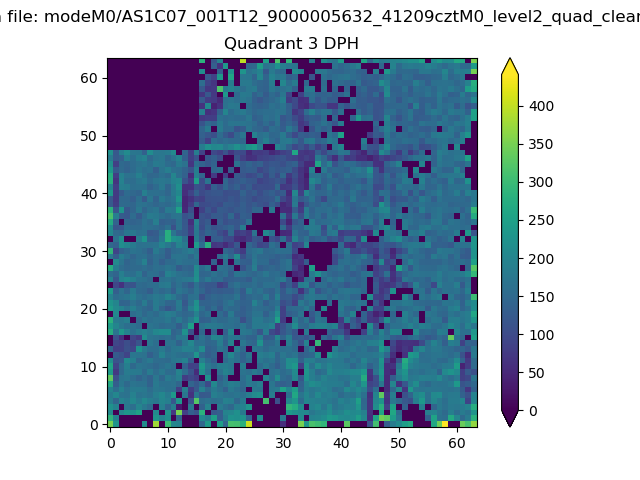 |
 |
Quadrant C |
| Plot type | Count rate plots | Images |
|---|---|---|
| Comparison with Poisson distribution Blue bars denote a histogram of data divided into 1 sec bins. Red curve is a Poisson curve with rate = median count rate of data. |
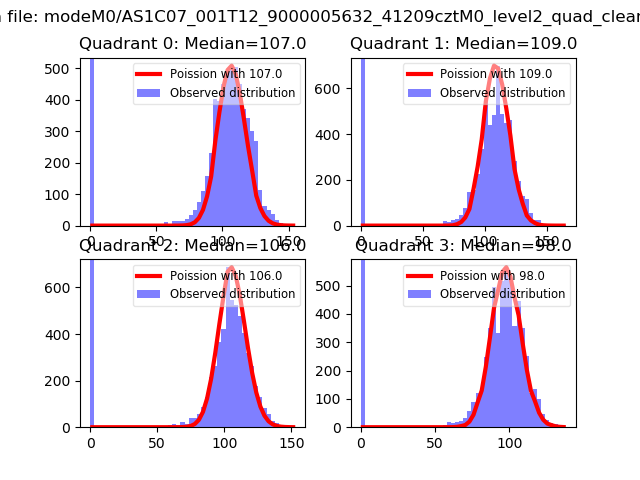 |
 |
| Quadrant-wise count rates Data is divided into 100 sec bins |
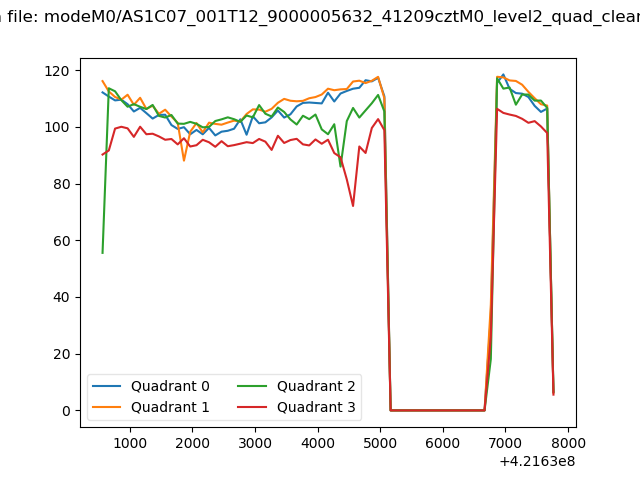 |
|
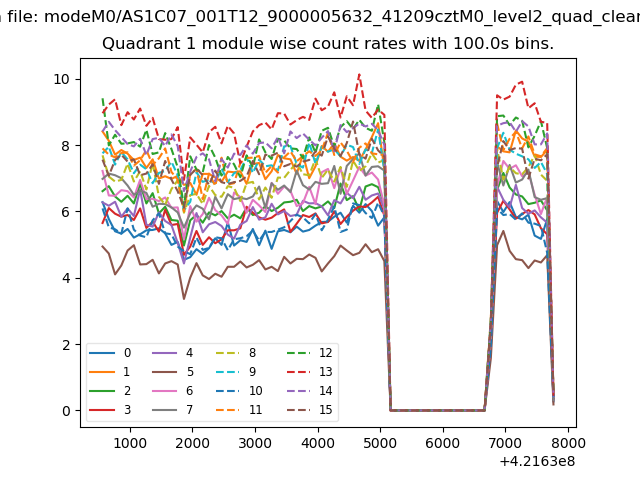
| Module-wise count rates for Quadrant A Data is divided into 100 sec bins |
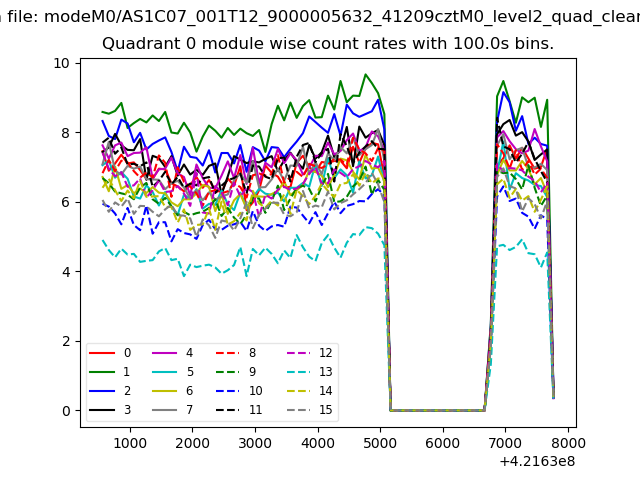 |
 |
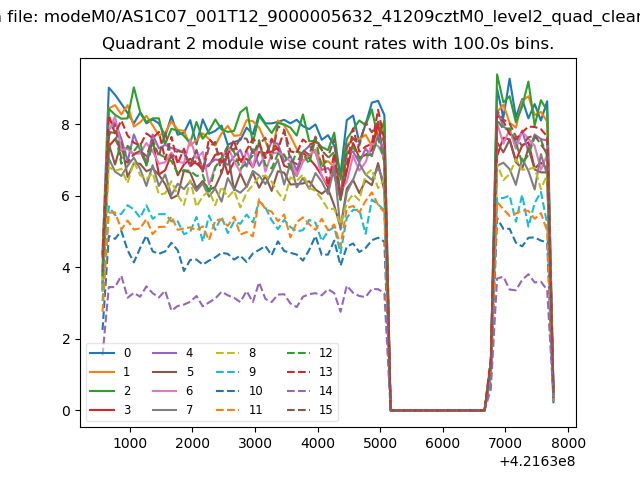
| Module-wise count rates for Quadrant B Data is divided into 100 sec bins |
 |
 |
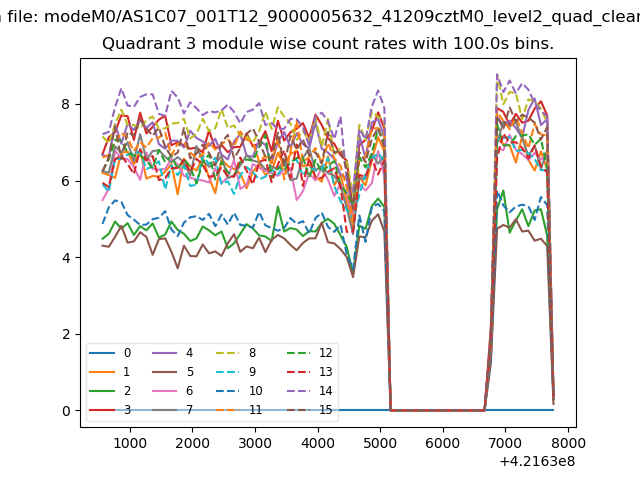
| Module-wise count rates for Quadrant C Data is divided into 100 sec bins |
 |
 |
| Module-wise count rates for Quadrant D Data is divided into 100 sec bins |
 |
 |
| Parameter | Plot |
|---|---|
| CZT HV Monitor | 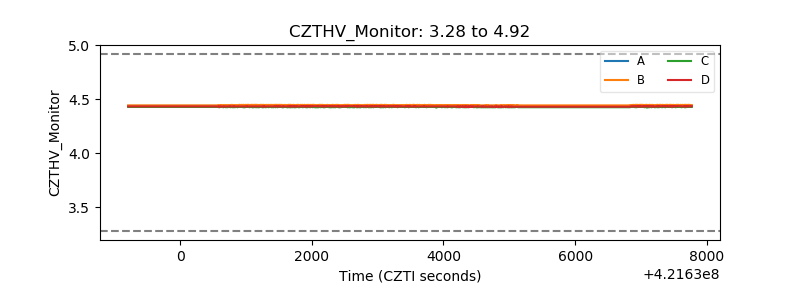 |
| D_VDD | 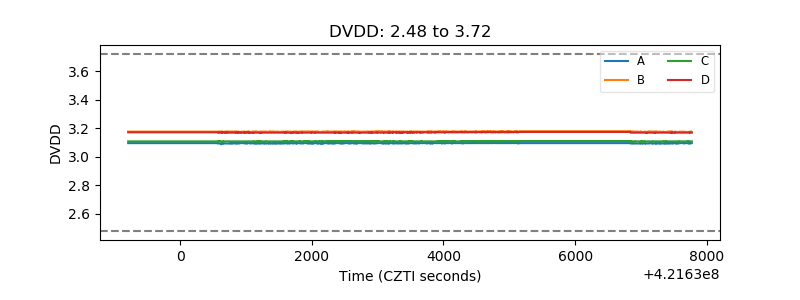 |
| Temperature 1 | 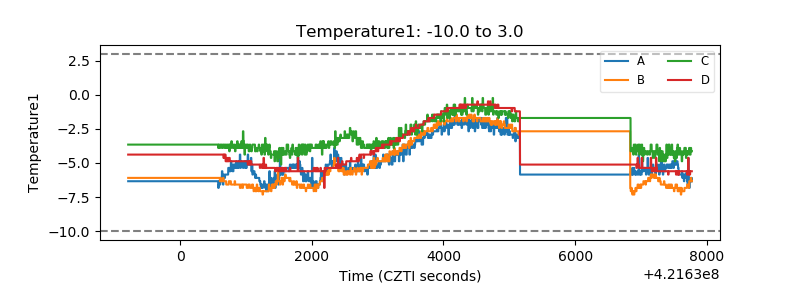 |
| Veto HV Monitor | 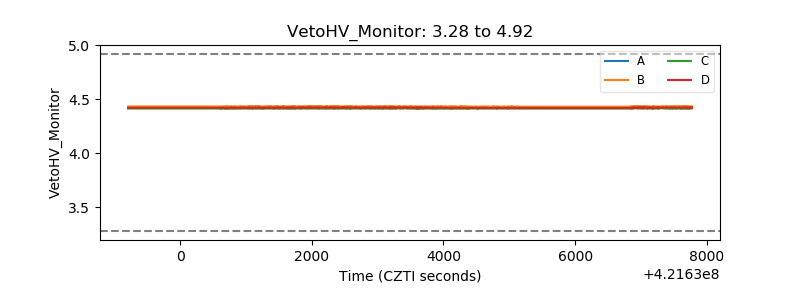 |
| Veto LLD | 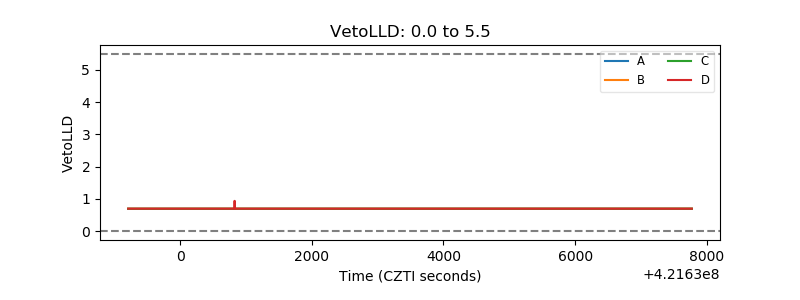 |
| Alpha Counter | 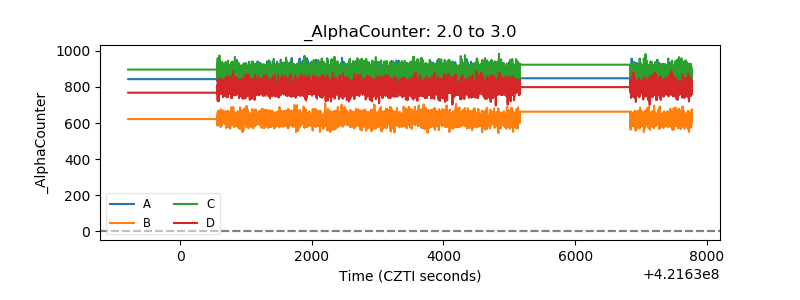 |
| _CPM_Rate | 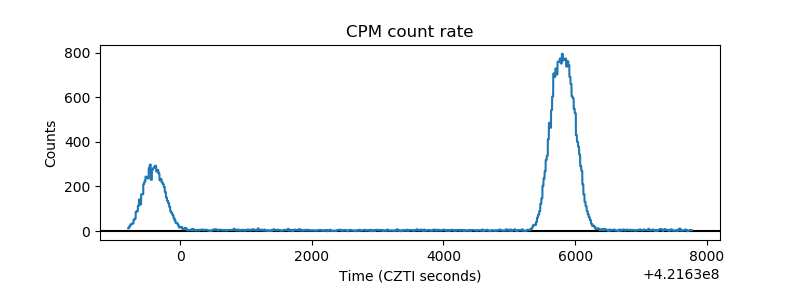 |
| CZT Counter | 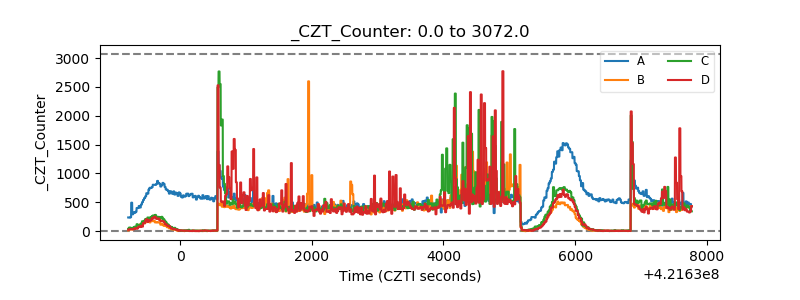 |
| +2.5 Volts monitor | 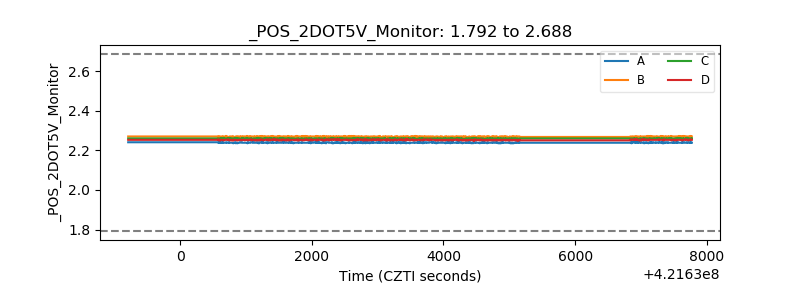 |
| +5 Volts monitor | 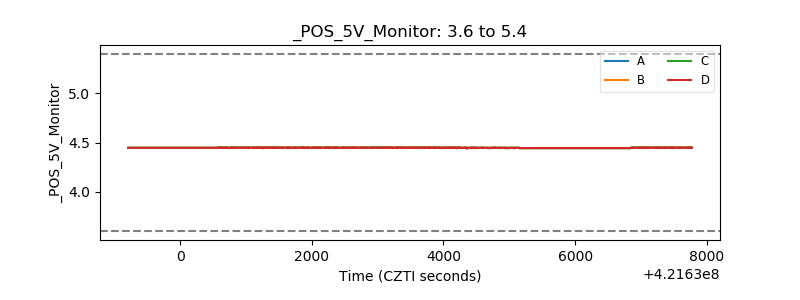 |
| _ROLL_ROT | 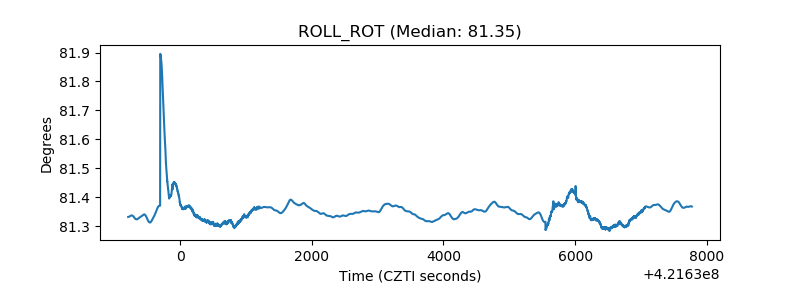 |
| _Roll_DEC | 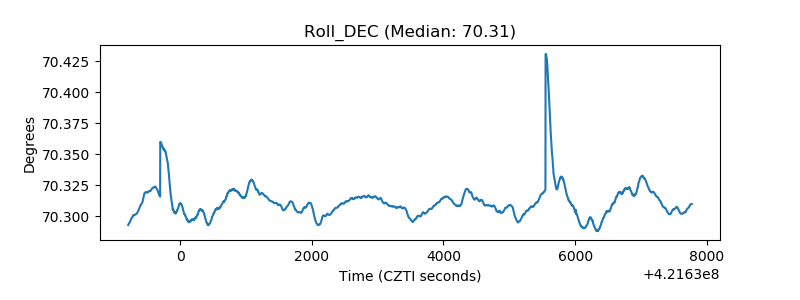 |
| _Roll_RA | 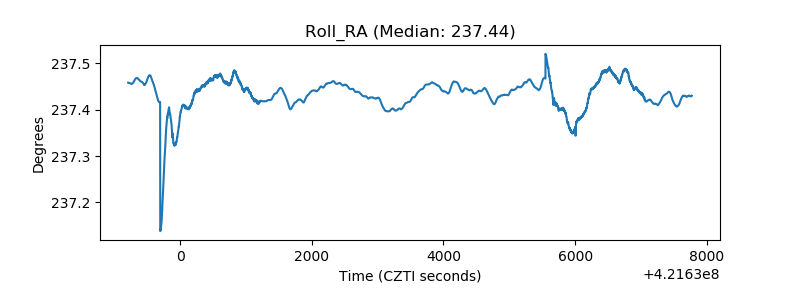 |
| Veto Counter | 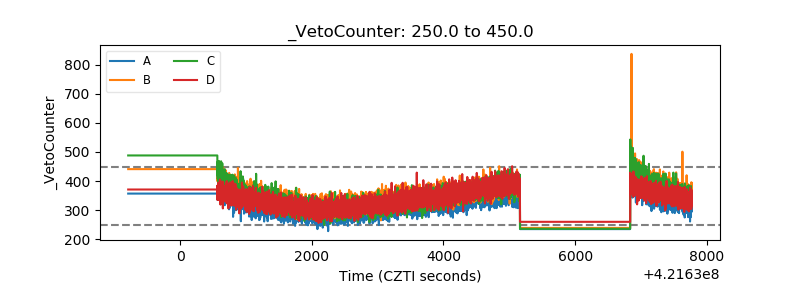 |