| Param | Original file | Final file |
|---|---|---|
| Filename | modeM0/AS1C07_001T12_9000005632_41211cztM0_level2.fits | modeM0/AS1C07_001T12_9000005632_41211cztM0_level2_quad_clean.evt |
| Size (bytes) | 345,248,640 | 91,160,640 |
| Size | 329.3 MB | 86.9 MB |
| Events in quadrant A | 2,892,834 | 611,249 |
| Events in quadrant B | 2,690,537 | 626,848 |
| Events in quadrant C | 3,370,137 | 593,805 |
| Events in quadrant D | 3,392,048 | 537,837 |
| Mode M0 | |||
|---|---|---|---|
| Quadrant | BADHDUFLAG | Total packets | Discarded packets |
| A | 0 | 12011 | 3 |
| B | 0 | 12297 | 2 |
| C | 0 | 13709 | 2 |
| D | 0 | 14314 | 2 |
| Mode M9 | |||
|---|---|---|---|
| Quadrant | BADHDUFLAG | Total packets | Discarded packets |
| A | 0 | 34 | 0 |
| B | 0 | 34 | 0 |
| C | 0 | 34 | 0 |
| D | 0 | 34 | 0 |
| Mode SS | |||
|---|---|---|---|
| Quadrant | BADHDUFLAG | Total packets | Discarded packets |
| A | 0 | 118 | 0 |
| B | 0 | 118 | 0 |
| C | 0 | 118 | 0 |
| D | 0 | 118 | 0 |
| Quadrant | Total seconds | Saturated seconds | Saturation percentage |
|---|---|---|---|
| A | 5576 | 9 | 0.161406% |
| B | 5576 | 37 | 0.663558% |
| C | 5576 | 148 | 2.654232% |
| D | 5576 | 251 | 4.501435% |
Noise dominated data is calculated using 1-second bins in cleaned event files. If a bin has >2000 counts, and if more than 50% of those come from <1% of pixels, then it is considered to be noise-dominated and hence unusable.
| Quadrant | # 1 sec bins | Bins with >0 counts | Bins with >2000 counts | High rate bins dominated by noise | Noise dominated (total time) | Noise dominated (detector-on time) | Marked lightcurve |
|---|---|---|---|---|---|---|---|
| A | 9042 | 5578 | 3 | 3 | 0.03% | 0.05% | 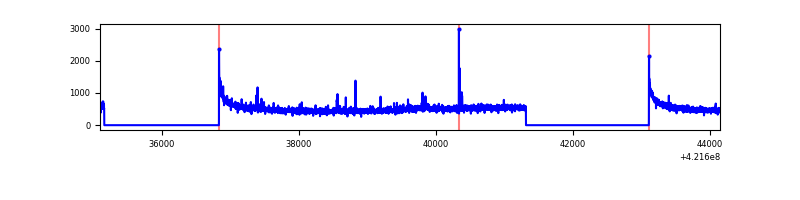 |
| B | 9042 | 5578 | 14 | 14 | 0.15% | 0.25% | 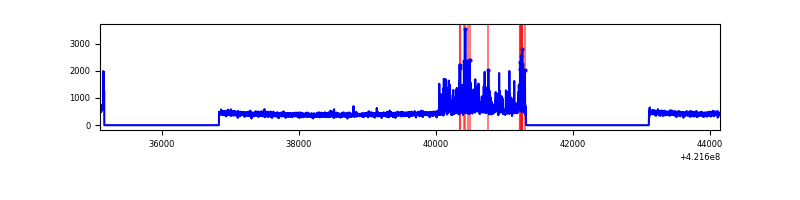 |
| C | 9042 | 5578 | 129 | 129 | 1.43% | 2.31% | 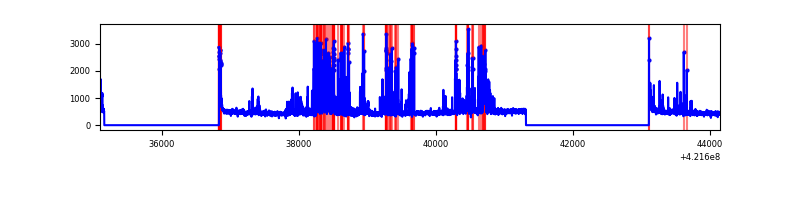 |
| D | 9042 | 5578 | 227 | 227 | 2.51% | 4.07% | 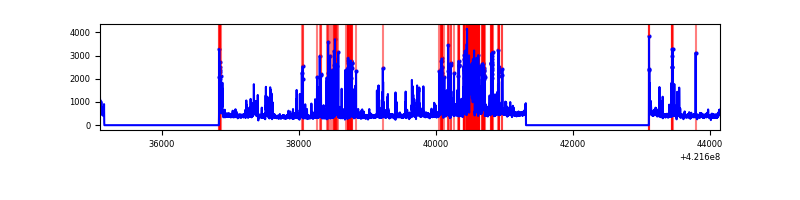 |
Top three noisy pixels from each quadrant. If the there are fewer than three noisy pixels in the level2.evt file, extra rows are filled as -1
| Pixel properties | Quadrant properties | ||||||
|---|---|---|---|---|---|---|---|
| Quadrant | DetID | PixID | Counts | Sigma | Mean | Median | Sigma |
| A | 10 | 83 | 538432 | 4480.93 | 588 | 575 | 120.0 |
| A | 12 | 189 | 30429 | 248.72 | 588 | 575 | 120.0 |
| A | 2 | 79 | 16305 | 131.05 | 588 | 575 | 120.0 |
| B | 0 | 186 | 194412 | 1715.8 | 585 | 568 | 113.0 |
| B | 0 | 190 | 117205 | 1032.41 | 585 | 568 | 113.0 |
| B | 15 | 85 | 57597 | 504.79 | 585 | 568 | 113.0 |
| C | 14 | 254 | 831287 | 6362.1 | 565 | 569 | 130.6 |
| C | 15 | 214 | 239696 | 1831.37 | 565 | 569 | 130.6 |
| C | 0 | 10 | 84699 | 644.31 | 565 | 569 | 130.6 |
| D | 13 | 249 | 689881 | 5062.68 | 558 | 540 | 136.2 |
| D | 12 | 16 | 423182 | 3103.98 | 558 | 540 | 136.2 |
| D | 2 | 249 | 42038 | 304.77 | 558 | 540 | 136.2 |
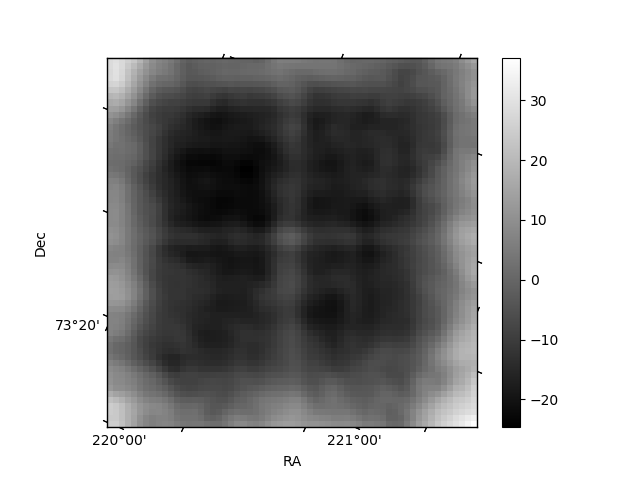
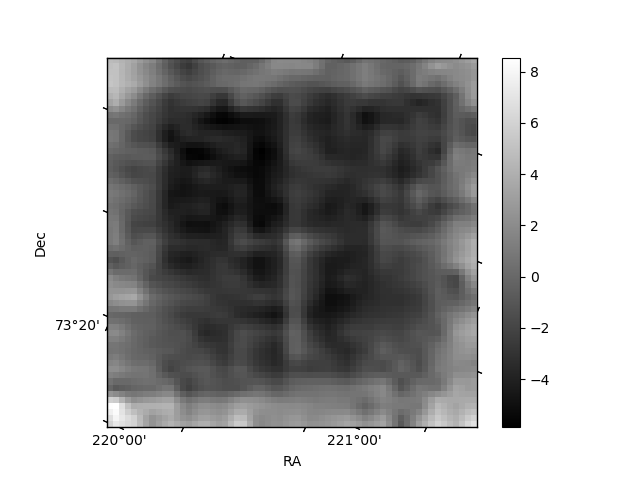
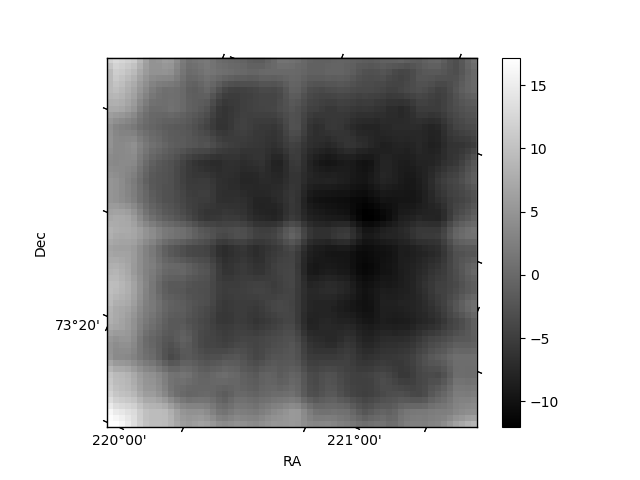
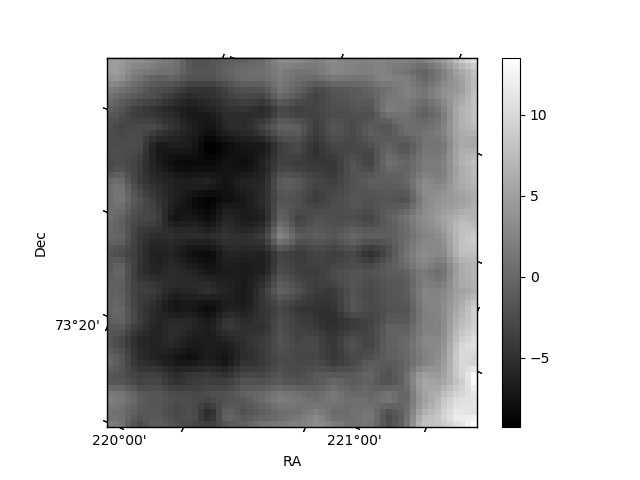
Histogram calculated using DETX and DETY for each event in the final _common_clean file
| Quadrant A | 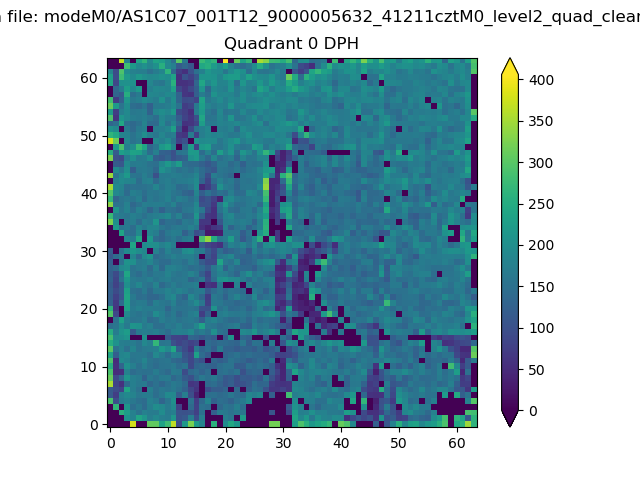 |
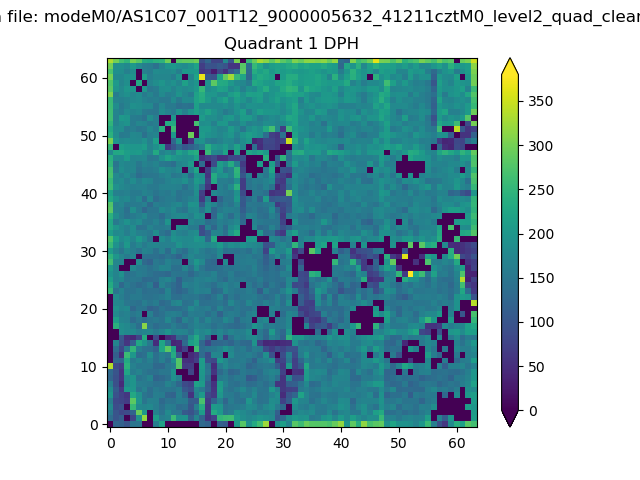 |
Quadrant B |
|---|---|---|---|
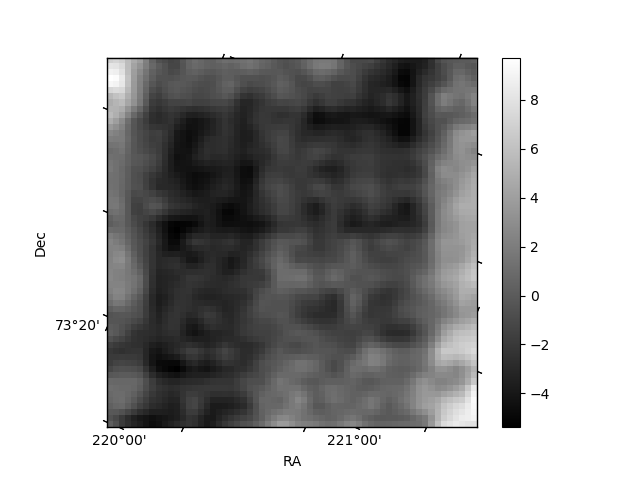
| Quadrant D | 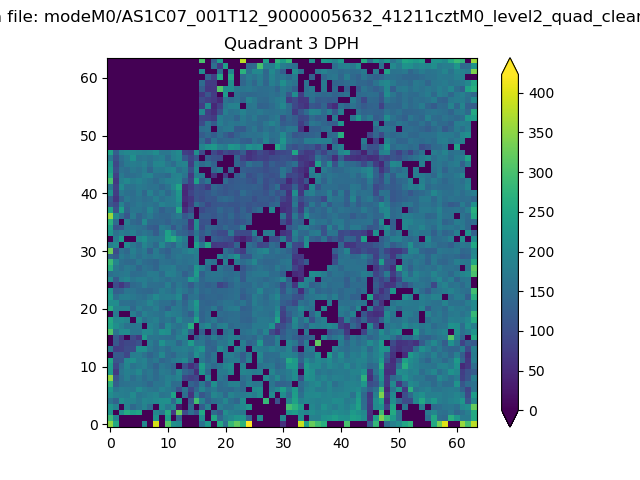 |
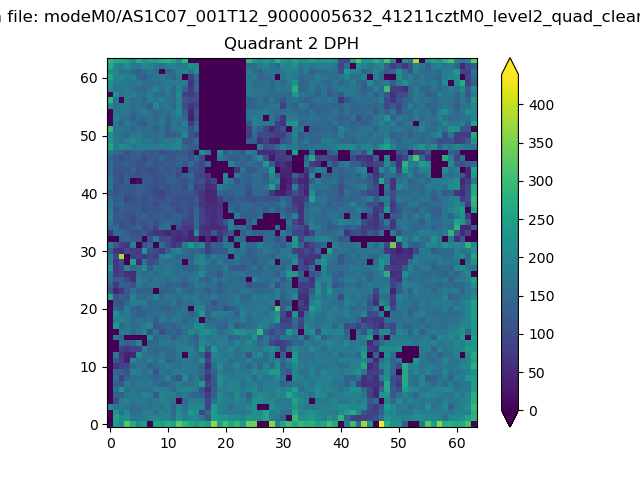 |
Quadrant C |
| Plot type | Count rate plots | Images |
|---|---|---|
| Comparison with Poisson distribution Blue bars denote a histogram of data divided into 1 sec bins. Red curve is a Poisson curve with rate = median count rate of data. |
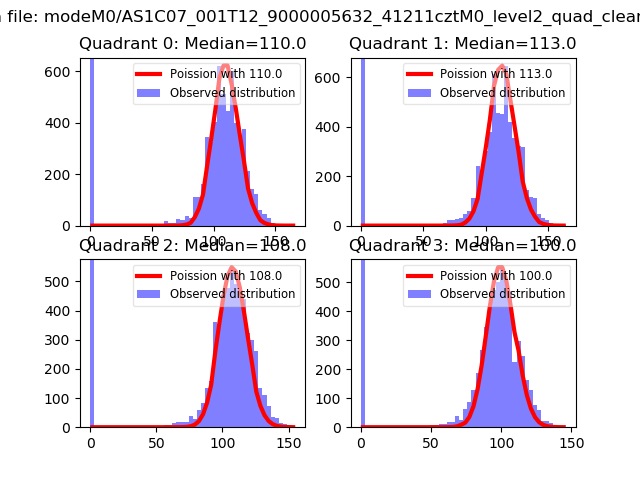 |
 |
| Quadrant-wise count rates Data is divided into 100 sec bins |
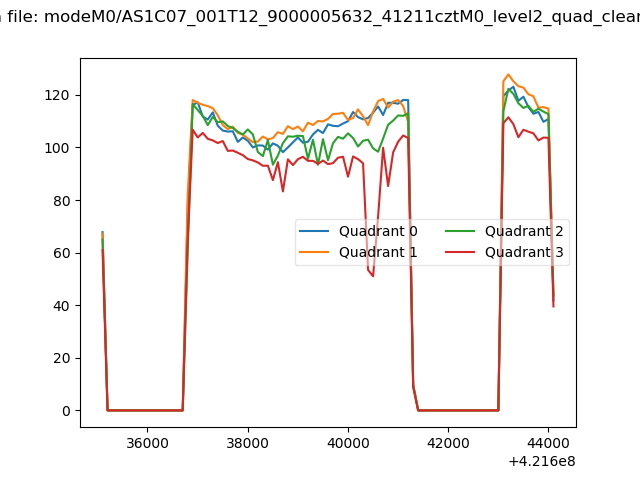 |
|
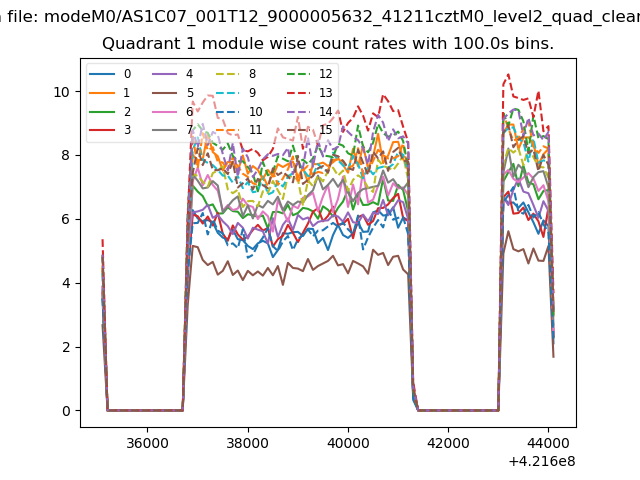
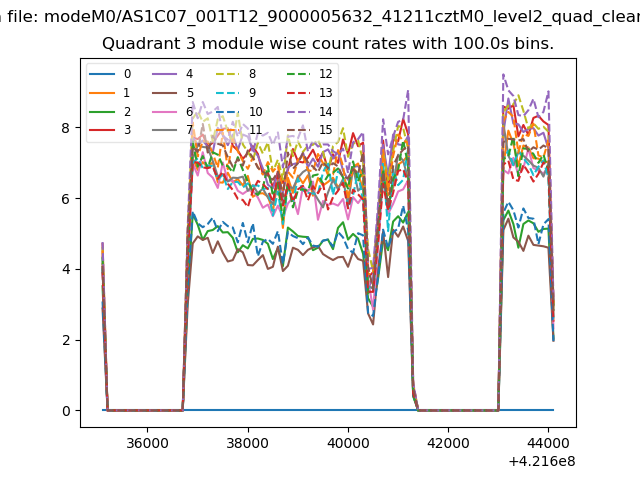
| Module-wise count rates for Quadrant A Data is divided into 100 sec bins |
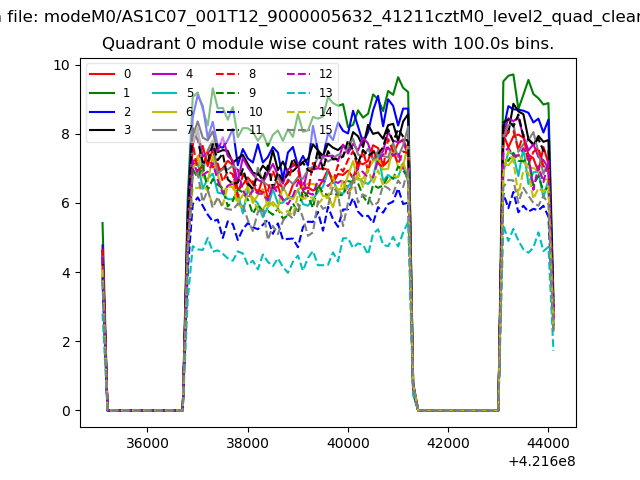 |
 |
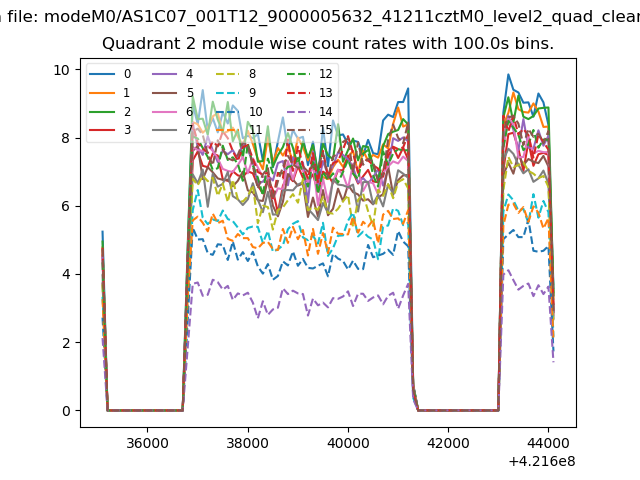
| Module-wise count rates for Quadrant B Data is divided into 100 sec bins |
 |
 |
| Module-wise count rates for Quadrant C Data is divided into 100 sec bins |
 |
 |
| Module-wise count rates for Quadrant D Data is divided into 100 sec bins |
 |
 |
| Parameter | Plot |
|---|---|
| CZT HV Monitor | 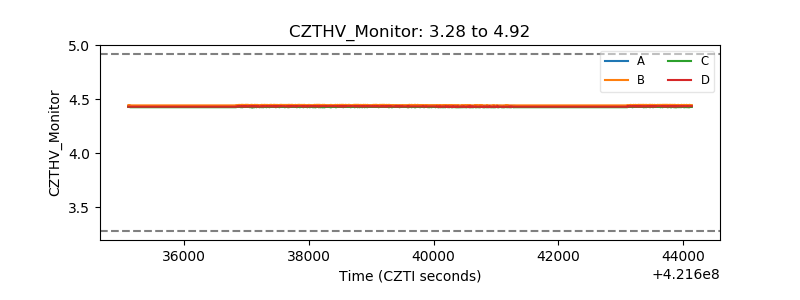 |
| D_VDD | 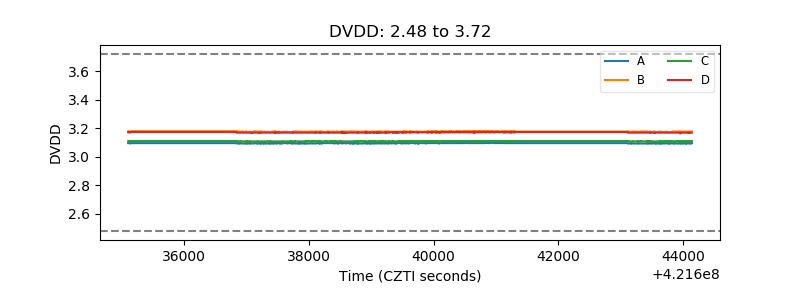 |
| Temperature 1 | 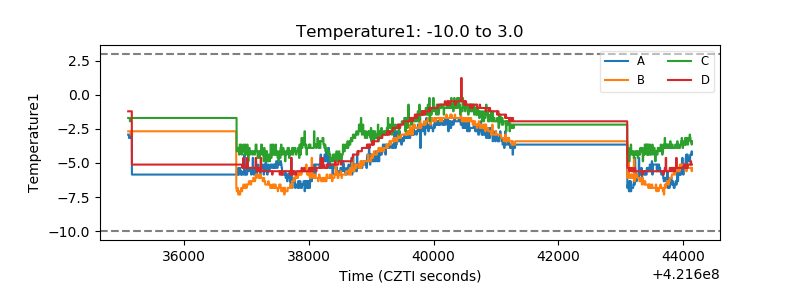 |
| Veto HV Monitor |  |
| Veto LLD | 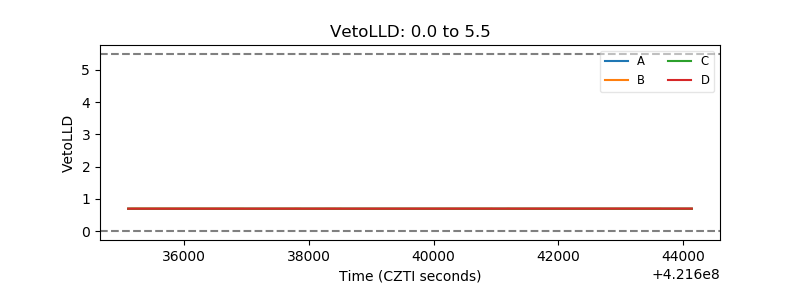 |
| Alpha Counter | 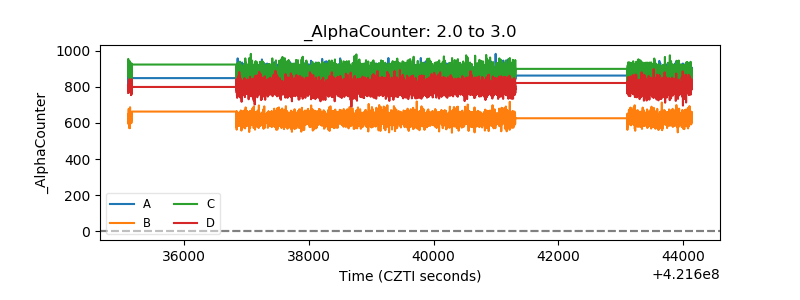 |
| _CPM_Rate | 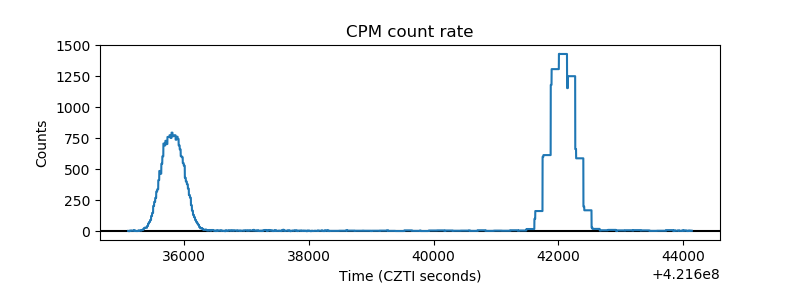 |
| CZT Counter | 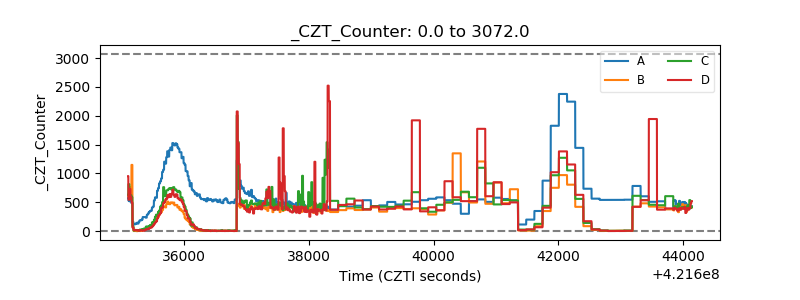 |
| +2.5 Volts monitor | 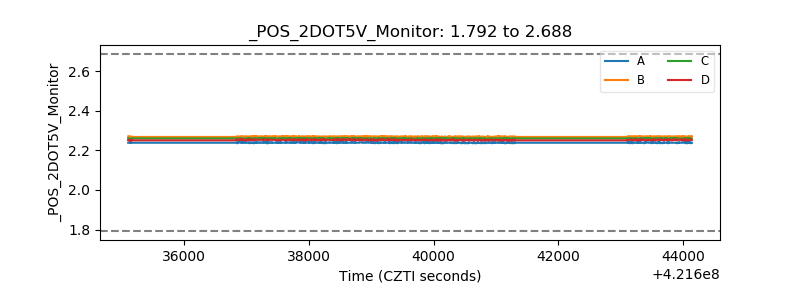 |
| +5 Volts monitor | 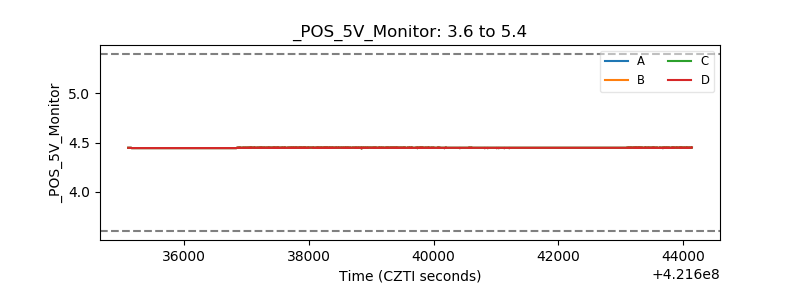 |
| _ROLL_ROT | 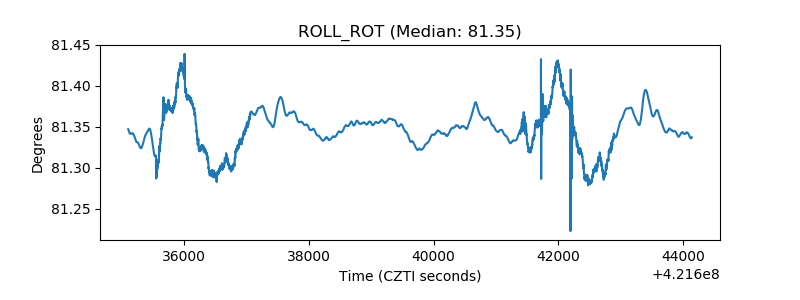 |
| _Roll_DEC | 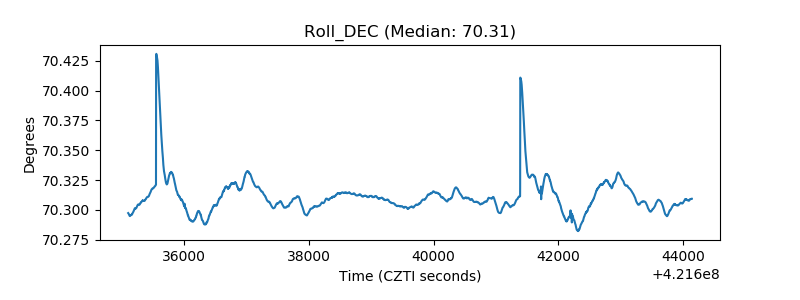 |
| _Roll_RA | 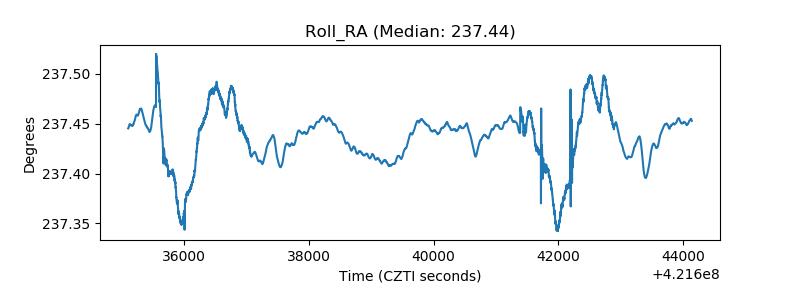 |
| Veto Counter | 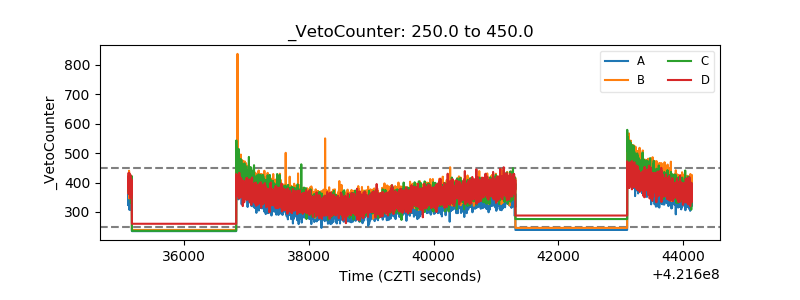 |