| Param | Original file | Final file |
|---|---|---|
| Filename | modeM0/AS1C07_001T12_9000005632_41212cztM0_level2.fits | modeM0/AS1C07_001T12_9000005632_41212cztM0_level2_quad_clean.evt |
| Size (bytes) | 326,116,800 | 89,530,560 |
| Size | 311.0 MB | 85.4 MB |
| Events in quadrant A | 2,843,302 | 605,513 |
| Events in quadrant B | 2,636,965 | 623,162 |
| Events in quadrant C | 2,649,102 | 589,486 |
| Events in quadrant D | 3,529,720 | 521,677 |
| Mode M0 | |||
|---|---|---|---|
| Quadrant | BADHDUFLAG | Total packets | Discarded packets |
| A | 0 | 11648 | 3 |
| B | 0 | 11698 | 2 |
| C | 0 | 11371 | 2 |
| D | 0 | 14343 | 2 |
| Mode M9 | |||
|---|---|---|---|
| Quadrant | BADHDUFLAG | Total packets | Discarded packets |
| A | 0 | 25 | 0 |
| B | 0 | 25 | 0 |
| C | 0 | 25 | 0 |
| D | 0 | 26 | 0 |
| Mode SS | |||
|---|---|---|---|
| Quadrant | BADHDUFLAG | Total packets | Discarded packets |
| A | 0 | 110 | 0 |
| B | 0 | 110 | 0 |
| C | 0 | 110 | 0 |
| D | 0 | 110 | 0 |
| Quadrant | Total seconds | Saturated seconds | Saturation percentage |
|---|---|---|---|
| A | 5294 | 10 | 0.188893% |
| B | 5294 | 40 | 0.755572% |
| C | 5294 | 29 | 0.547790% |
| D | 5294 | 313 | 5.912354% |
Noise dominated data is calculated using 1-second bins in cleaned event files. If a bin has >2000 counts, and if more than 50% of those come from <1% of pixels, then it is considered to be noise-dominated and hence unusable.
| Quadrant | # 1 sec bins | Bins with >0 counts | Bins with >2000 counts | High rate bins dominated by noise | Noise dominated (total time) | Noise dominated (detector-on time) | Marked lightcurve |
|---|---|---|---|---|---|---|---|
| A | 7237 | 5295 | 4 | 4 | 0.06% | 0.08% | 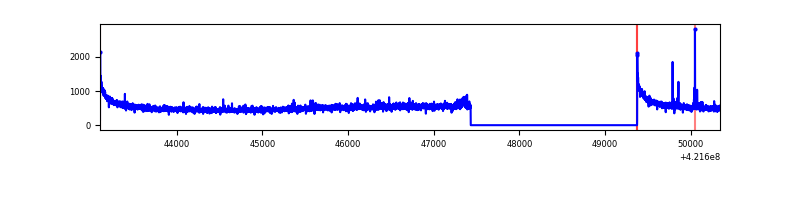 |
| B | 7237 | 5295 | 24 | 24 | 0.33% | 0.45% | 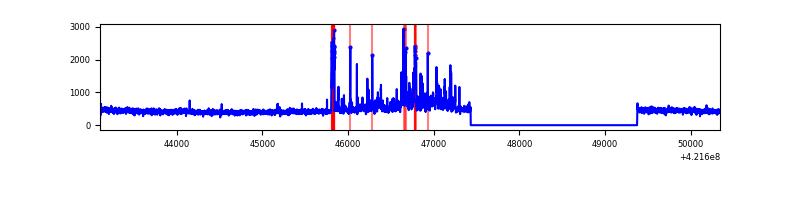 |
| C | 7237 | 5295 | 28 | 28 | 0.39% | 0.53% | 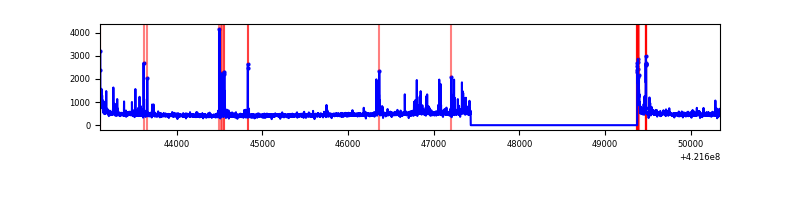 |
| D | 7237 | 5295 | 268 | 268 | 3.70% | 5.06% | 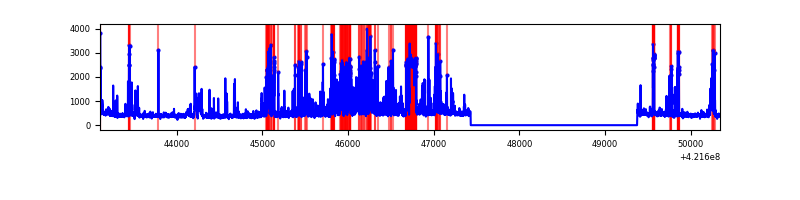 |
Top three noisy pixels from each quadrant. If the there are fewer than three noisy pixels in the level2.evt file, extra rows are filled as -1
| Pixel properties | Quadrant properties | ||||||
|---|---|---|---|---|---|---|---|
| Quadrant | DetID | PixID | Counts | Sigma | Mean | Median | Sigma |
| A | 10 | 83 | 528825 | 4539.67 | 575 | 563 | 116.4 |
| A | 12 | 189 | 53603 | 455.8 | 575 | 563 | 116.4 |
| A | 0 | 8 | 18078 | 150.52 | 575 | 563 | 116.4 |
| B | 0 | 186 | 283920 | 2590.79 | 571 | 556 | 109.4 |
| B | 0 | 190 | 68330 | 619.66 | 571 | 556 | 109.4 |
| B | 0 | 245 | 23369 | 208.58 | 571 | 556 | 109.4 |
| C | 15 | 214 | 231220 | 1814.77 | 552 | 554 | 127.1 |
| C | 14 | 254 | 193247 | 1516.02 | 552 | 554 | 127.1 |
| C | 0 | 10 | 66073 | 515.47 | 552 | 554 | 127.1 |
| D | 12 | 16 | 522570 | 4009.37 | 537 | 520 | 130.2 |
| D | 13 | 249 | 433048 | 3321.83 | 537 | 520 | 130.2 |
| D | 5 | 222 | 266209 | 2040.5 | 537 | 520 | 130.2 |
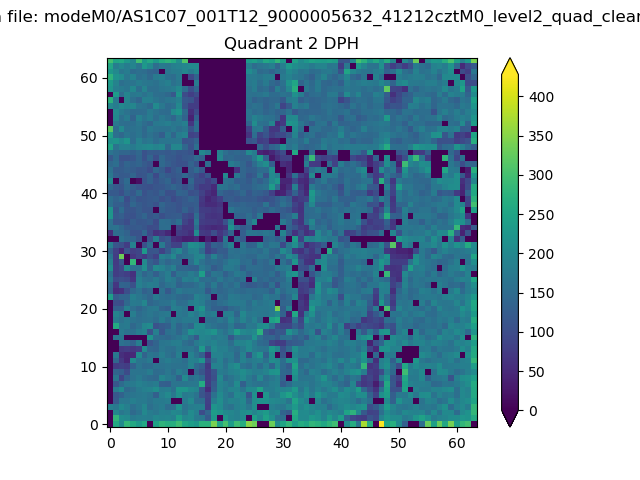
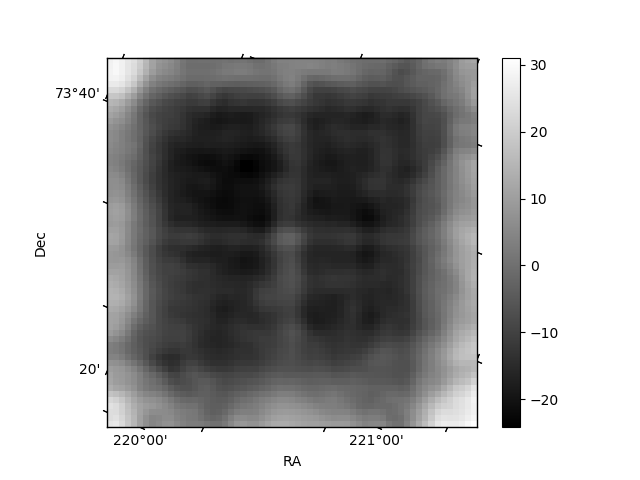
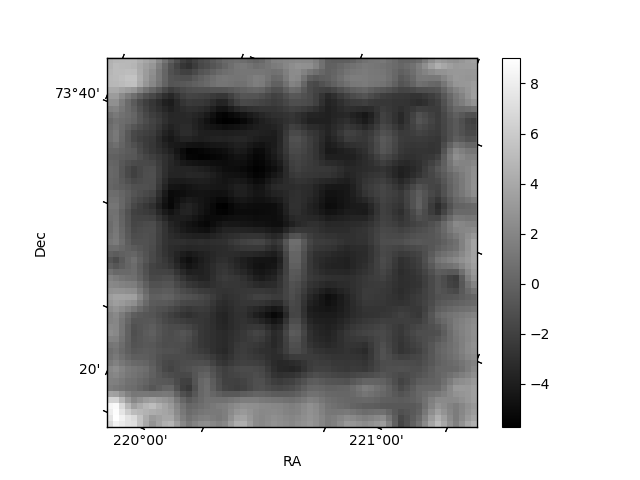
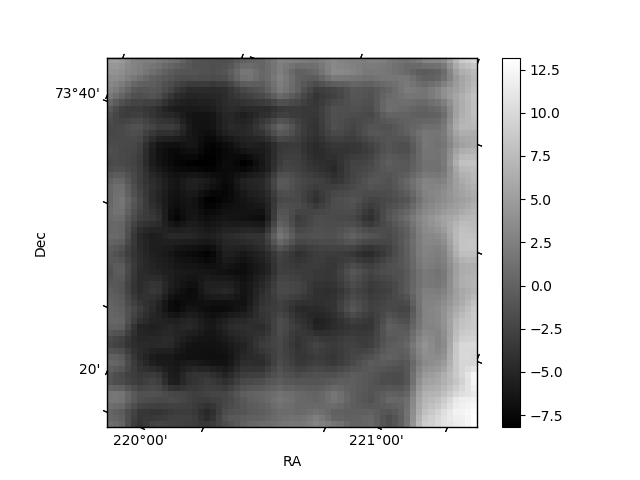
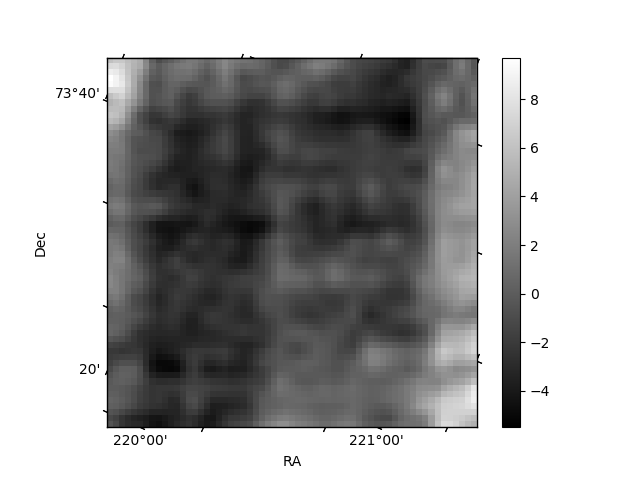
Histogram calculated using DETX and DETY for each event in the final _common_clean file
| Quadrant A | 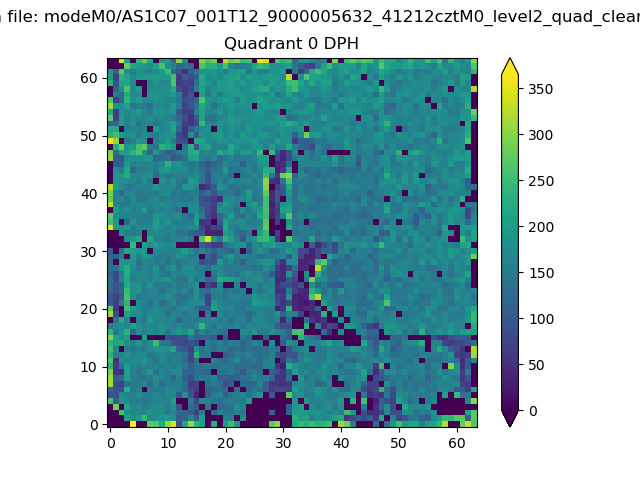 |
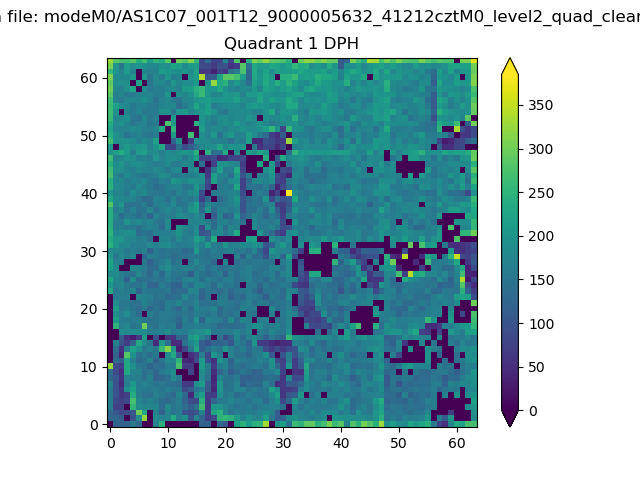 |
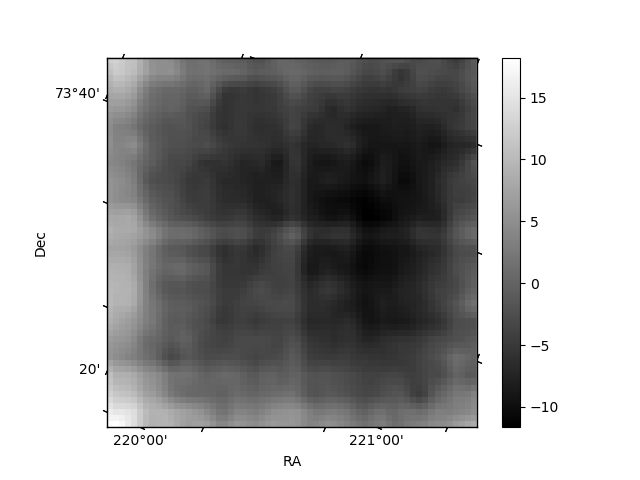
Quadrant B |
|---|---|---|---|
| Quadrant D | 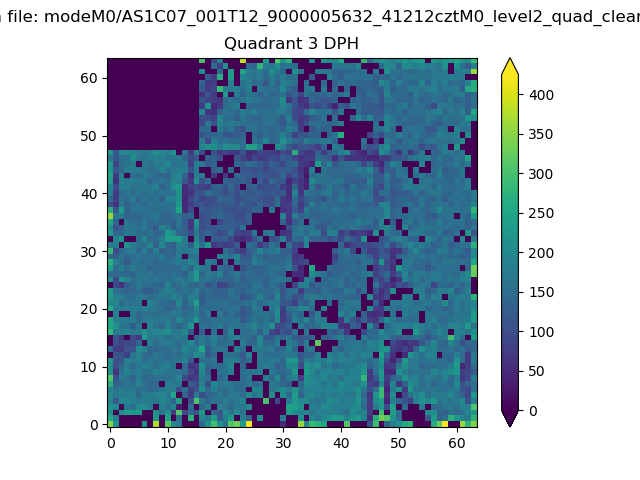 |
 |
Quadrant C |
| Plot type | Count rate plots | Images |
|---|---|---|
| Comparison with Poisson distribution Blue bars denote a histogram of data divided into 1 sec bins. Red curve is a Poisson curve with rate = median count rate of data. |
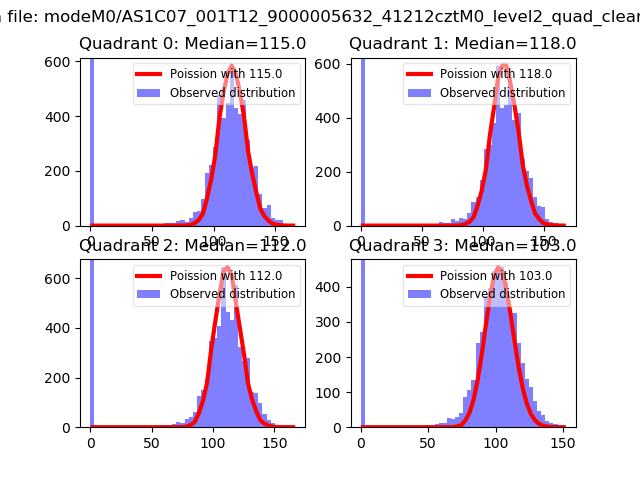 |
 |
| Quadrant-wise count rates Data is divided into 100 sec bins |
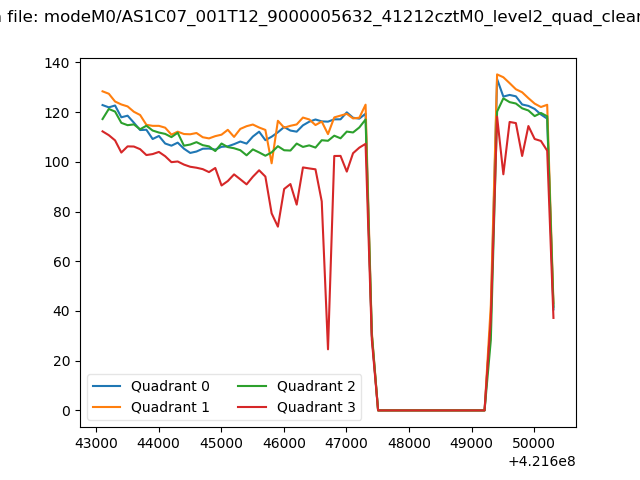 |
|
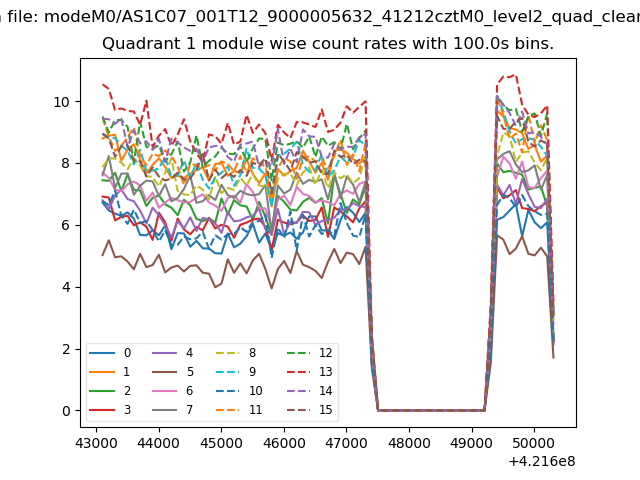
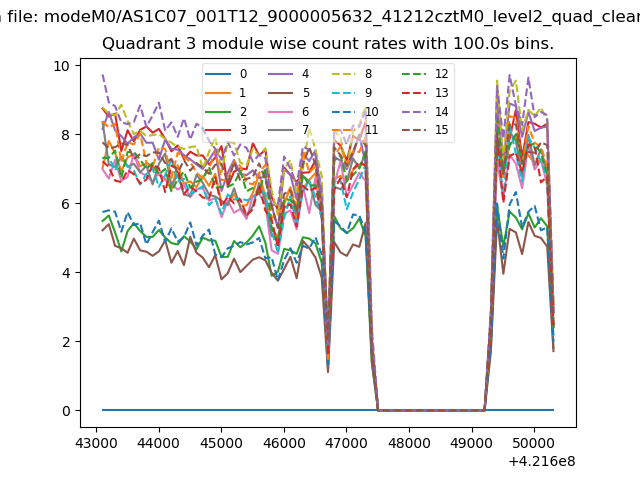
| Module-wise count rates for Quadrant A Data is divided into 100 sec bins |
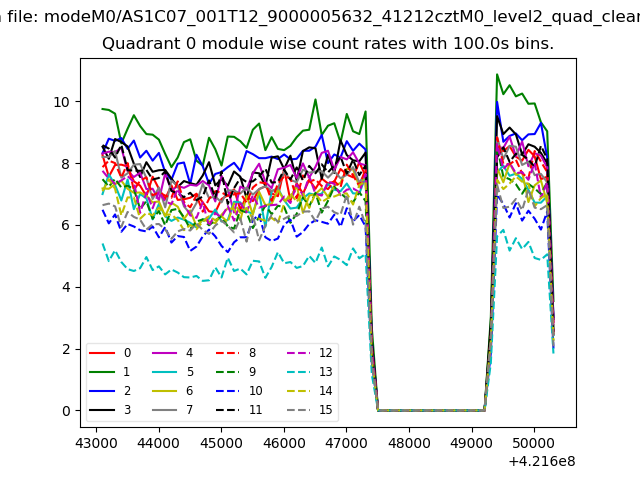 |
 |
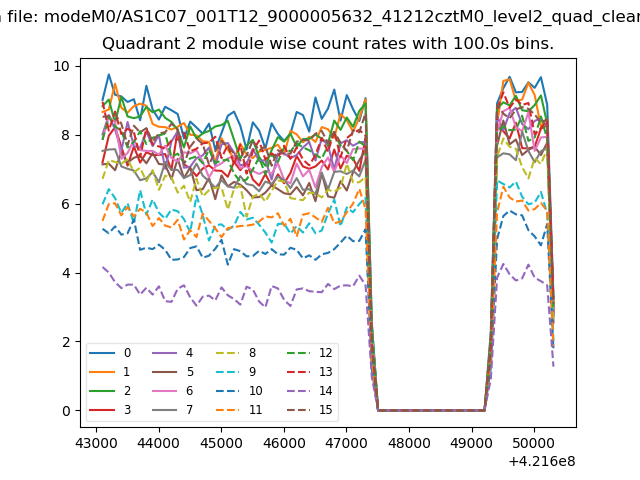
| Module-wise count rates for Quadrant B Data is divided into 100 sec bins |
 |
 |
| Module-wise count rates for Quadrant C Data is divided into 100 sec bins |
 |
 |
| Module-wise count rates for Quadrant D Data is divided into 100 sec bins |
 |
 |
| Parameter | Plot |
|---|---|
| CZT HV Monitor | 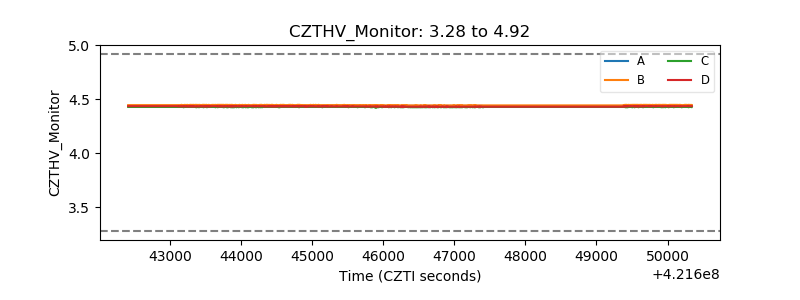 |
| D_VDD | 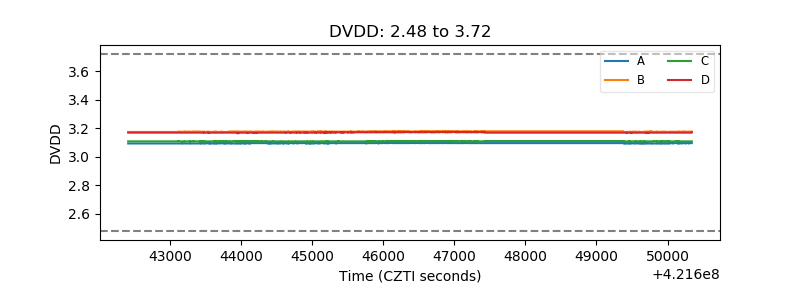 |
| Temperature 1 | 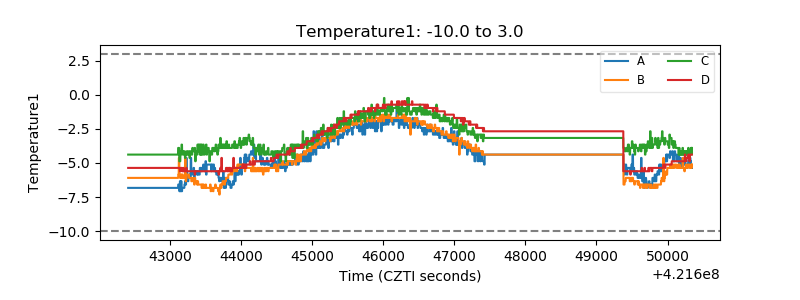 |
| Veto HV Monitor |  |
| Veto LLD | 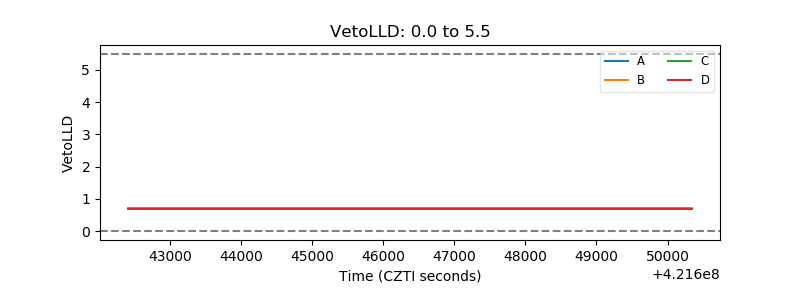 |
| Alpha Counter | 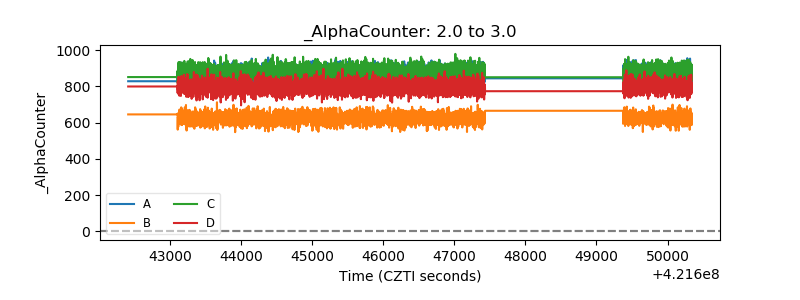 |
| _CPM_Rate | 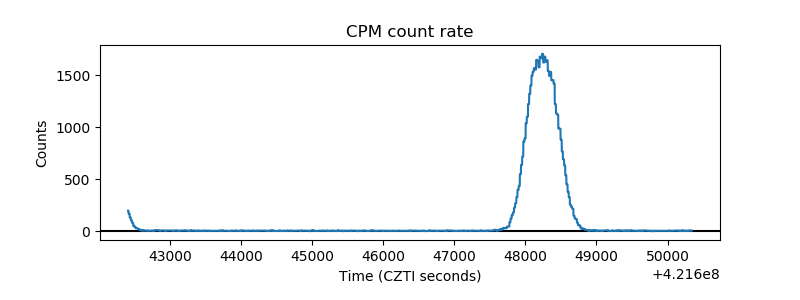 |
| CZT Counter | 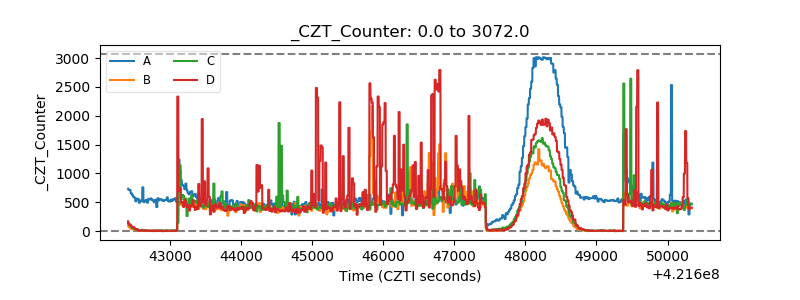 |
| +2.5 Volts monitor | 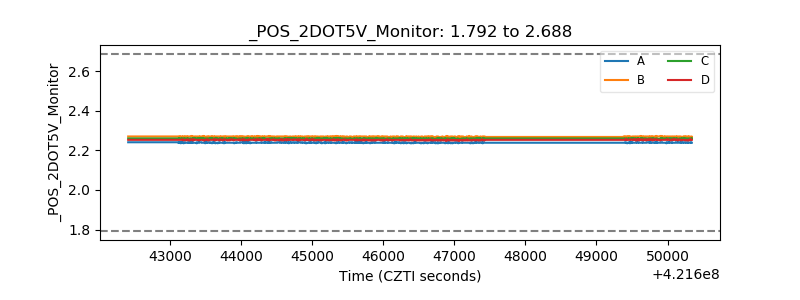 |
| +5 Volts monitor | 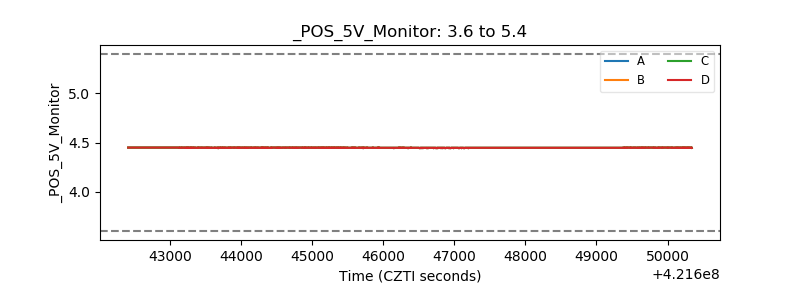 |
| _ROLL_ROT | 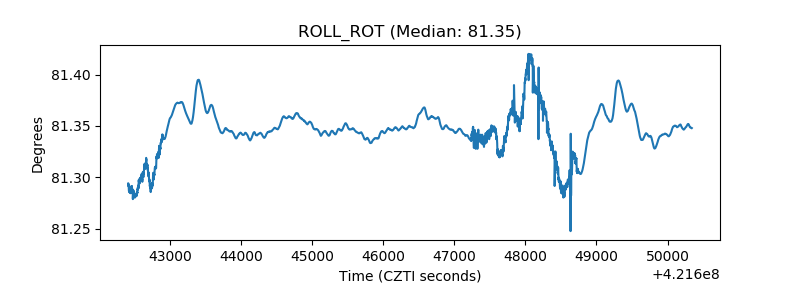 |
| _Roll_DEC | 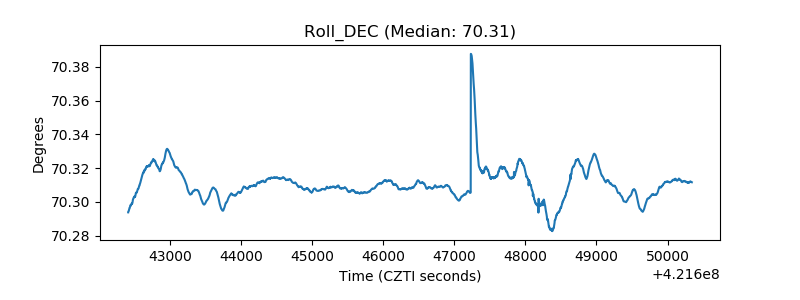 |
| _Roll_RA | 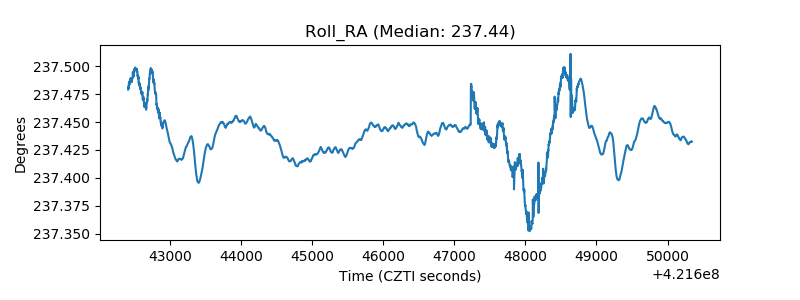 |
| Veto Counter | 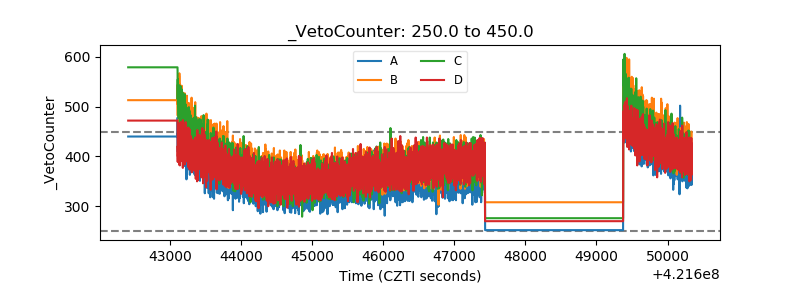 |