| Param | Original file | Final file |
|---|---|---|
| Filename | modeM0/AS1C07_001T12_9000005632_41213cztM0_level2.fits | modeM0/AS1C07_001T12_9000005632_41213cztM0_level2_quad_clean.evt |
| Size (bytes) | 334,296,000 | 83,122,560 |
| Size | 318.8 MB | 79.3 MB |
| Events in quadrant A | 2,572,045 | 571,787 |
| Events in quadrant B | 3,339,389 | 574,552 |
| Events in quadrant C | 2,908,883 | 539,619 |
| Events in quadrant D | 3,182,745 | 496,397 |
| Mode M0 | |||
|---|---|---|---|
| Quadrant | BADHDUFLAG | Total packets | Discarded packets |
| A | 0 | 10366 | 2 |
| B | 0 | 13240 | 1 |
| C | 0 | 11631 | 1 |
| D | 0 | 12775 | 1 |
| Mode M9 | |||
|---|---|---|---|
| Quadrant | BADHDUFLAG | Total packets | Discarded packets |
| A | 0 | 21 | 0 |
| B | 0 | 21 | 0 |
| C | 0 | 21 | 0 |
| D | 0 | 21 | 0 |
| Mode SS | |||
|---|---|---|---|
| Quadrant | BADHDUFLAG | Total packets | Discarded packets |
| A | 0 | 96 | 0 |
| B | 0 | 96 | 0 |
| C | 0 | 96 | 0 |
| D | 0 | 96 | 0 |
| Quadrant | Total seconds | Saturated seconds | Saturation percentage |
|---|---|---|---|
| A | 4771 | 7 | 0.146720% |
| B | 4771 | 201 | 4.212953% |
| C | 4771 | 126 | 2.640956% |
| D | 4771 | 183 | 3.835674% |
Noise dominated data is calculated using 1-second bins in cleaned event files. If a bin has >2000 counts, and if more than 50% of those come from <1% of pixels, then it is considered to be noise-dominated and hence unusable.
| Quadrant | # 1 sec bins | Bins with >0 counts | Bins with >2000 counts | High rate bins dominated by noise | Noise dominated (total time) | Noise dominated (detector-on time) | Marked lightcurve |
|---|---|---|---|---|---|---|---|
| A | 6804 | 4772 | 3 | 3 | 0.04% | 0.06% | 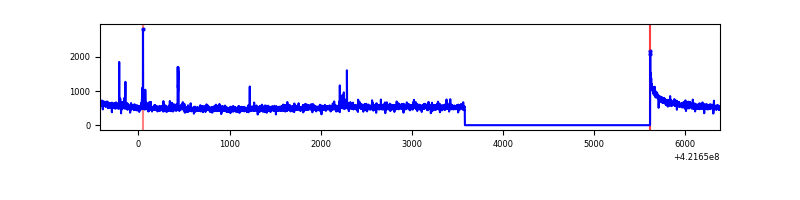 |
| B | 6804 | 4772 | 102 | 102 | 1.50% | 2.14% | 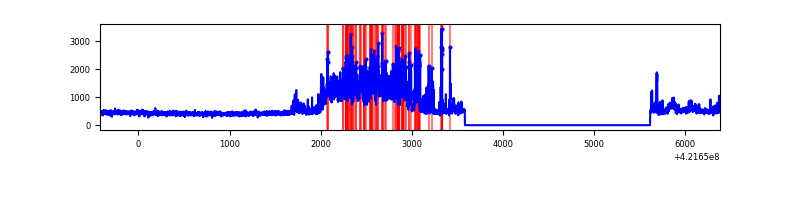 |
| C | 6804 | 4772 | 107 | 107 | 1.57% | 2.24% | 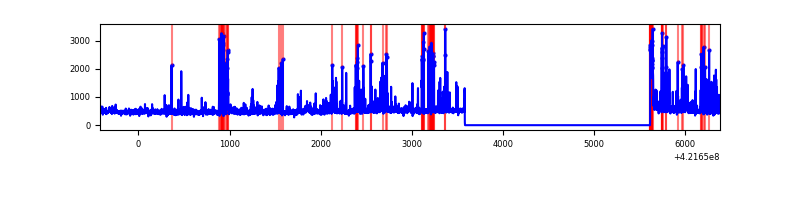 |
| D | 6804 | 4772 | 180 | 180 | 2.65% | 3.77% | 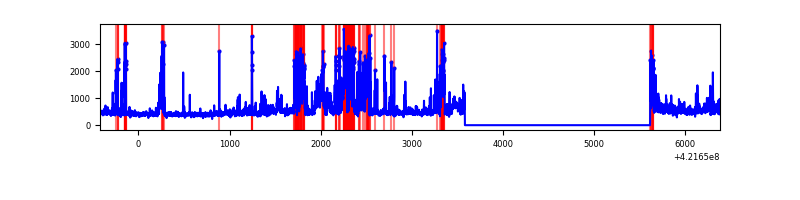 |
Top three noisy pixels from each quadrant. If the there are fewer than three noisy pixels in the level2.evt file, extra rows are filled as -1
| Pixel properties | Quadrant properties | ||||||
|---|---|---|---|---|---|---|---|
| Quadrant | DetID | PixID | Counts | Sigma | Mean | Median | Sigma |
| A | 10 | 83 | 434034 | 3989.14 | 534 | 524 | 108.7 |
| A | 0 | 8 | 32395 | 293.28 | 534 | 524 | 108.7 |
| A | 12 | 189 | 25091 | 226.06 | 534 | 524 | 108.7 |
| B | 0 | 186 | 670253 | 6654.27 | 523 | 509 | 100.6 |
| B | 0 | 190 | 350410 | 3476.46 | 523 | 509 | 100.6 |
| B | 0 | 229 | 155481 | 1539.73 | 523 | 509 | 100.6 |
| C | 14 | 254 | 657457 | 5695.91 | 503 | 505 | 115.3 |
| C | 15 | 214 | 203699 | 1761.73 | 503 | 505 | 115.3 |
| C | 0 | 10 | 77740 | 669.64 | 503 | 505 | 115.3 |
| D | 5 | 222 | 743993 | 6041.15 | 508 | 494 | 123.1 |
| D | 13 | 249 | 281786 | 2285.58 | 508 | 494 | 123.1 |
| D | 2 | 120 | 71482 | 576.8 | 508 | 494 | 123.1 |
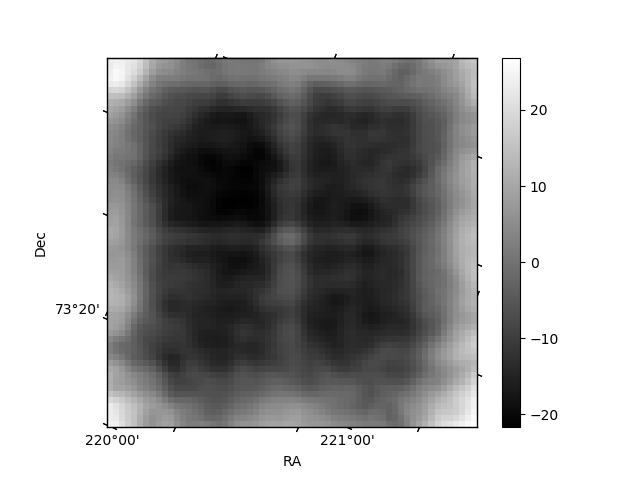
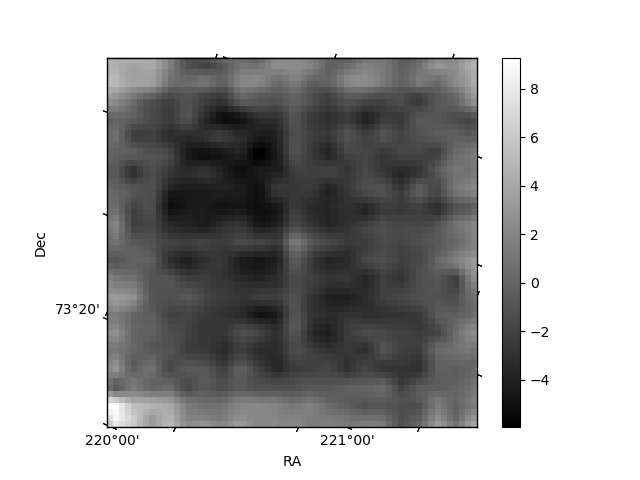
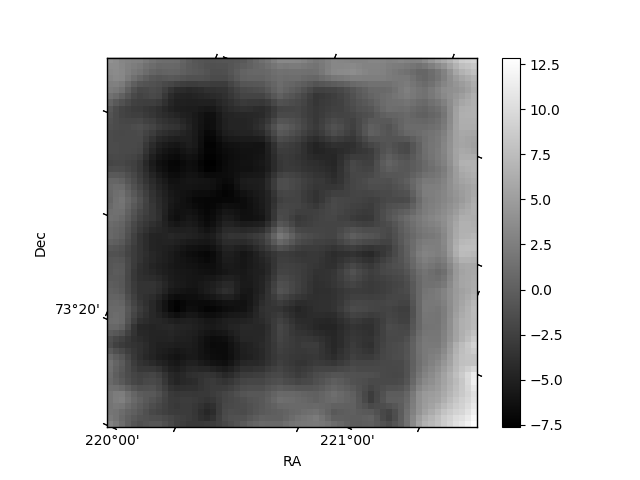
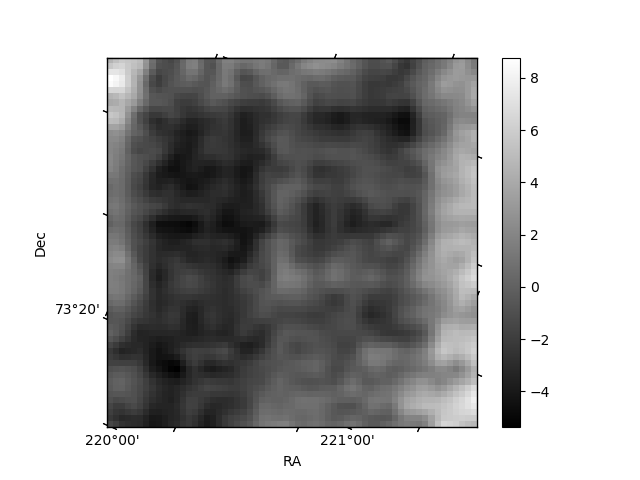
Histogram calculated using DETX and DETY for each event in the final _common_clean file
| Quadrant A | 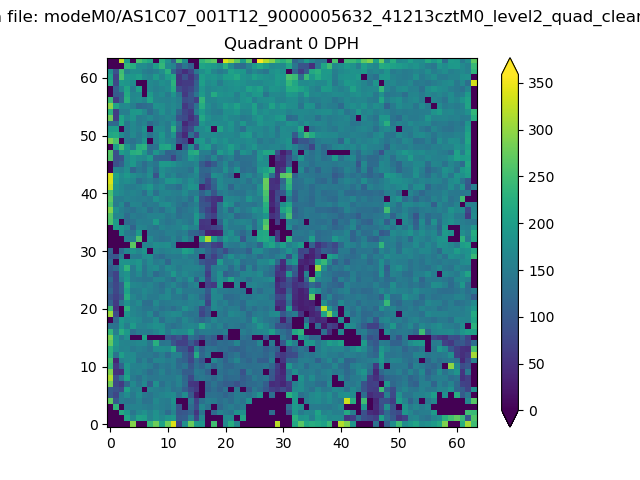 |
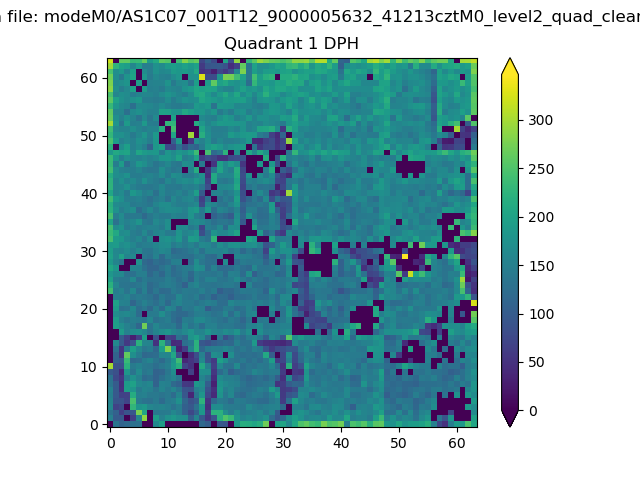 |
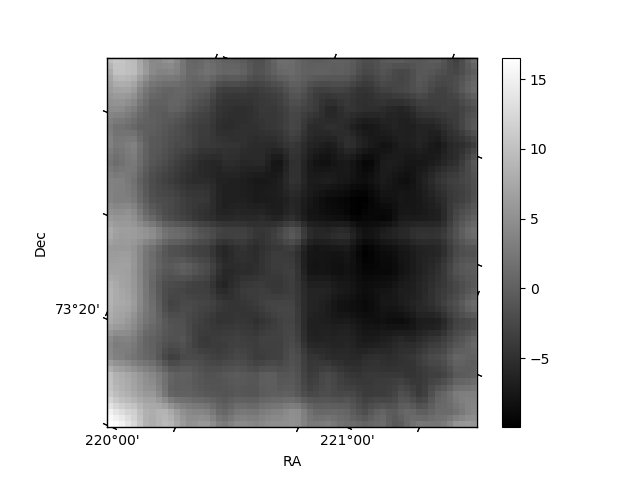
Quadrant B |
|---|---|---|---|
| Quadrant D | 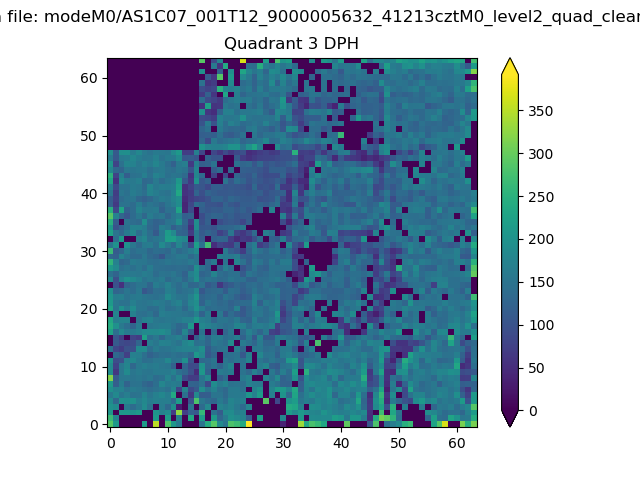 |
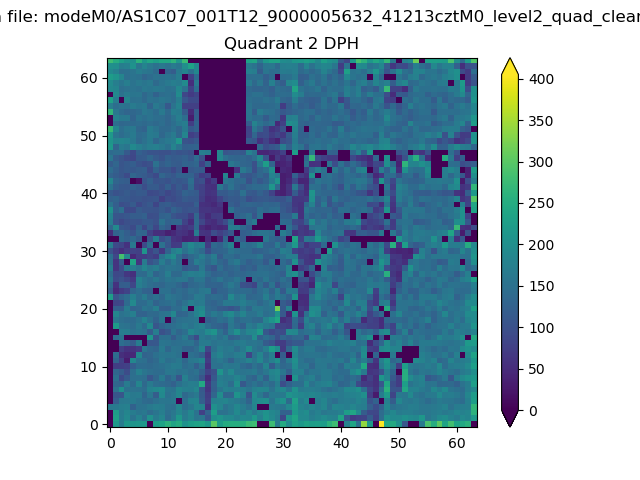 |
Quadrant C |
| Plot type | Count rate plots | Images |
|---|---|---|
| Comparison with Poisson distribution Blue bars denote a histogram of data divided into 1 sec bins. Red curve is a Poisson curve with rate = median count rate of data. |
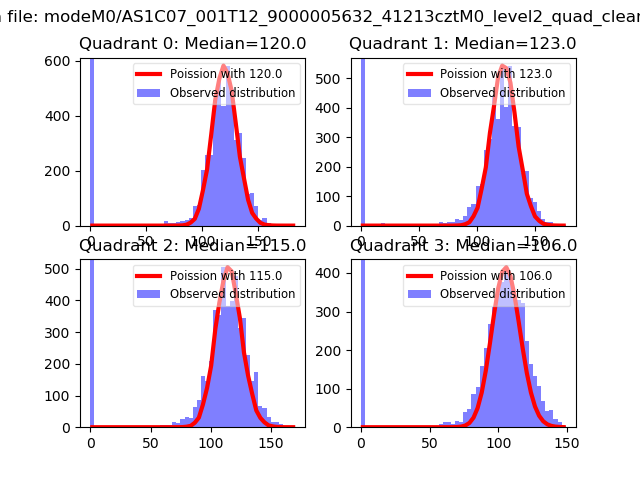 |
 |
| Quadrant-wise count rates Data is divided into 100 sec bins |
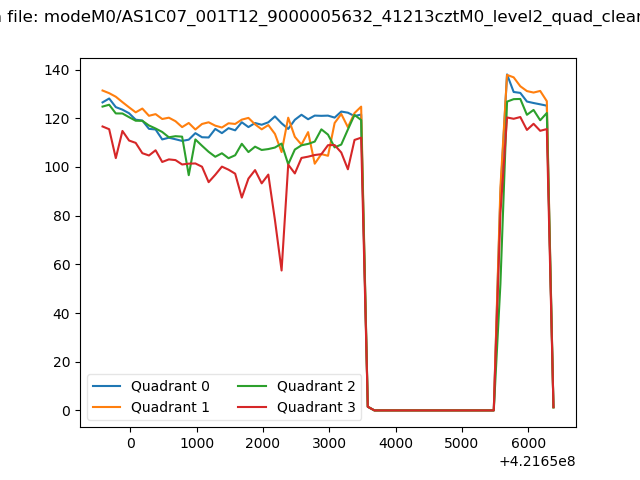 |
|
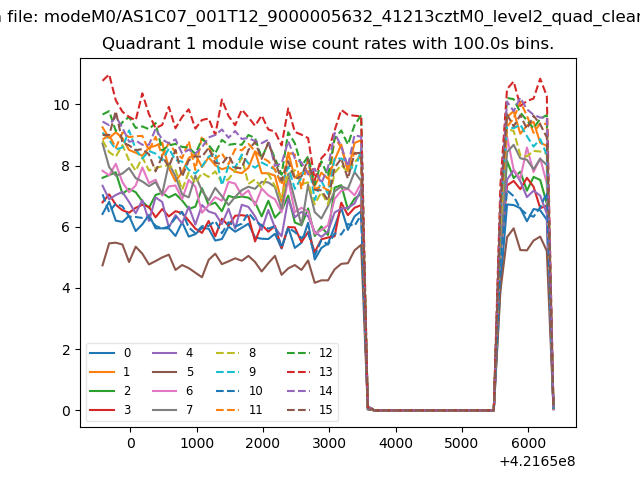
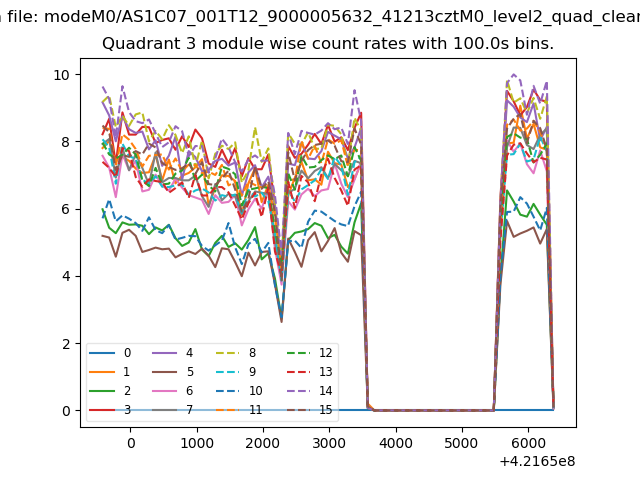
| Module-wise count rates for Quadrant A Data is divided into 100 sec bins |
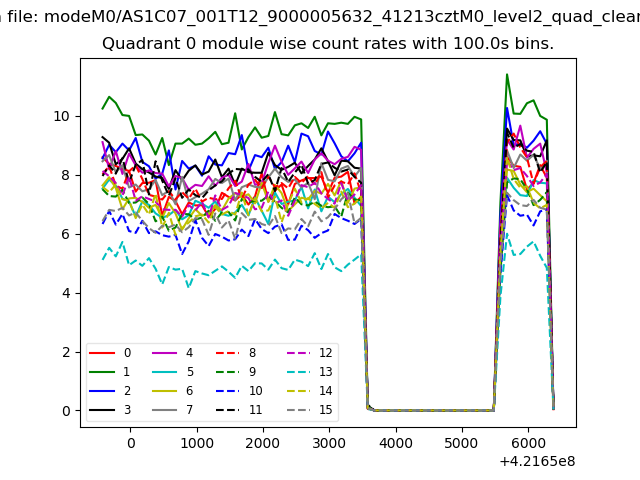 |
 |
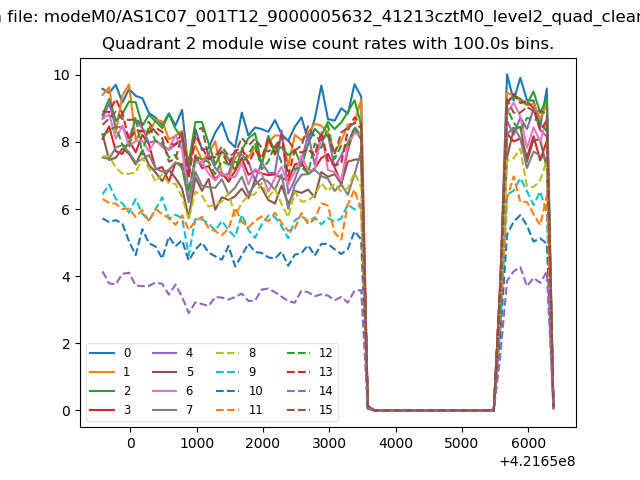
| Module-wise count rates for Quadrant B Data is divided into 100 sec bins |
 |
 |
| Module-wise count rates for Quadrant C Data is divided into 100 sec bins |
 |
 |
| Module-wise count rates for Quadrant D Data is divided into 100 sec bins |
 |
 |
| Parameter | Plot |
|---|---|
| CZT HV Monitor | 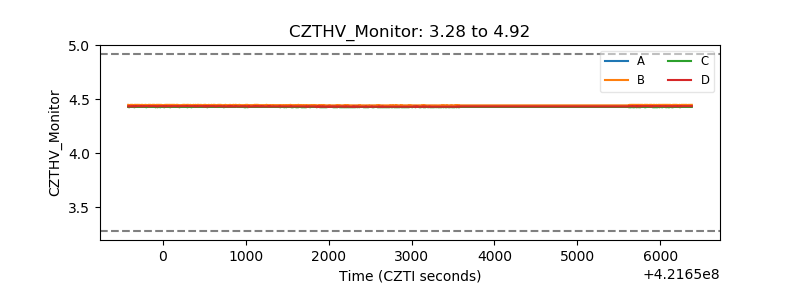 |
| D_VDD | 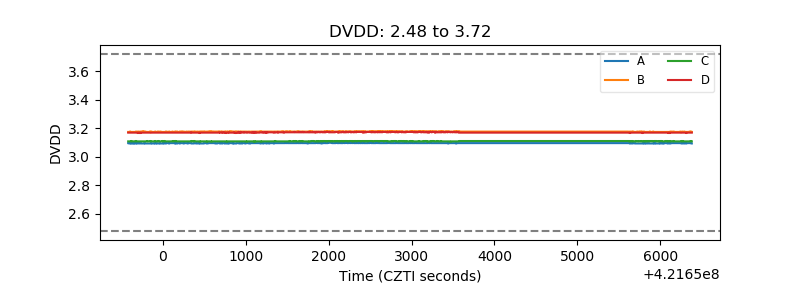 |
| Temperature 1 | 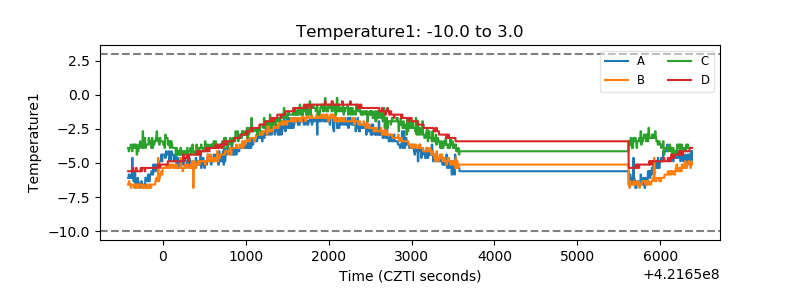 |
| Veto HV Monitor | 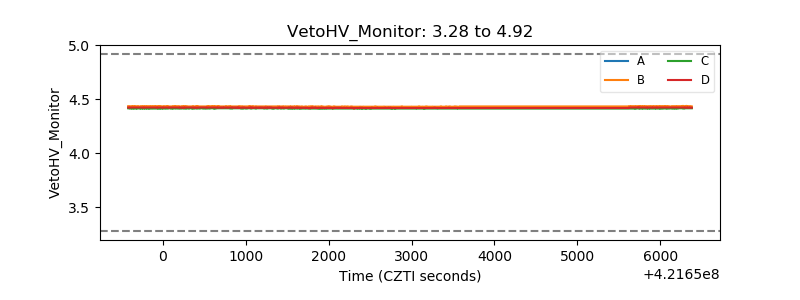 |
| Veto LLD | 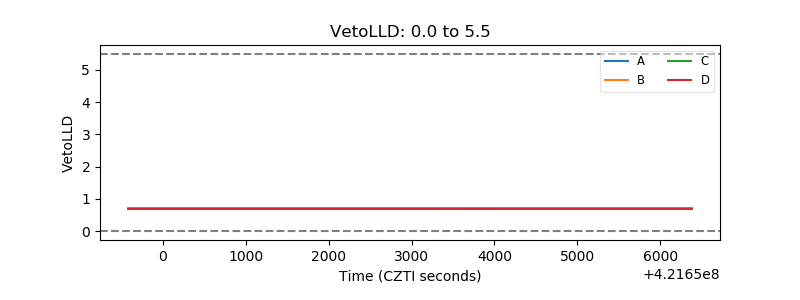 |
| Alpha Counter | 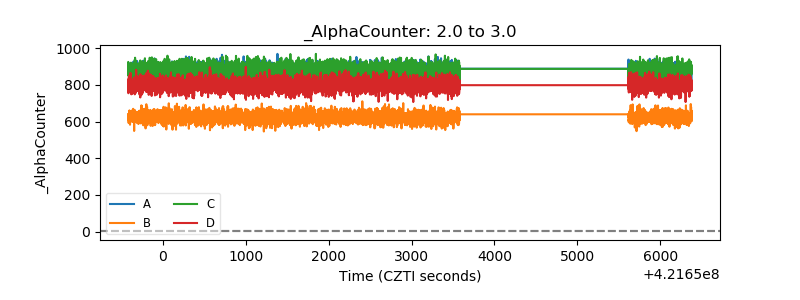 |
| _CPM_Rate | 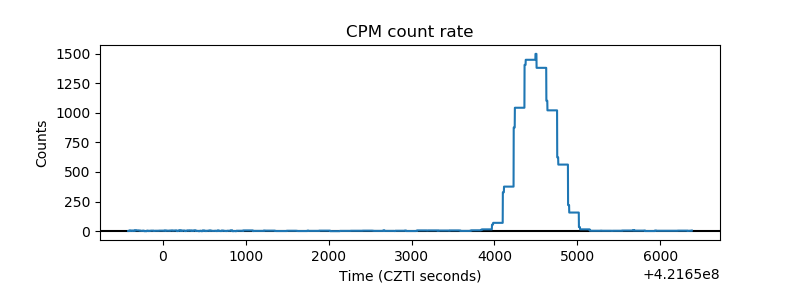 |
| CZT Counter | 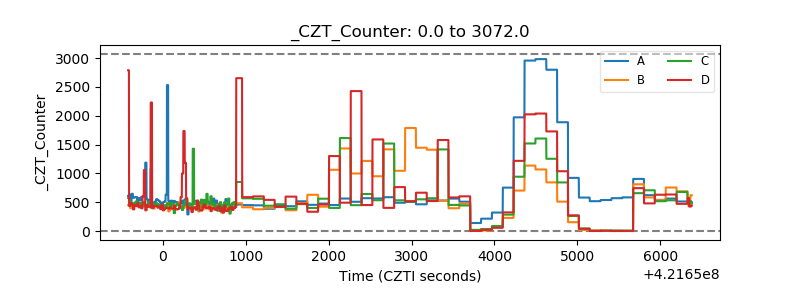 |
| +2.5 Volts monitor | 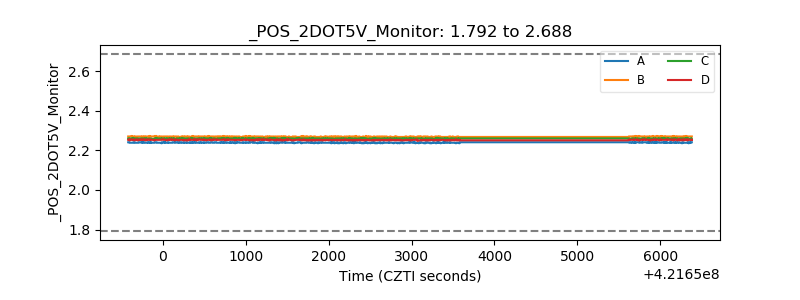 |
| +5 Volts monitor | 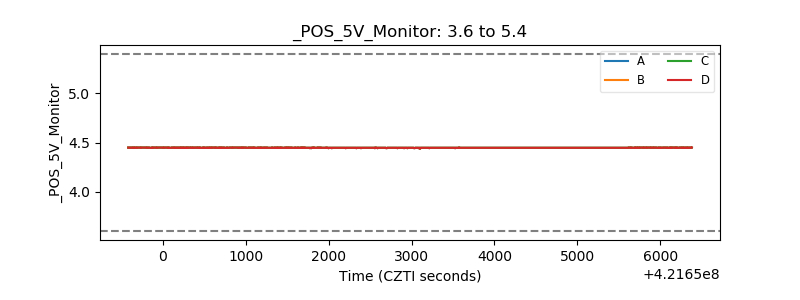 |
| _ROLL_ROT | 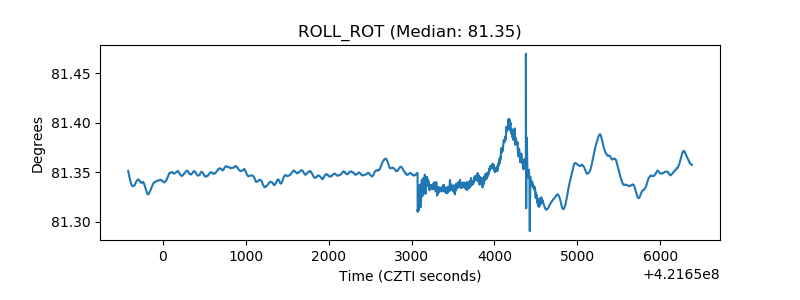 |
| _Roll_DEC | 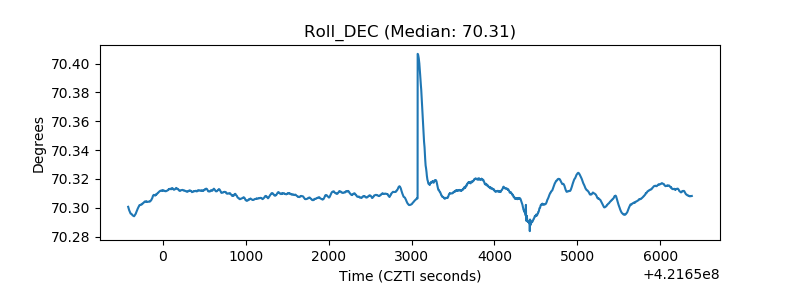 |
| _Roll_RA | 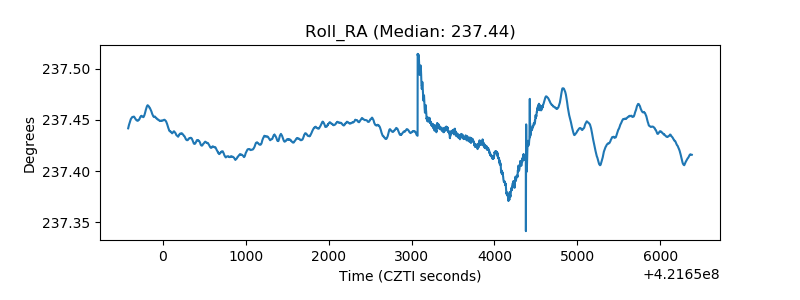 |
| Veto Counter | 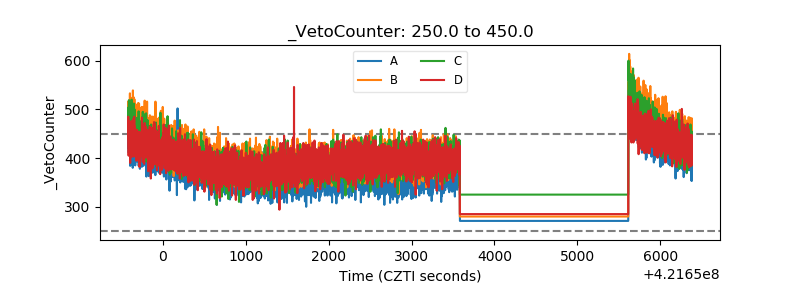 |