| Param | Original file | Final file |
|---|---|---|
| Filename | modeM0/AS1C07_001T12_9000005632_41214cztM0_level2.fits | modeM0/AS1C07_001T12_9000005632_41214cztM0_level2_quad_clean.evt |
| Size (bytes) | 349,367,040 | 87,675,840 |
| Size | 333.2 MB | 83.6 MB |
| Events in quadrant A | 2,739,707 | 605,783 |
| Events in quadrant B | 3,106,468 | 609,318 |
| Events in quadrant C | 3,537,622 | 558,521 |
| Events in quadrant D | 3,162,495 | 533,500 |
| Mode M0 | |||
|---|---|---|---|
| Quadrant | BADHDUFLAG | Total packets | Discarded packets |
| A | 0 | 10992 | 3 |
| B | 0 | 12474 | 2 |
| C | 0 | 13767 | 2 |
| D | 0 | 12757 | 2 |
| Mode M9 | |||
|---|---|---|---|
| Quadrant | BADHDUFLAG | Total packets | Discarded packets |
| A | 0 | 24 | 0 |
| B | 0 | 24 | 0 |
| C | 0 | 24 | 0 |
| D | 0 | 25 | 0 |
| Mode SS | |||
|---|---|---|---|
| Quadrant | BADHDUFLAG | Total packets | Discarded packets |
| A | 0 | 100 | 0 |
| B | 0 | 100 | 0 |
| C | 0 | 100 | 0 |
| D | 0 | 100 | 0 |
| Quadrant | Total seconds | Saturated seconds | Saturation percentage |
|---|---|---|---|
| A | 4962 | 13 | 0.261991% |
| B | 4962 | 120 | 2.418380% |
| C | 4962 | 212 | 4.272471% |
| D | 4962 | 73 | 1.471181% |
Noise dominated data is calculated using 1-second bins in cleaned event files. If a bin has >2000 counts, and if more than 50% of those come from <1% of pixels, then it is considered to be noise-dominated and hence unusable.
| Quadrant | # 1 sec bins | Bins with >0 counts | Bins with >2000 counts | High rate bins dominated by noise | Noise dominated (total time) | Noise dominated (detector-on time) | Marked lightcurve |
|---|---|---|---|---|---|---|---|
| A | 7085 | 4963 | 3 | 3 | 0.04% | 0.06% | 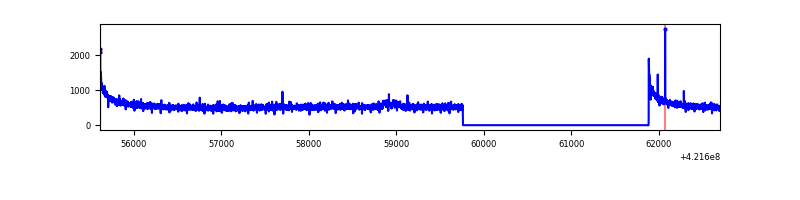 |
| B | 7085 | 4963 | 96 | 96 | 1.35% | 1.93% | 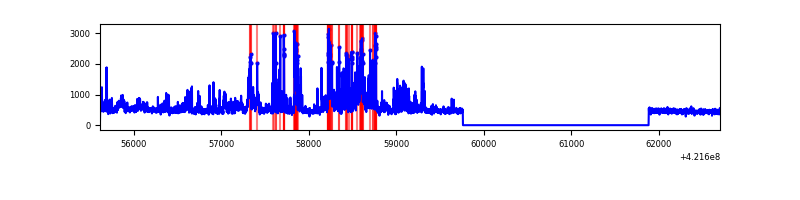 |
| C | 7085 | 4963 | 189 | 189 | 2.67% | 3.81% | 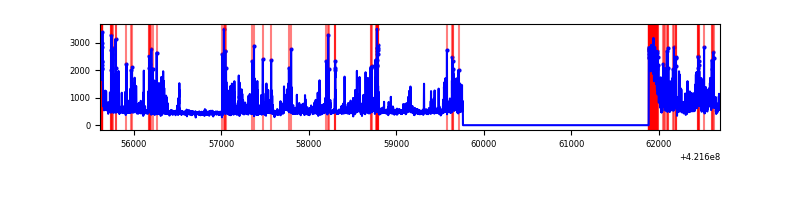 |
| D | 7085 | 4963 | 69 | 69 | 0.97% | 1.39% | 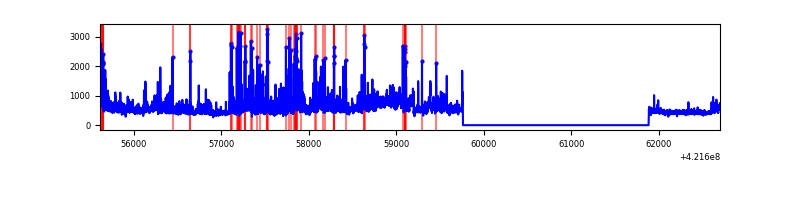 |
Top three noisy pixels from each quadrant. If the there are fewer than three noisy pixels in the level2.evt file, extra rows are filled as -1
| Pixel properties | Quadrant properties | ||||||
|---|---|---|---|---|---|---|---|
| Quadrant | DetID | PixID | Counts | Sigma | Mean | Median | Sigma |
| A | 10 | 83 | 513656 | 4473.95 | 563 | 554 | 114.7 |
| A | 12 | 189 | 34118 | 292.66 | 563 | 554 | 114.7 |
| A | 13 | 254 | 8882 | 72.62 | 563 | 554 | 114.7 |
| B | 0 | 186 | 497710 | 4729.23 | 550 | 536 | 105.1 |
| B | 0 | 229 | 277878 | 2638.14 | 550 | 536 | 105.1 |
| B | 0 | 190 | 69189 | 653.04 | 550 | 536 | 105.1 |
| C | 14 | 254 | 960031 | 7927.69 | 525 | 528 | 121.0 |
| C | 0 | 10 | 295117 | 2433.98 | 525 | 528 | 121.0 |
| C | 15 | 214 | 212981 | 1755.35 | 525 | 528 | 121.0 |
| D | 5 | 222 | 574477 | 4374.63 | 539 | 524 | 131.2 |
| D | 12 | 16 | 198627 | 1509.93 | 539 | 524 | 131.2 |
| D | 12 | 79 | 142532 | 1082.37 | 539 | 524 | 131.2 |
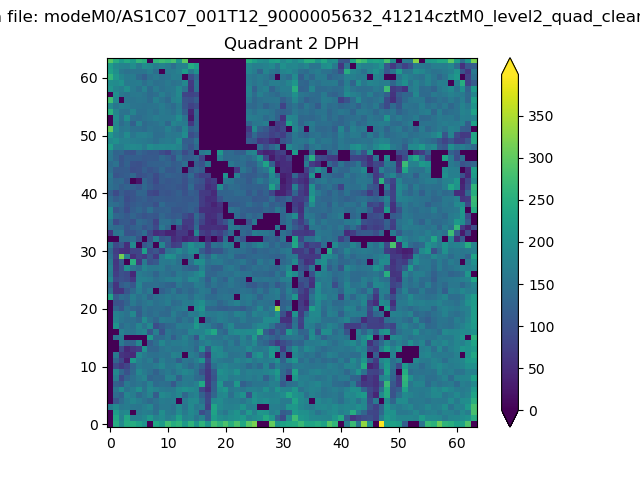
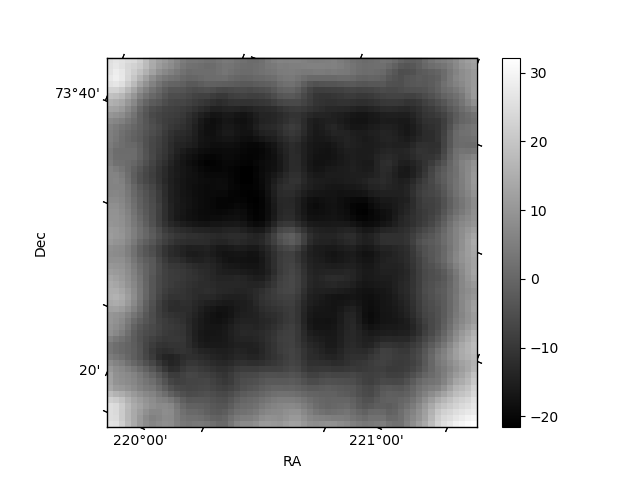
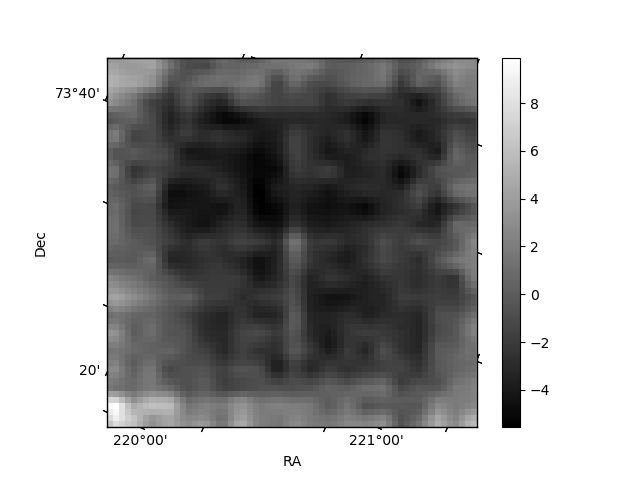
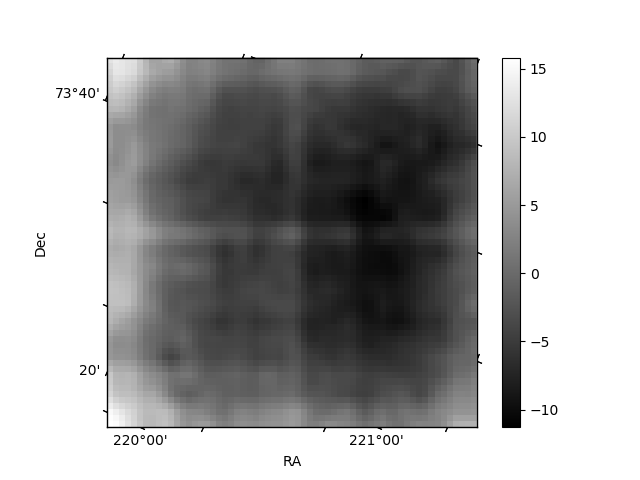
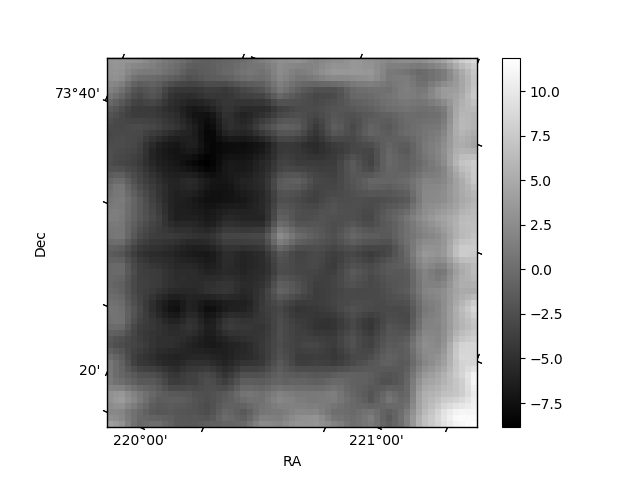
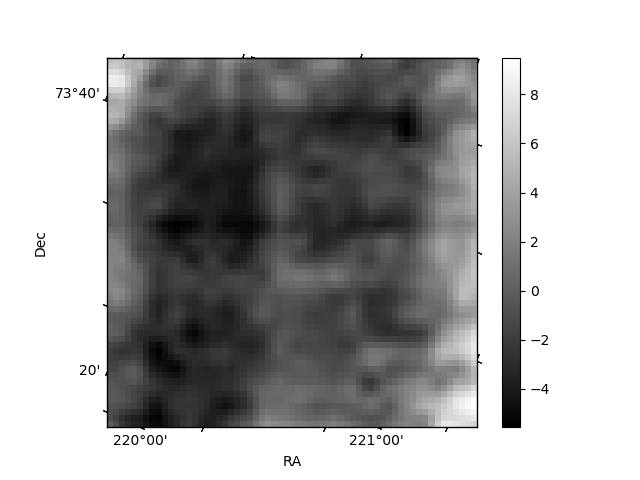
Histogram calculated using DETX and DETY for each event in the final _common_clean file
| Quadrant A | 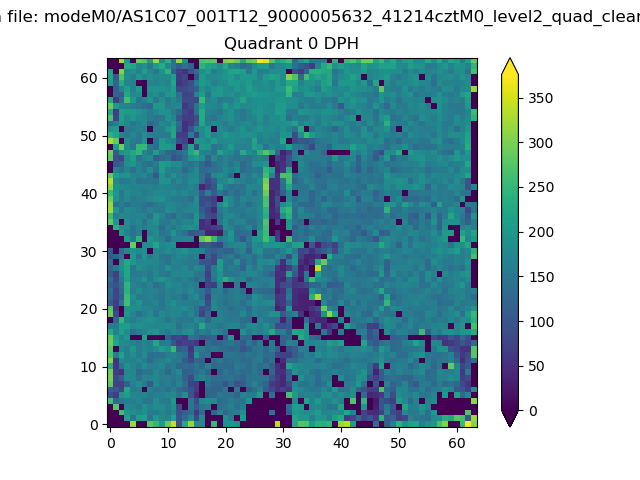 |
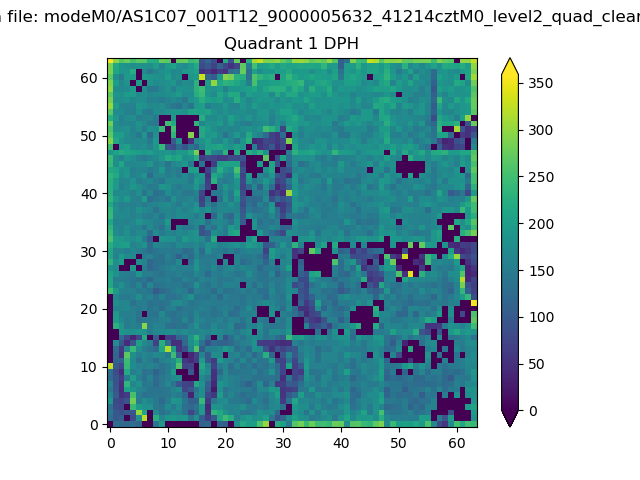 |
Quadrant B |
|---|---|---|---|
| Quadrant D | 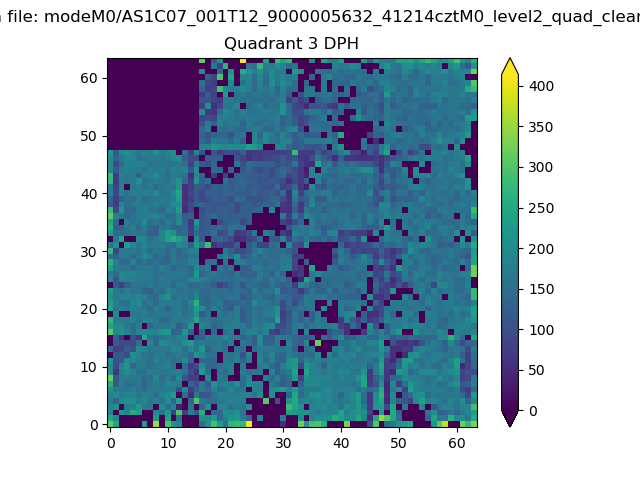 |
 |
Quadrant C |
| Plot type | Count rate plots | Images |
|---|---|---|
| Comparison with Poisson distribution Blue bars denote a histogram of data divided into 1 sec bins. Red curve is a Poisson curve with rate = median count rate of data. |
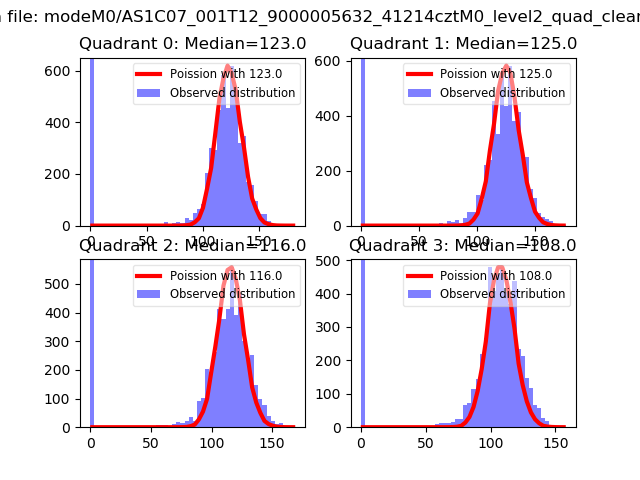 |
 |
| Quadrant-wise count rates Data is divided into 100 sec bins |
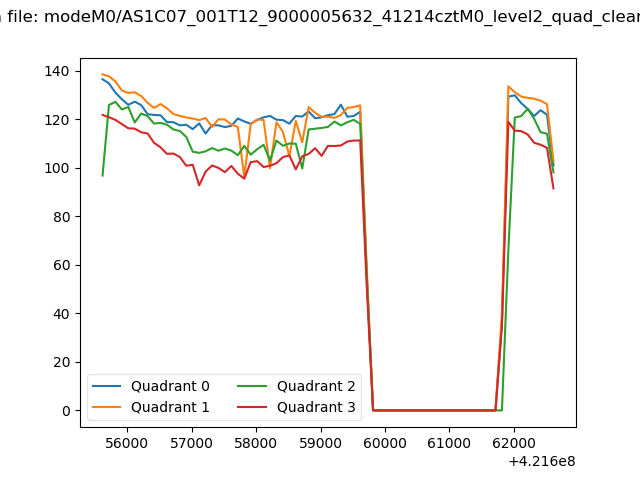 |
|
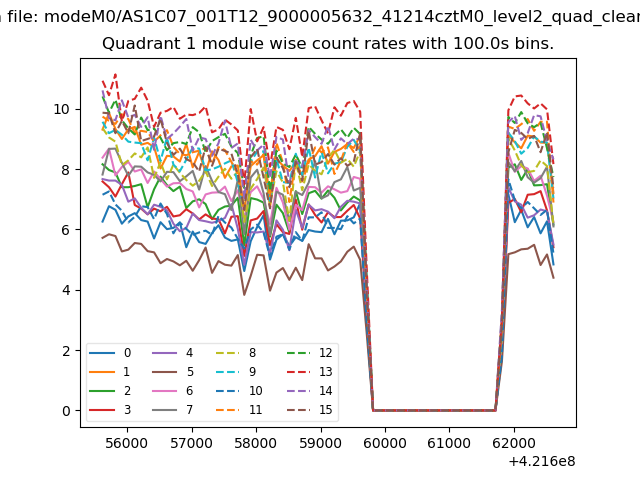
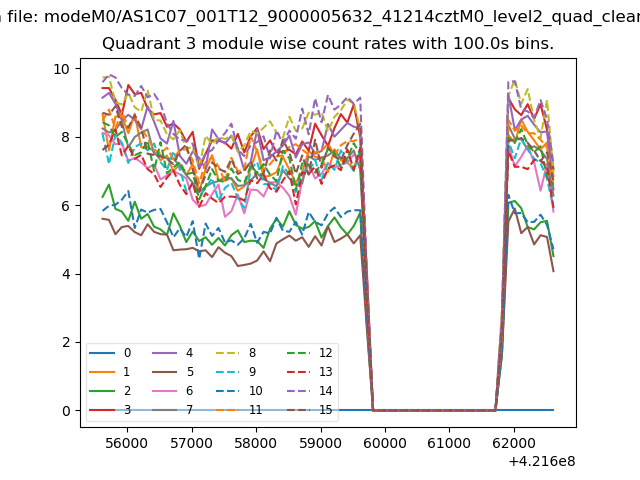
| Module-wise count rates for Quadrant A Data is divided into 100 sec bins |
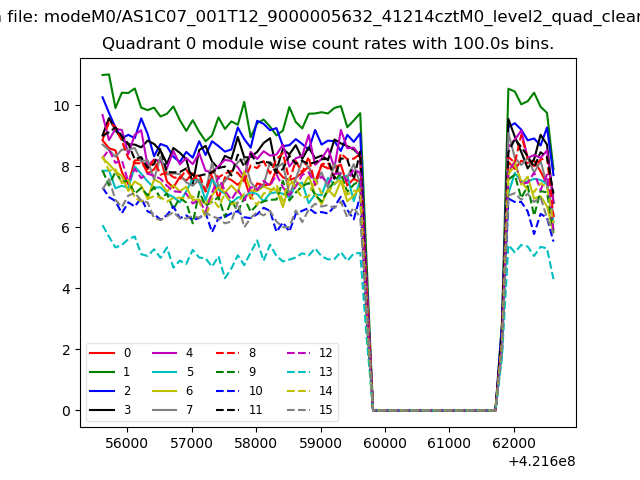 |
 |
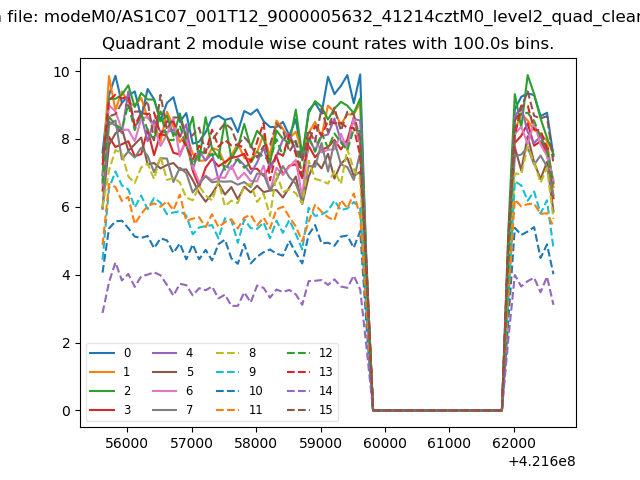
| Module-wise count rates for Quadrant B Data is divided into 100 sec bins |
 |
 |
| Module-wise count rates for Quadrant C Data is divided into 100 sec bins |
 |
 |
| Module-wise count rates for Quadrant D Data is divided into 100 sec bins |
 |
 |
| Parameter | Plot |
|---|---|
| CZT HV Monitor | 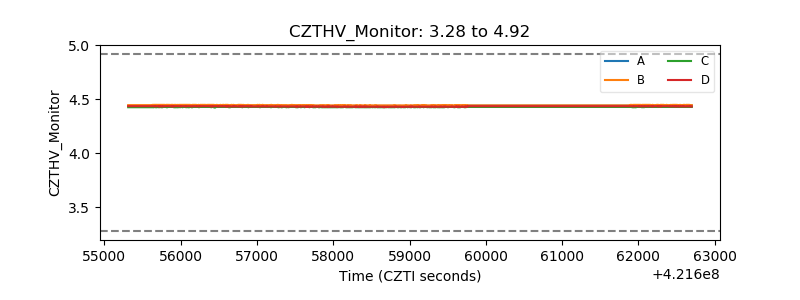 |
| D_VDD | 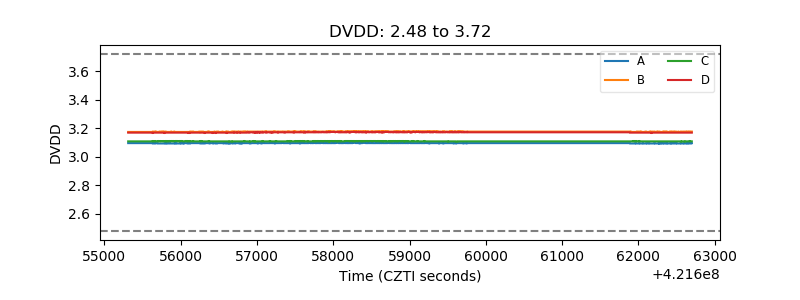 |
| Temperature 1 | 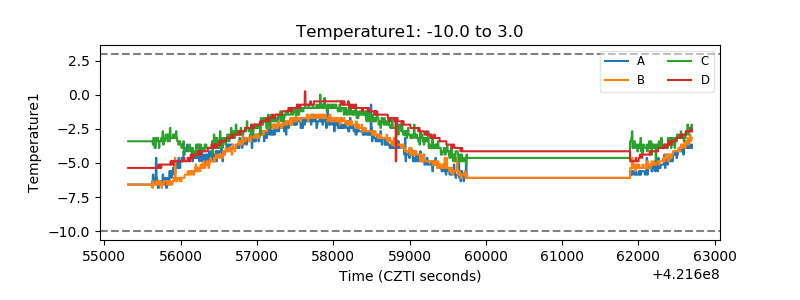 |
| Veto HV Monitor | 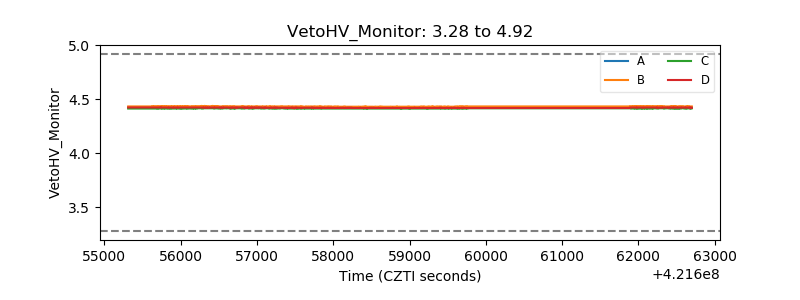 |
| Veto LLD | 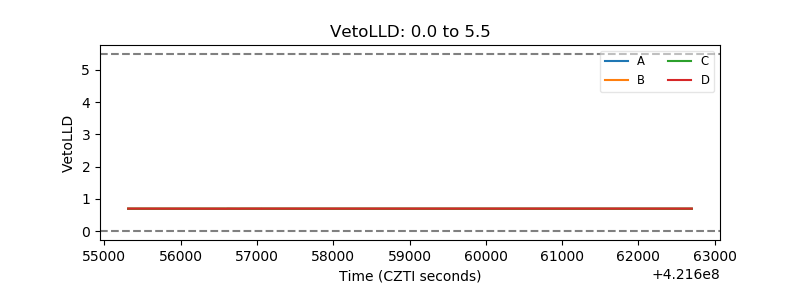 |
| Alpha Counter | 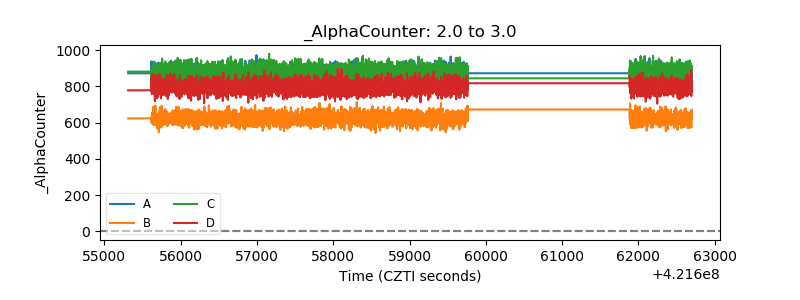 |
| _CPM_Rate | 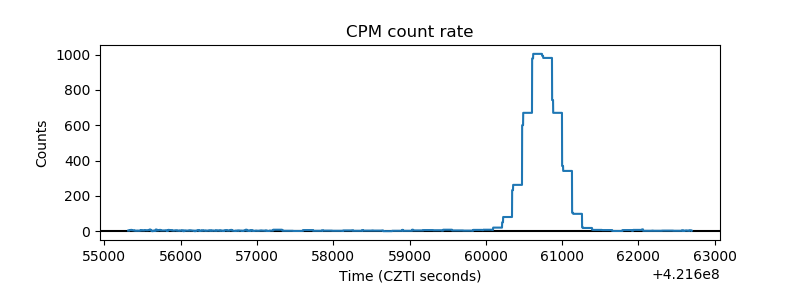 |
| CZT Counter | 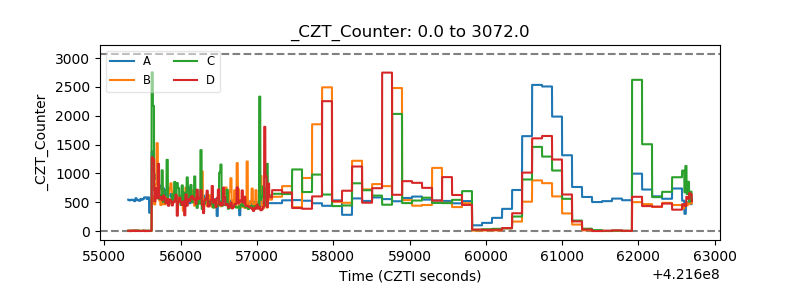 |
| +2.5 Volts monitor |  |
| +5 Volts monitor | 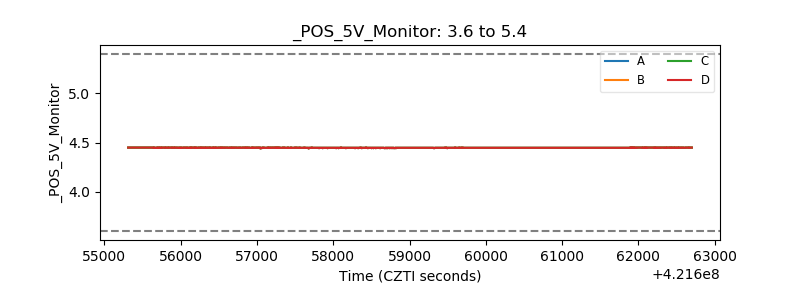 |
| _ROLL_ROT | 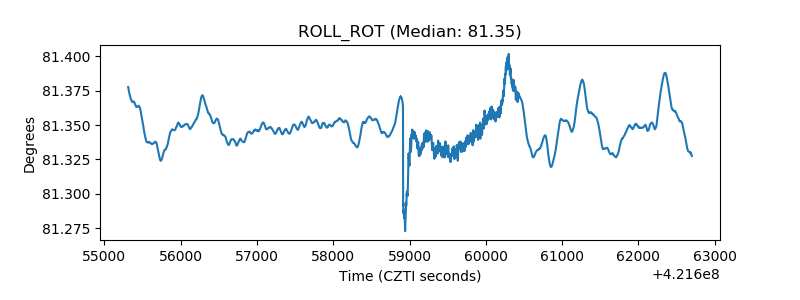 |
| _Roll_DEC | 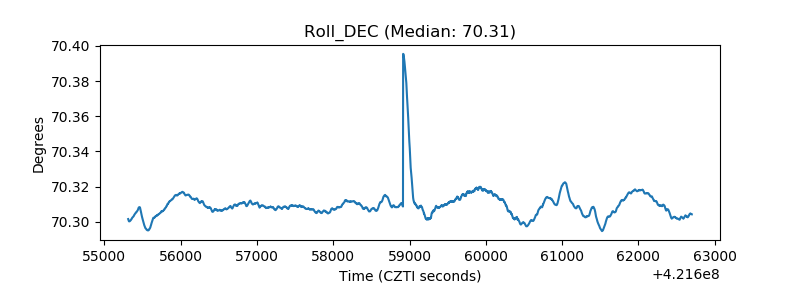 |
| _Roll_RA | 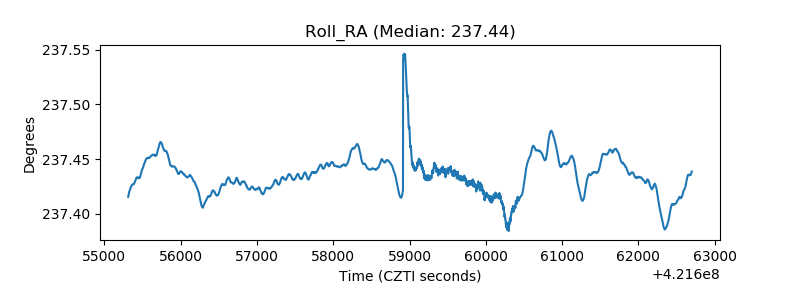 |
| Veto Counter | 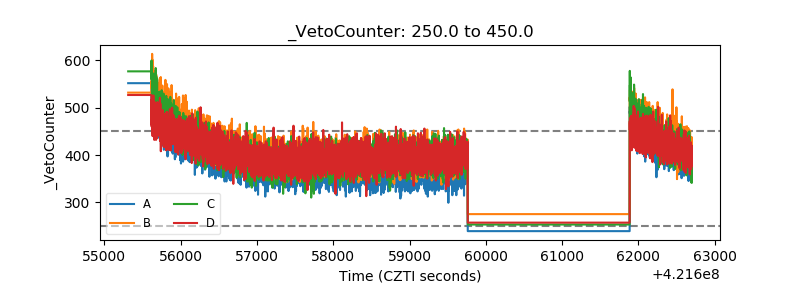 |