| Param | Original file | Final file |
|---|---|---|
| Filename | modeM0/AS1C07_001T12_9000005632_41215cztM0_level2.fits | modeM0/AS1C07_001T12_9000005632_41215cztM0_level2_quad_clean.evt |
| Size (bytes) | 319,645,440 | 84,620,160 |
| Size | 304.8 MB | 80.7 MB |
| Events in quadrant A | 2,650,177 | 582,671 |
| Events in quadrant B | 2,747,408 | 593,028 |
| Events in quadrant C | 3,565,638 | 528,519 |
| Events in quadrant D | 2,487,501 | 514,719 |
| Mode M0 | |||
|---|---|---|---|
| Quadrant | BADHDUFLAG | Total packets | Discarded packets |
| A | 0 | 10677 | 3 |
| B | 0 | 11438 | 2 |
| C | 0 | 13737 | 2 |
| D | 0 | 10777 | 2 |
| Mode M9 | |||
|---|---|---|---|
| Quadrant | BADHDUFLAG | Total packets | Discarded packets |
| A | 0 | 28 | 0 |
| B | 0 | 28 | 0 |
| C | 0 | 28 | 0 |
| D | 0 | 29 | 0 |
| Mode SS | |||
|---|---|---|---|
| Quadrant | BADHDUFLAG | Total packets | Discarded packets |
| A | 0 | 100 | 0 |
| B | 0 | 100 | 0 |
| C | 0 | 100 | 0 |
| D | 0 | 100 | 0 |
| Quadrant | Total seconds | Saturated seconds | Saturation percentage |
|---|---|---|---|
| A | 4897 | 15 | 0.306310% |
| B | 4897 | 23 | 0.469675% |
| C | 4897 | 297 | 6.064938% |
| D | 4897 | 34 | 0.694303% |
Noise dominated data is calculated using 1-second bins in cleaned event files. If a bin has >2000 counts, and if more than 50% of those come from <1% of pixels, then it is considered to be noise-dominated and hence unusable.
| Quadrant | # 1 sec bins | Bins with >0 counts | Bins with >2000 counts | High rate bins dominated by noise | Noise dominated (total time) | Noise dominated (detector-on time) | Marked lightcurve |
|---|---|---|---|---|---|---|---|
| A | 7020 | 4898 | 1 | 1 | 0.01% | 0.02% | 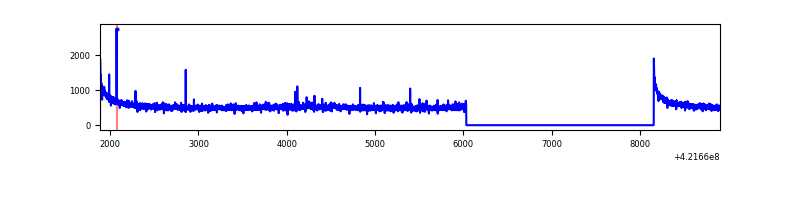 |
| B | 7020 | 4898 | 9 | 9 | 0.13% | 0.18% | 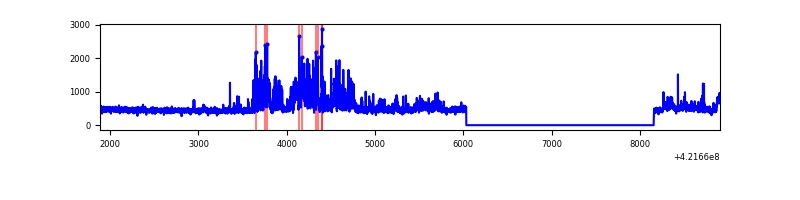 |
| C | 7020 | 4898 | 297 | 297 | 4.23% | 6.06% | 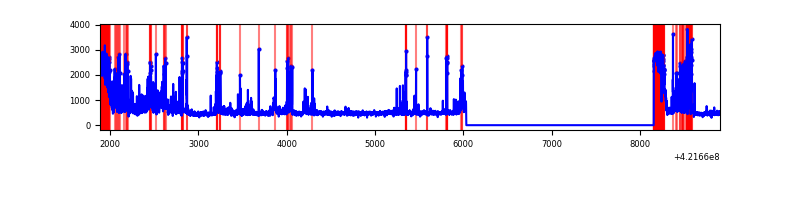 |
| D | 7020 | 4898 | 26 | 26 | 0.37% | 0.53% | 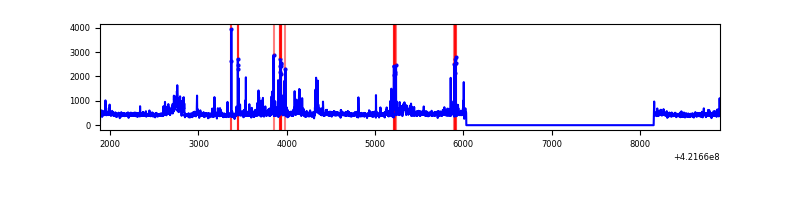 |
Top three noisy pixels from each quadrant. If the there are fewer than three noisy pixels in the level2.evt file, extra rows are filled as -1
| Pixel properties | Quadrant properties | ||||||
|---|---|---|---|---|---|---|---|
| Quadrant | DetID | PixID | Counts | Sigma | Mean | Median | Sigma |
| A | 10 | 83 | 500023 | 4565.98 | 546 | 536 | 109.4 |
| A | 12 | 189 | 24035 | 214.81 | 546 | 536 | 109.4 |
| A | 13 | 254 | 9206 | 79.26 | 546 | 536 | 109.4 |
| B | 0 | 190 | 257674 | 2520.48 | 538 | 524 | 102.0 |
| B | 0 | 186 | 192777 | 1884.39 | 538 | 524 | 102.0 |
| B | 0 | 245 | 106332 | 1037.09 | 538 | 524 | 102.0 |
| C | 14 | 254 | 831345 | 7123.49 | 508 | 510 | 116.6 |
| C | 0 | 10 | 507136 | 4343.75 | 508 | 510 | 116.6 |
| C | 15 | 214 | 207679 | 1776.24 | 508 | 510 | 116.6 |
| D | 13 | 249 | 165652 | 1306.55 | 527 | 513 | 126.4 |
| D | 5 | 222 | 149617 | 1179.68 | 527 | 513 | 126.4 |
| D | 12 | 79 | 29035 | 225.66 | 527 | 513 | 126.4 |
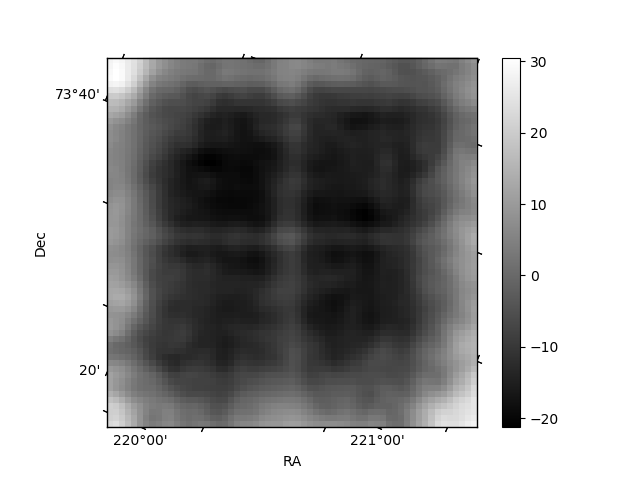
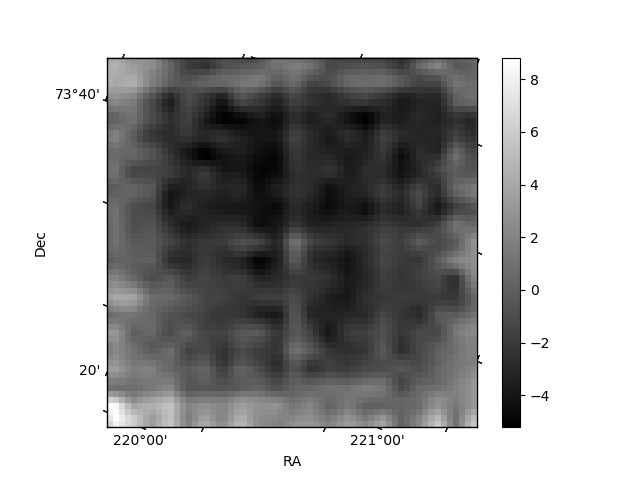
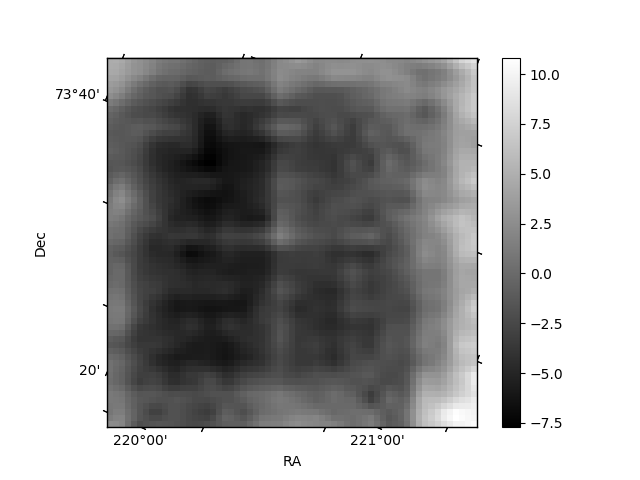
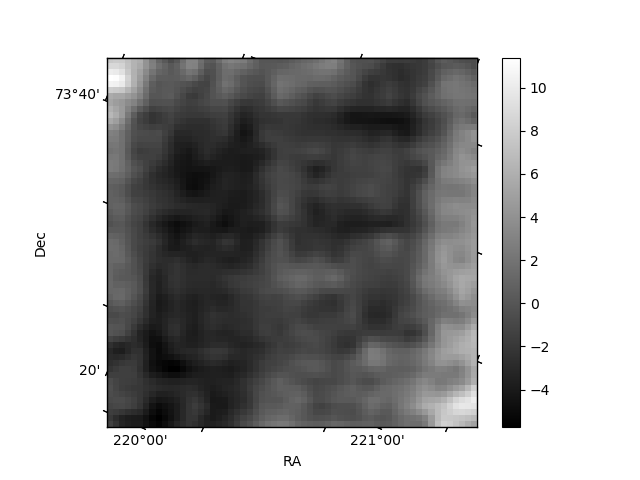
Histogram calculated using DETX and DETY for each event in the final _common_clean file
| Quadrant A | 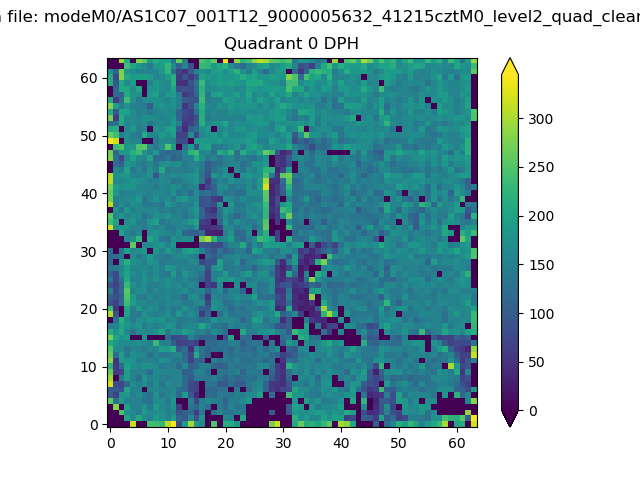 |
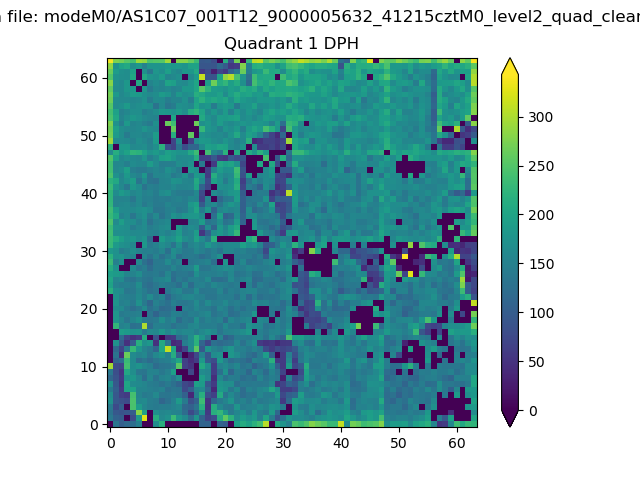 |
Quadrant B |
|---|---|---|---|
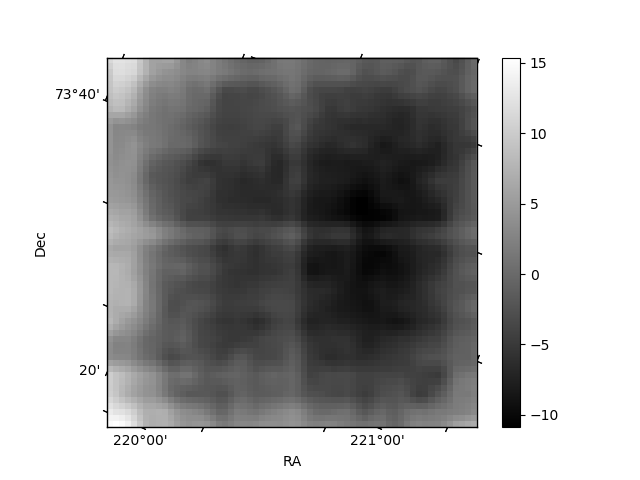
| Quadrant D | 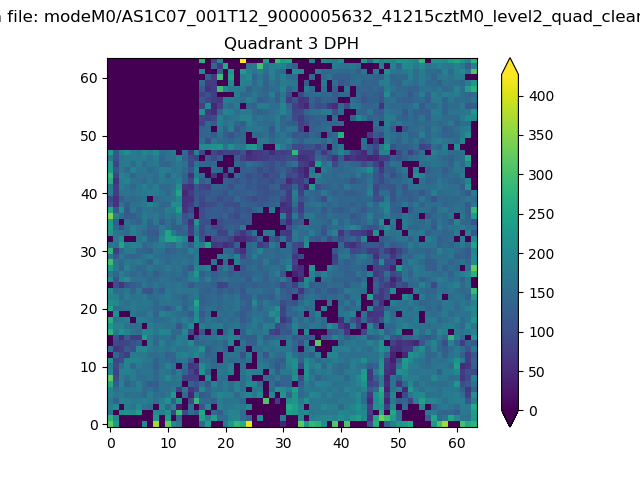 |
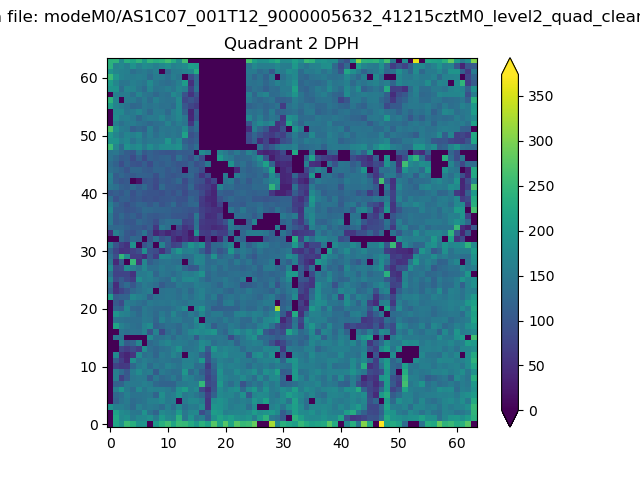 |
Quadrant C |
| Plot type | Count rate plots | Images |
|---|---|---|
| Comparison with Poisson distribution Blue bars denote a histogram of data divided into 1 sec bins. Red curve is a Poisson curve with rate = median count rate of data. |
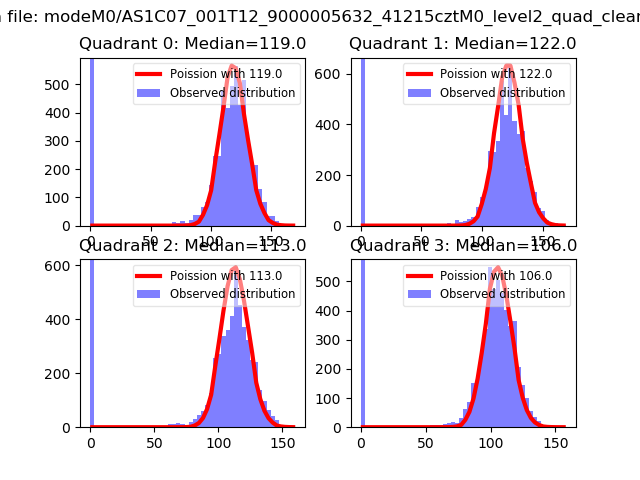 |
 |
| Quadrant-wise count rates Data is divided into 100 sec bins |
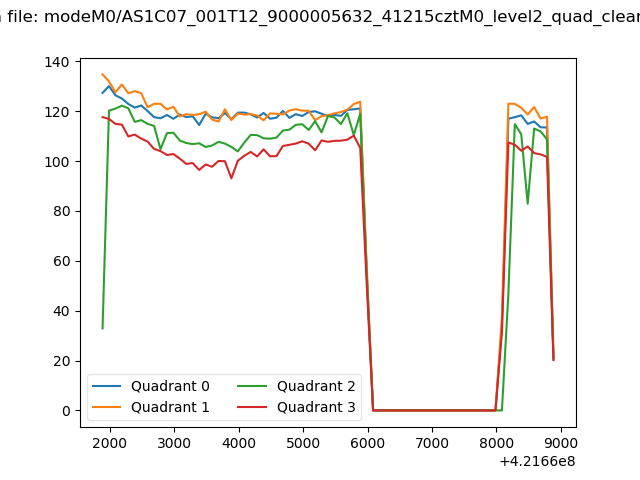 |
|
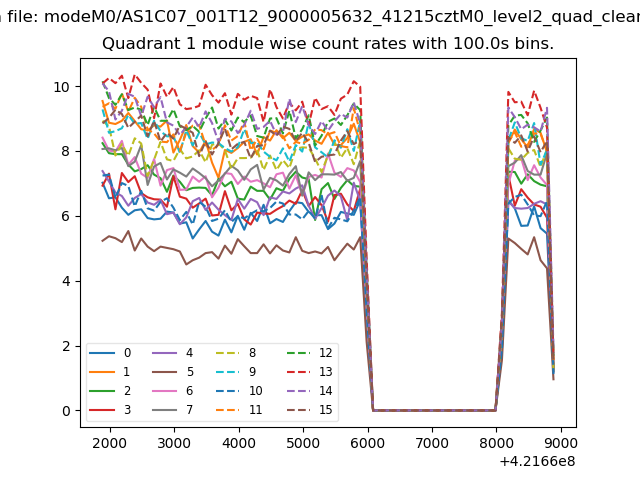
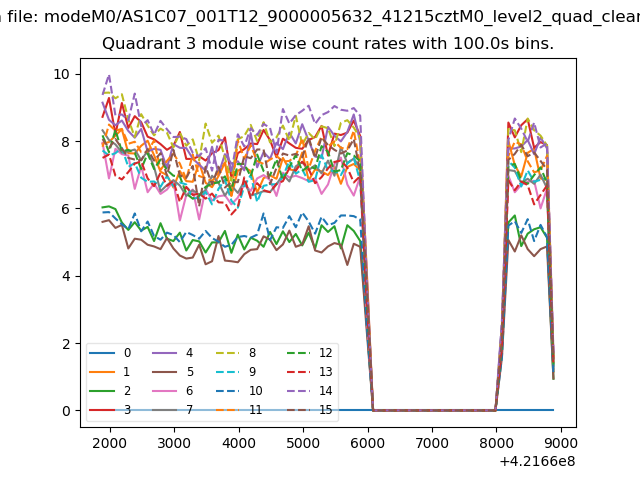
| Module-wise count rates for Quadrant A Data is divided into 100 sec bins |
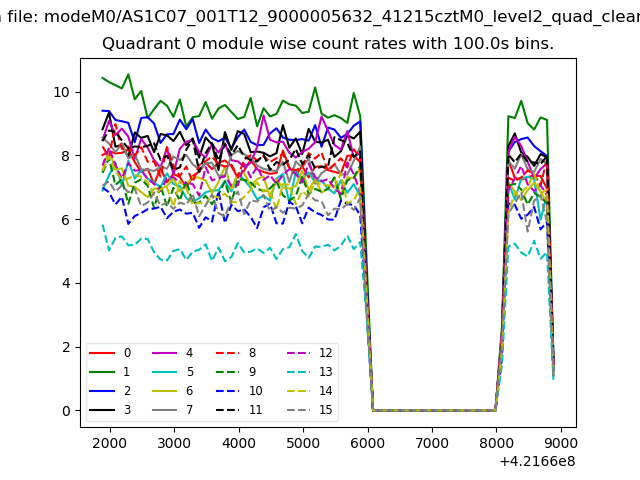 |
 |
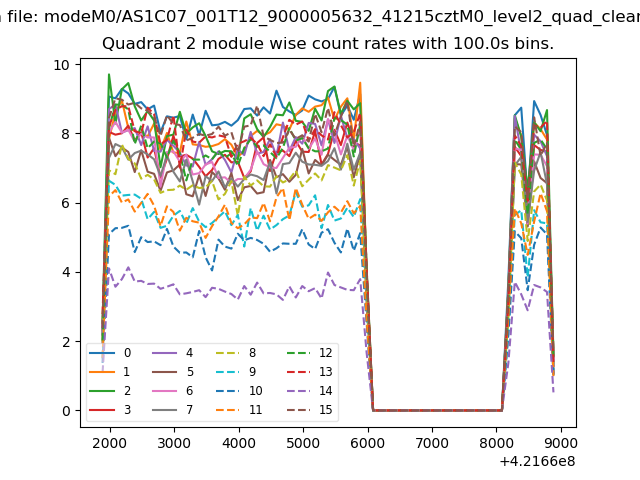
| Module-wise count rates for Quadrant B Data is divided into 100 sec bins |
 |
 |
| Module-wise count rates for Quadrant C Data is divided into 100 sec bins |
 |
 |
| Module-wise count rates for Quadrant D Data is divided into 100 sec bins |
 |
 |
| Parameter | Plot |
|---|---|
| CZT HV Monitor | 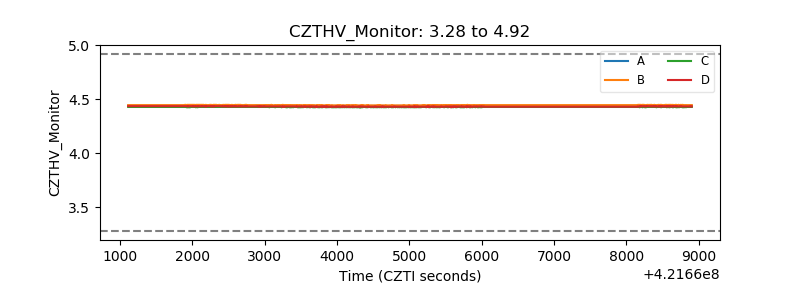 |
| D_VDD | 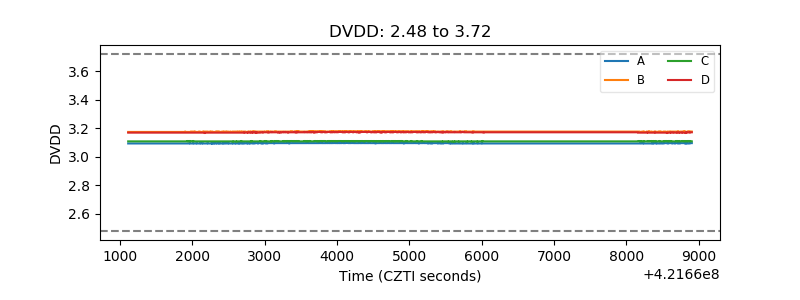 |
| Temperature 1 | 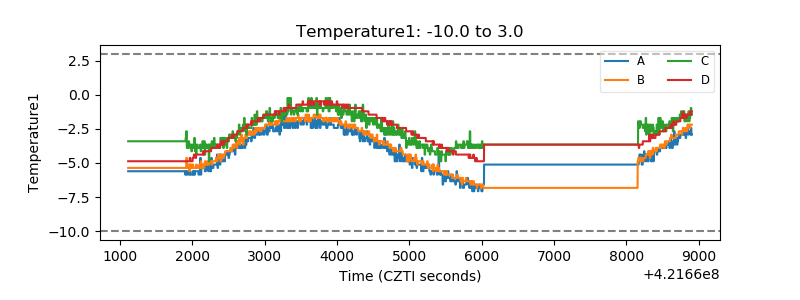 |
| Veto HV Monitor | 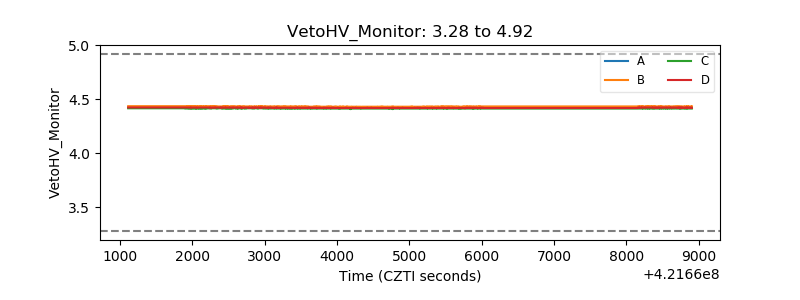 |
| Veto LLD | 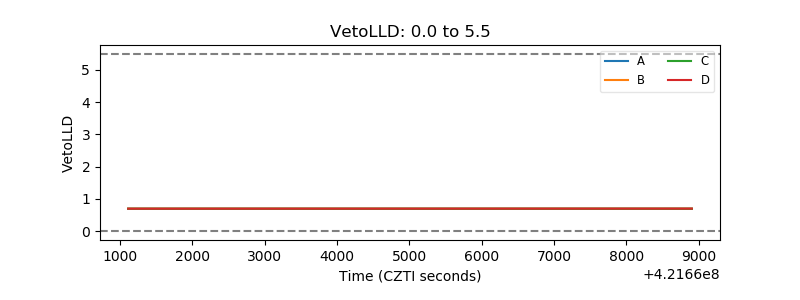 |
| Alpha Counter | 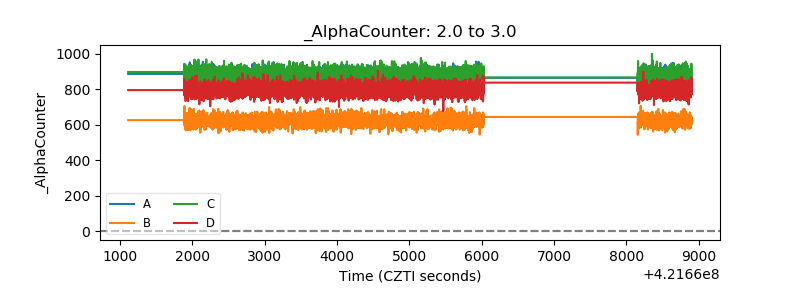 |
| _CPM_Rate | 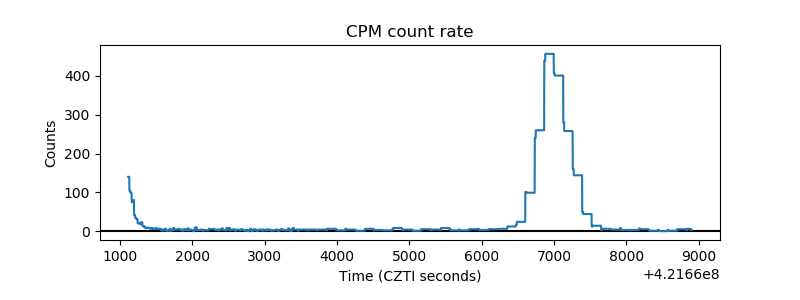 |
| CZT Counter | 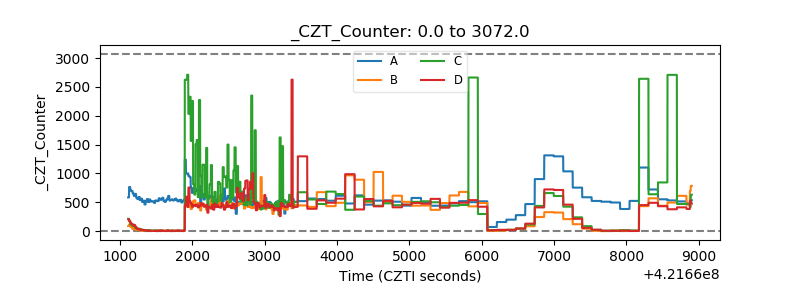 |
| +2.5 Volts monitor | 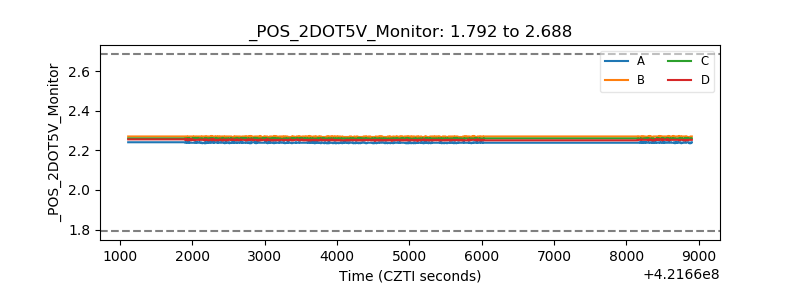 |
| +5 Volts monitor | 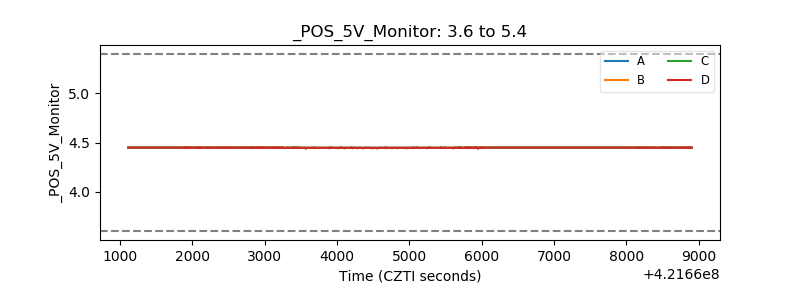 |
| _ROLL_ROT | 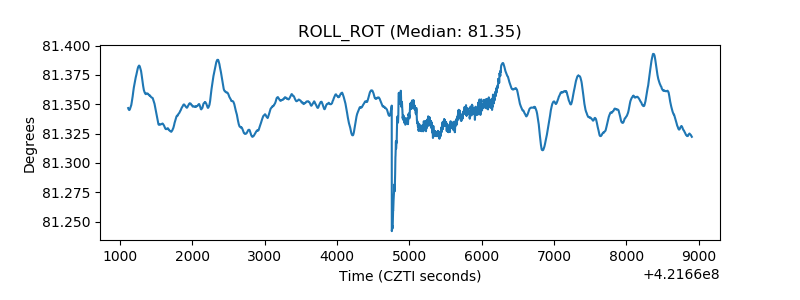 |
| _Roll_DEC | 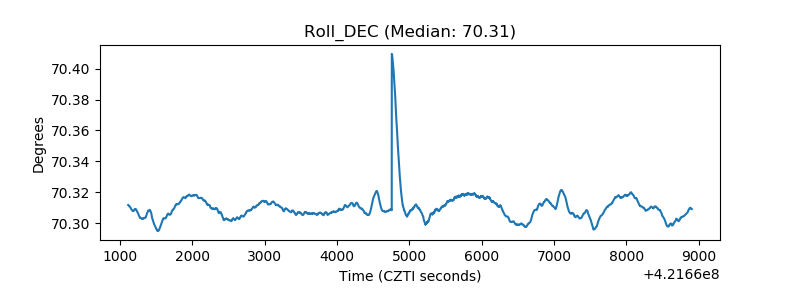 |
| _Roll_RA | 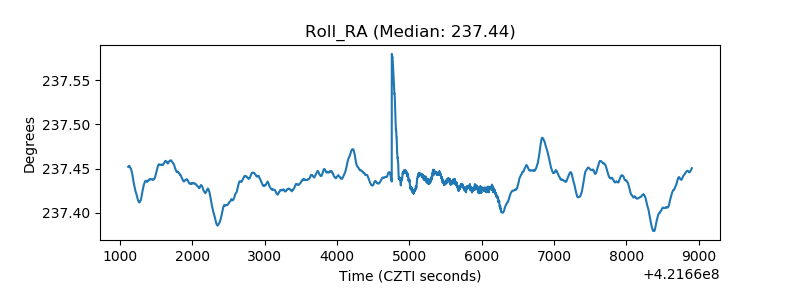 |
| Veto Counter | 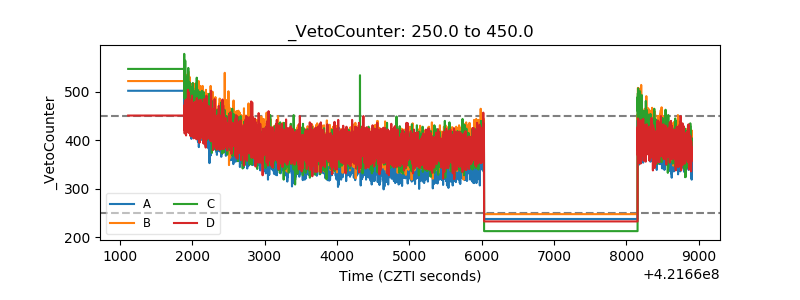 |