| Param | Original file | Final file |
|---|---|---|
| Filename | modeM0/AS1C07_001T12_9000005632_41216cztM0_level2.fits | modeM0/AS1C07_001T12_9000005632_41216cztM0_level2_quad_clean.evt |
| Size (bytes) | 353,160,000 | 86,788,800 |
| Size | 336.8 MB | 82.8 MB |
| Events in quadrant A | 3,078,711 | 595,469 |
| Events in quadrant B | 3,229,774 | 593,548 |
| Events in quadrant C | 3,449,615 | 550,197 |
| Events in quadrant D | 2,906,841 | 521,920 |
| Mode M0 | |||
|---|---|---|---|
| Quadrant | BADHDUFLAG | Total packets | Discarded packets |
| A | 0 | 12268 | 3 |
| B | 0 | 13204 | 2 |
| C | 0 | 13667 | 2 |
| D | 0 | 12322 | 2 |
| Mode M9 | |||
|---|---|---|---|
| Quadrant | BADHDUFLAG | Total packets | Discarded packets |
| A | 0 | 29 | 0 |
| B | 0 | 29 | 0 |
| C | 0 | 29 | 0 |
| D | 0 | 30 | 0 |
| Mode SS | |||
|---|---|---|---|
| Quadrant | BADHDUFLAG | Total packets | Discarded packets |
| A | 0 | 106 | 0 |
| B | 0 | 106 | 0 |
| C | 0 | 106 | 0 |
| D | 0 | 106 | 0 |
| Quadrant | Total seconds | Saturated seconds | Saturation percentage |
|---|---|---|---|
| A | 5239 | 14 | 0.267227% |
| B | 5239 | 174 | 3.321245% |
| C | 5239 | 219 | 4.180187% |
| D | 5239 | 92 | 1.756060% |
Noise dominated data is calculated using 1-second bins in cleaned event files. If a bin has >2000 counts, and if more than 50% of those come from <1% of pixels, then it is considered to be noise-dominated and hence unusable.
| Quadrant | # 1 sec bins | Bins with >0 counts | Bins with >2000 counts | High rate bins dominated by noise | Noise dominated (total time) | Noise dominated (detector-on time) | Marked lightcurve |
|---|---|---|---|---|---|---|---|
| A | 7273 | 5240 | 6 | 6 | 0.08% | 0.11% | 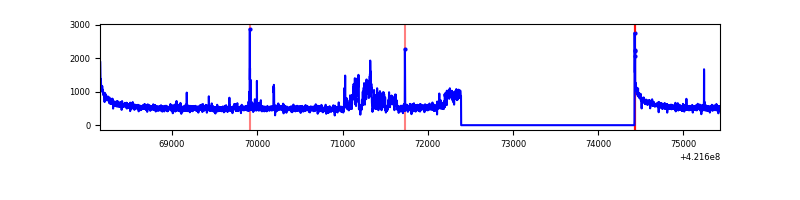 |
| B | 7273 | 5240 | 142 | 142 | 1.95% | 2.71% | 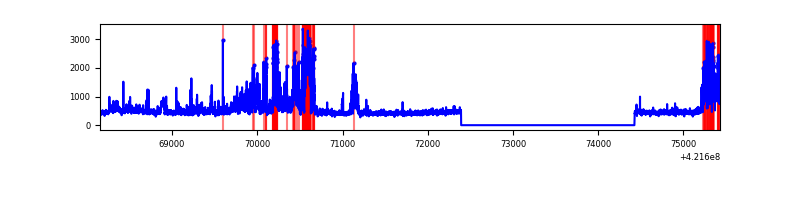 |
| C | 7273 | 5240 | 214 | 214 | 2.94% | 4.08% | 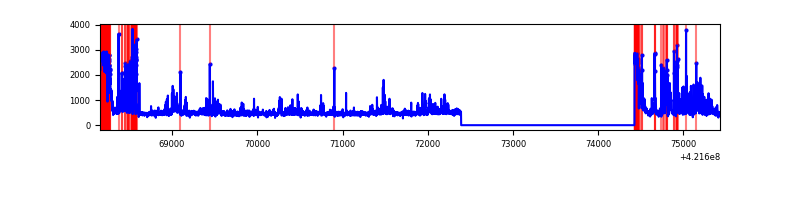 |
| D | 7273 | 5240 | 86 | 86 | 1.18% | 1.64% | 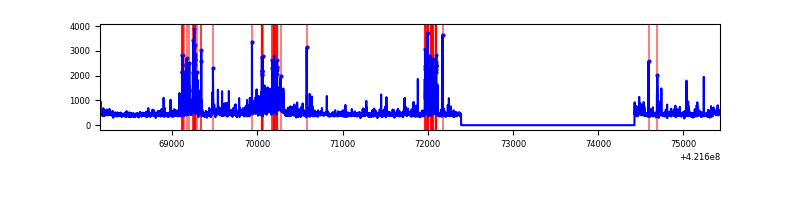 |
Top three noisy pixels from each quadrant. If the there are fewer than three noisy pixels in the level2.evt file, extra rows are filled as -1
| Pixel properties | Quadrant properties | ||||||
|---|---|---|---|---|---|---|---|
| Quadrant | DetID | PixID | Counts | Sigma | Mean | Median | Sigma |
| A | 10 | 83 | 532699 | 4647.15 | 566 | 554 | 114.5 |
| A | 12 | 189 | 305354 | 2661.78 | 566 | 554 | 114.5 |
| A | 0 | 8 | 32137 | 275.81 | 566 | 554 | 114.5 |
| B | 0 | 186 | 573411 | 5439.29 | 555 | 540 | 105.3 |
| B | 0 | 245 | 167303 | 1583.38 | 555 | 540 | 105.3 |
| B | 0 | 190 | 138125 | 1306.34 | 555 | 540 | 105.3 |
| C | 14 | 254 | 642068 | 5178.06 | 536 | 538 | 123.9 |
| C | 0 | 10 | 442016 | 3563.35 | 536 | 538 | 123.9 |
| C | 15 | 214 | 224780 | 1809.95 | 536 | 538 | 123.9 |
| D | 13 | 249 | 232250 | 1736.45 | 549 | 533 | 133.4 |
| D | 5 | 222 | 213080 | 1592.79 | 549 | 533 | 133.4 |
| D | 1 | 47 | 137741 | 1028.22 | 549 | 533 | 133.4 |
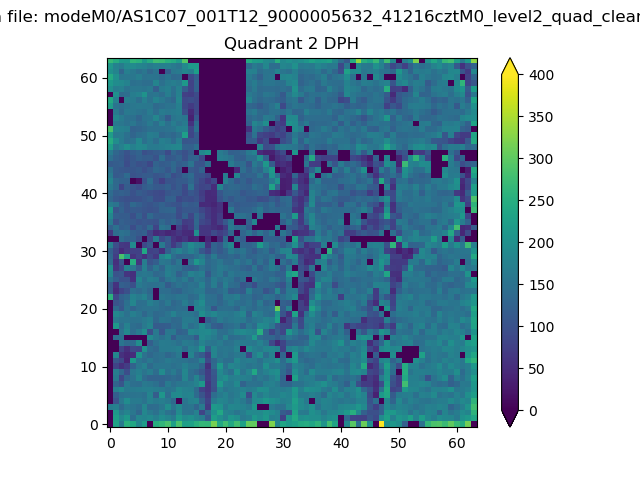
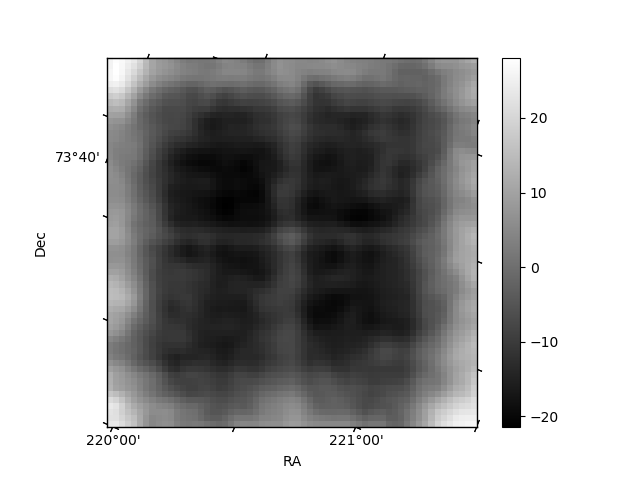
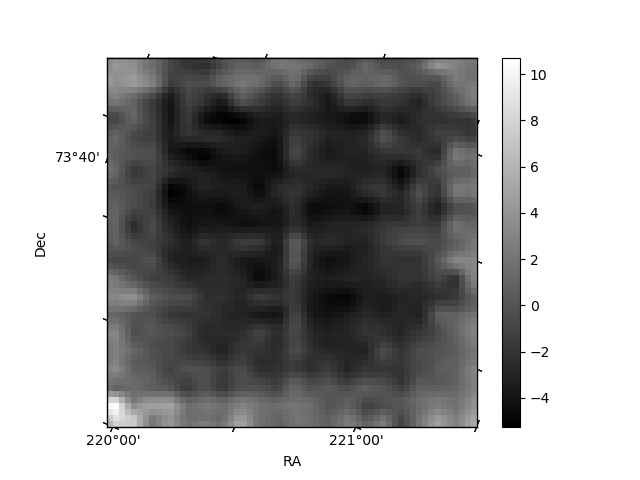
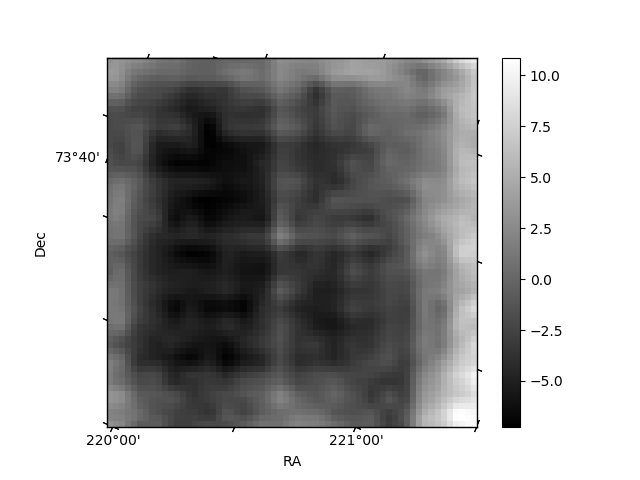
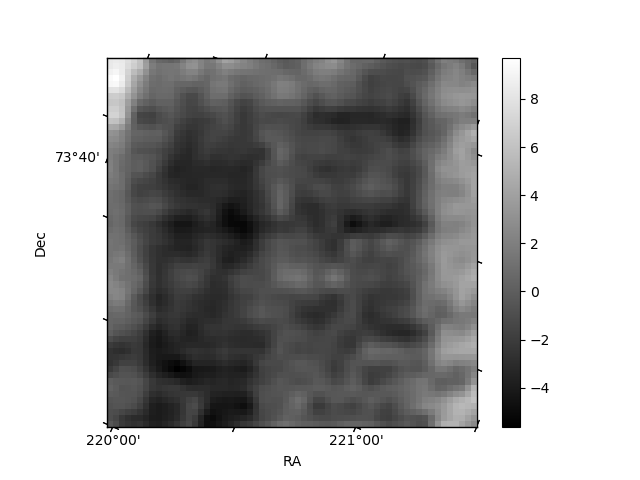
Histogram calculated using DETX and DETY for each event in the final _common_clean file
| Quadrant A | 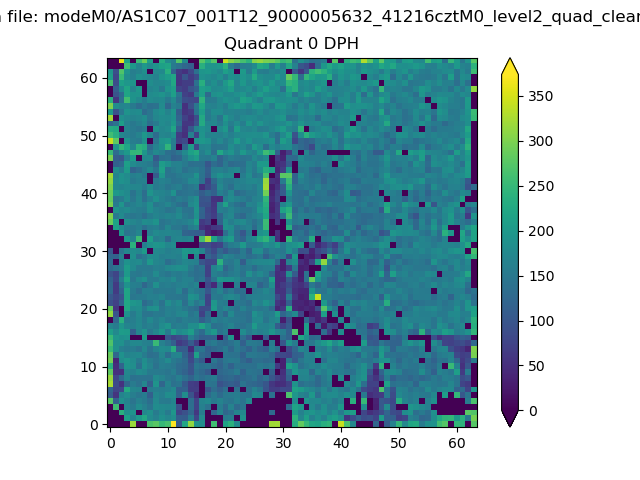 |
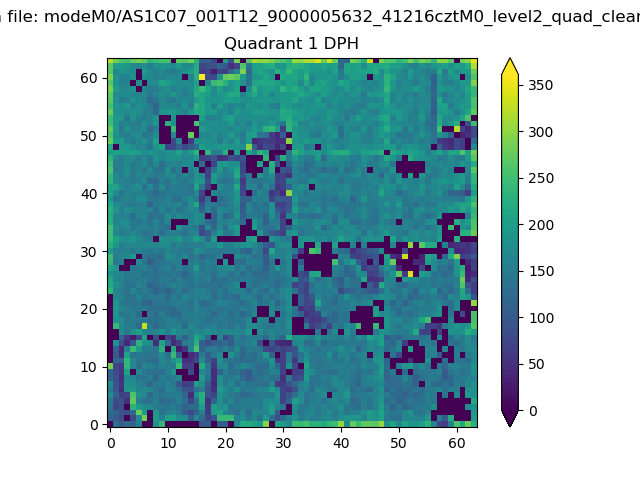 |
Quadrant B |
|---|---|---|---|
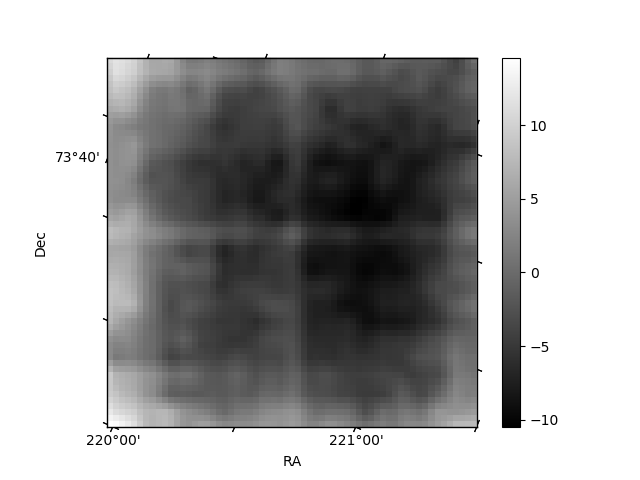
| Quadrant D | 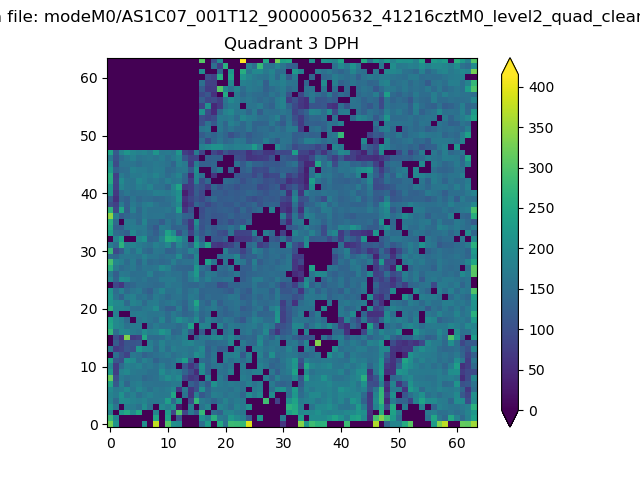 |
 |
Quadrant C |
| Plot type | Count rate plots | Images |
|---|---|---|
| Comparison with Poisson distribution Blue bars denote a histogram of data divided into 1 sec bins. Red curve is a Poisson curve with rate = median count rate of data. |
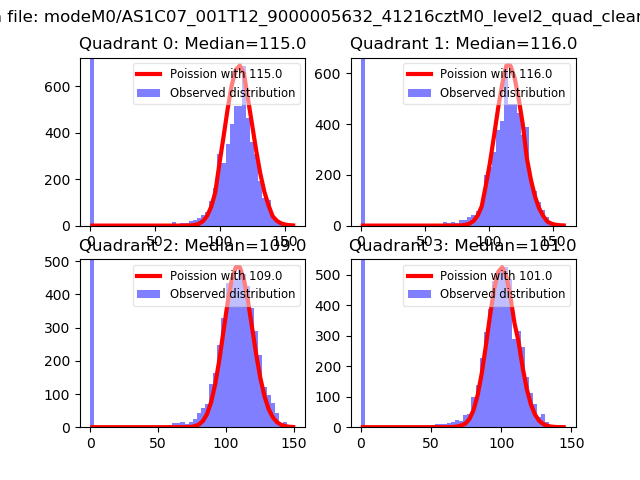 |
 |
| Quadrant-wise count rates Data is divided into 100 sec bins |
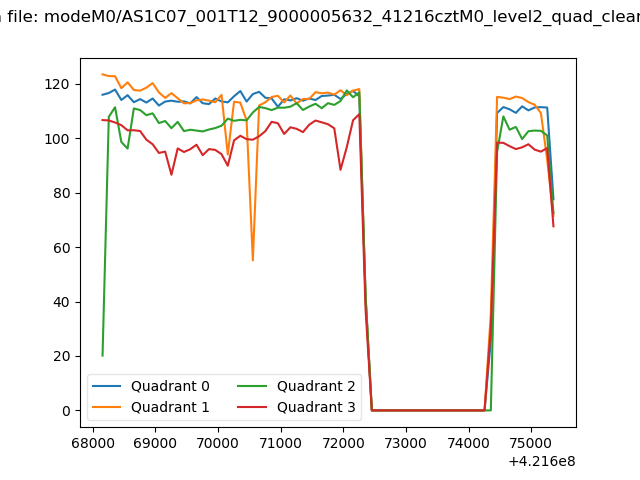 |
|
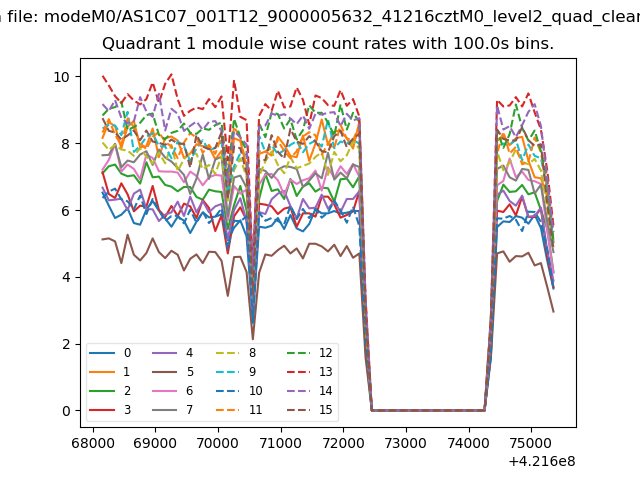
| Module-wise count rates for Quadrant A Data is divided into 100 sec bins |
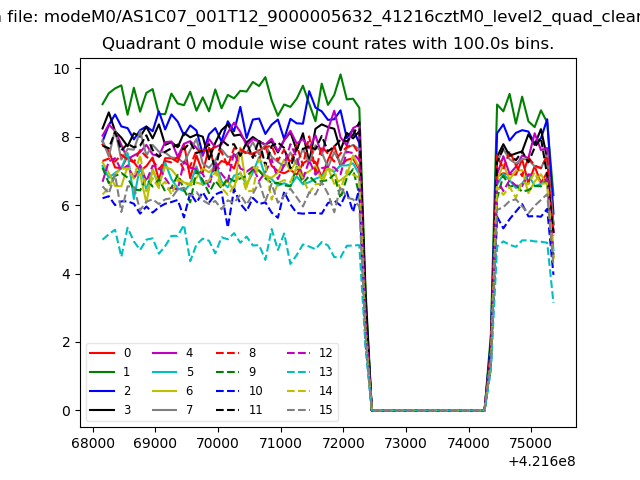 |
 |
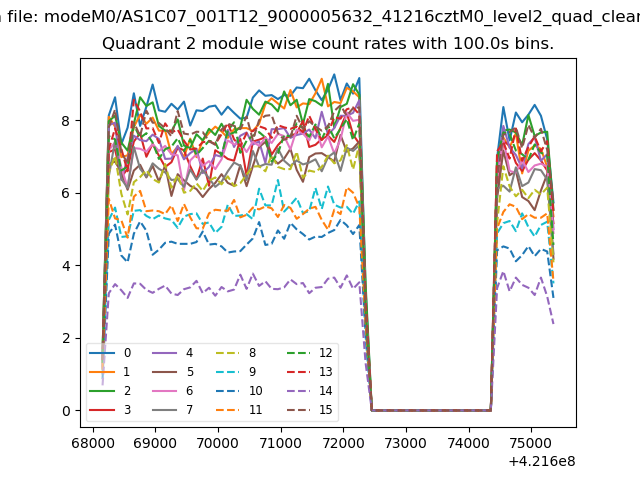
| Module-wise count rates for Quadrant B Data is divided into 100 sec bins |
 |
 |
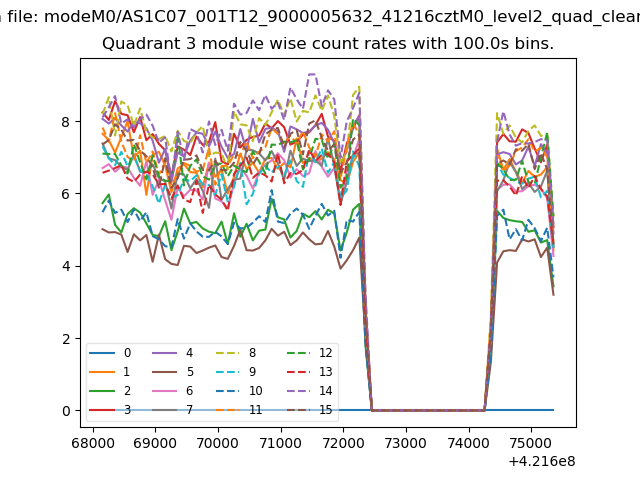
| Module-wise count rates for Quadrant C Data is divided into 100 sec bins |
 |
 |
| Module-wise count rates for Quadrant D Data is divided into 100 sec bins |
 |
 |
| Parameter | Plot |
|---|---|
| CZT HV Monitor | 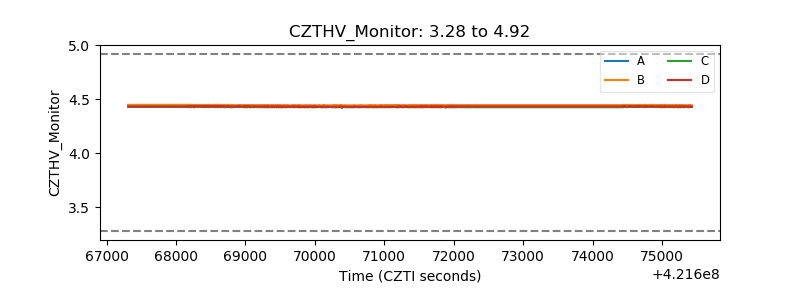 |
| D_VDD | 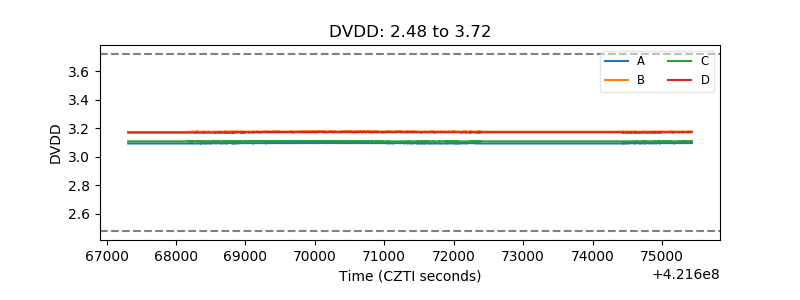 |
| Temperature 1 | 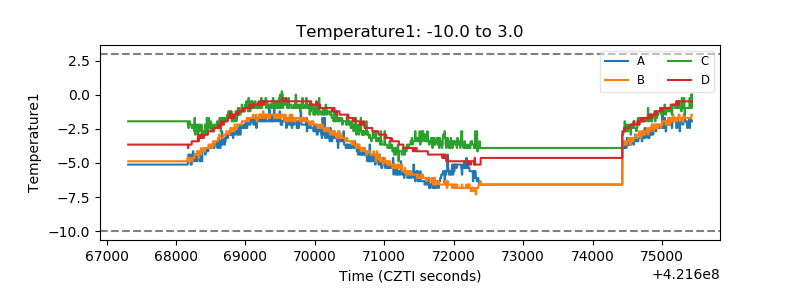 |
| Veto HV Monitor | 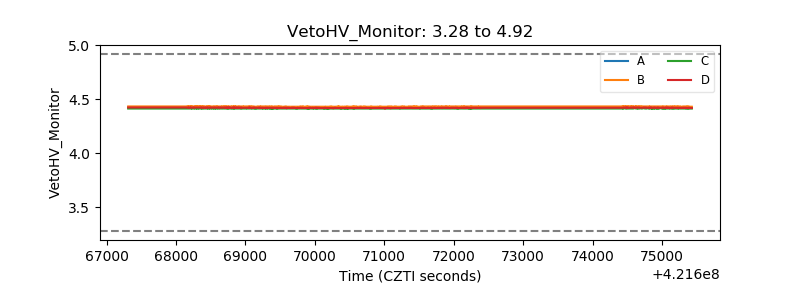 |
| Veto LLD | 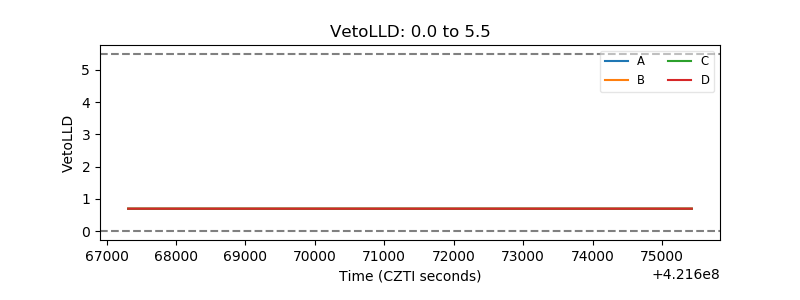 |
| Alpha Counter | 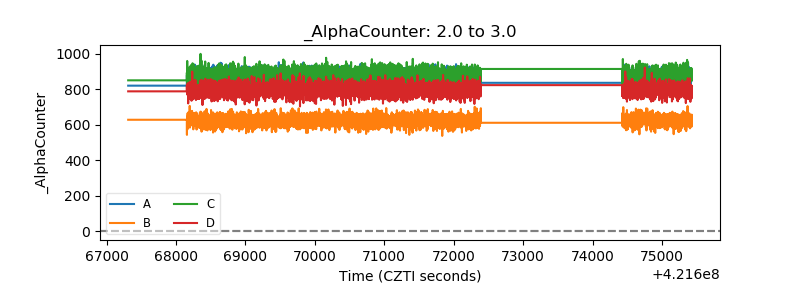 |
| _CPM_Rate | 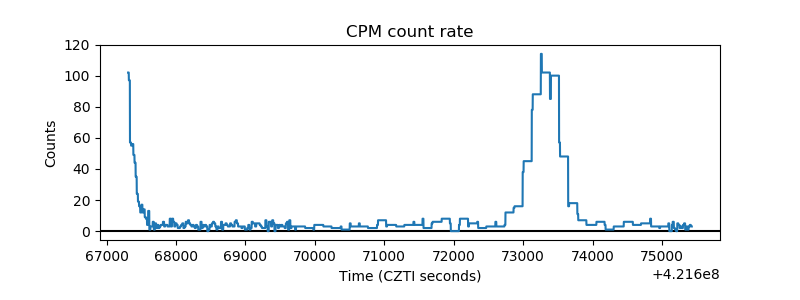 |
| CZT Counter | 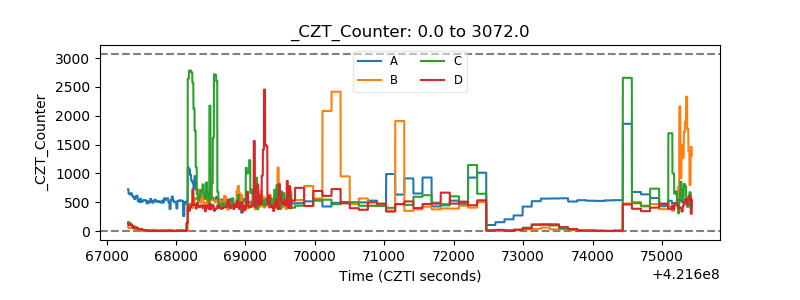 |
| +2.5 Volts monitor |  |
| +5 Volts monitor | 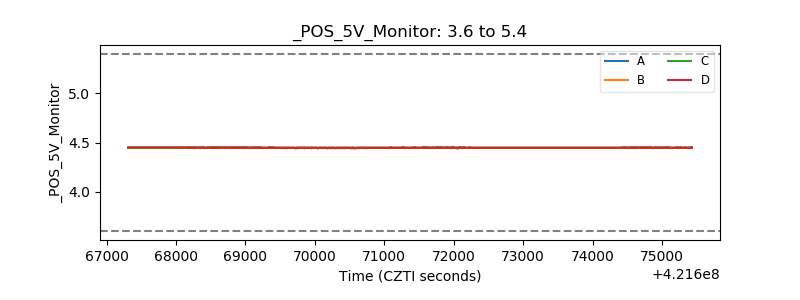 |
| _ROLL_ROT | 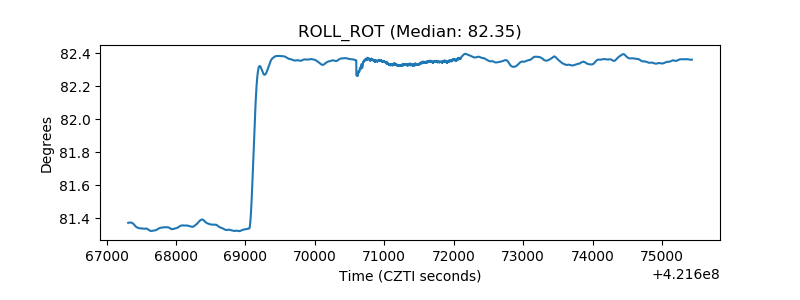 |
| _Roll_DEC | 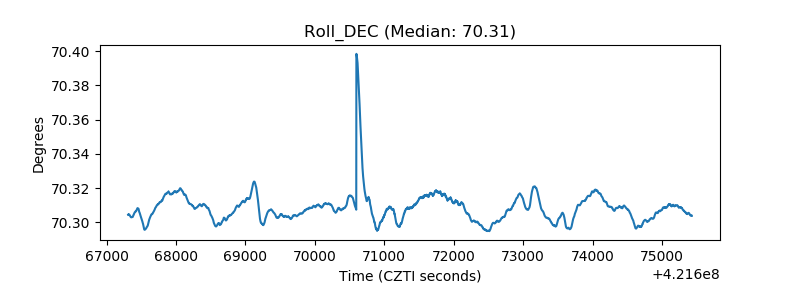 |
| _Roll_RA | 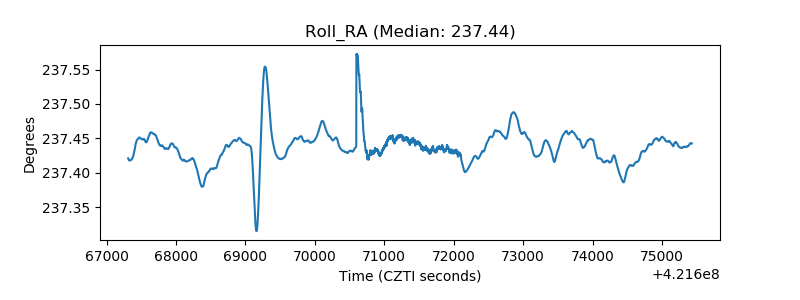 |
| Veto Counter | 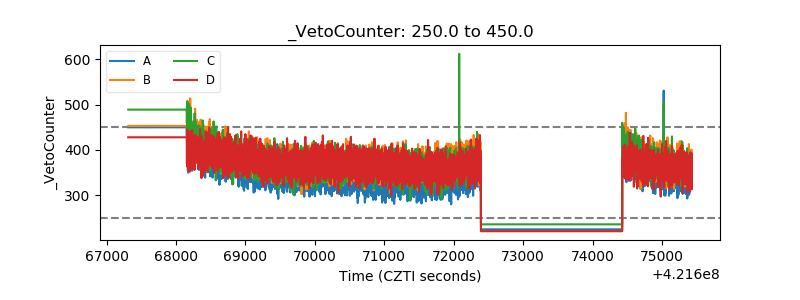 |