| Param | Original file | Final file |
|---|---|---|
| Filename | modeM0/AS1C07_001T12_9000005632_41217cztM0_level2.fits | modeM0/AS1C07_001T12_9000005632_41217cztM0_level2_quad_clean.evt |
| Size (bytes) | 342,319,680 | 88,669,440 |
| Size | 326.5 MB | 84.6 MB |
| Events in quadrant A | 2,868,862 | 601,923 |
| Events in quadrant B | 3,562,521 | 595,636 |
| Events in quadrant C | 2,933,872 | 571,123 |
| Events in quadrant D | 2,881,448 | 534,129 |
| Mode M0 | |||
|---|---|---|---|
| Quadrant | BADHDUFLAG | Total packets | Discarded packets |
| A | 0 | 11837 | 3 |
| B | 0 | 14425 | 2 |
| C | 0 | 12414 | 2 |
| D | 0 | 12418 | 2 |
| Mode M9 | |||
|---|---|---|---|
| Quadrant | BADHDUFLAG | Total packets | Discarded packets |
| A | 0 | 17 | 0 |
| B | 0 | 17 | 0 |
| C | 0 | 17 | 0 |
| D | 0 | 18 | 0 |
| Mode SS | |||
|---|---|---|---|
| Quadrant | BADHDUFLAG | Total packets | Discarded packets |
| A | 0 | 112 | 0 |
| B | 0 | 112 | 0 |
| C | 0 | 112 | 0 |
| D | 0 | 112 | 0 |
| Quadrant | Total seconds | Saturated seconds | Saturation percentage |
|---|---|---|---|
| A | 5455 | 15 | 0.274977% |
| B | 5455 | 211 | 3.868011% |
| C | 5455 | 76 | 1.393217% |
| D | 5455 | 39 | 0.714940% |
Noise dominated data is calculated using 1-second bins in cleaned event files. If a bin has >2000 counts, and if more than 50% of those come from <1% of pixels, then it is considered to be noise-dominated and hence unusable.
| Quadrant | # 1 sec bins | Bins with >0 counts | Bins with >2000 counts | High rate bins dominated by noise | Noise dominated (total time) | Noise dominated (detector-on time) | Marked lightcurve |
|---|---|---|---|---|---|---|---|
| A | 7218 | 5456 | 6 | 6 | 0.08% | 0.11% | 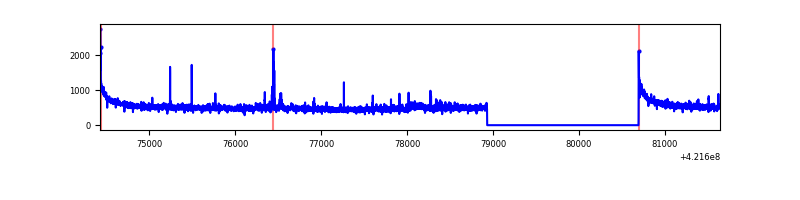 |
| B | 7218 | 5456 | 180 | 180 | 2.49% | 3.30% | 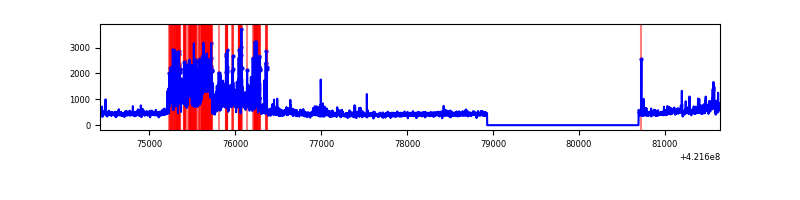 |
| C | 7218 | 5456 | 71 | 71 | 0.98% | 1.30% | 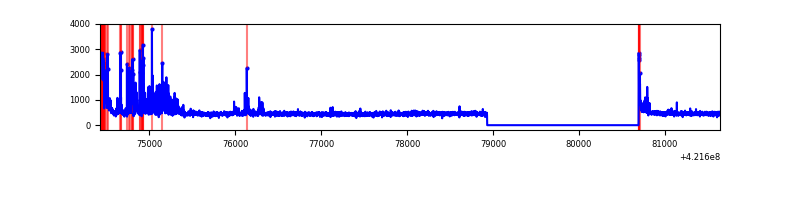 |
| D | 7218 | 5456 | 36 | 36 | 0.50% | 0.66% | 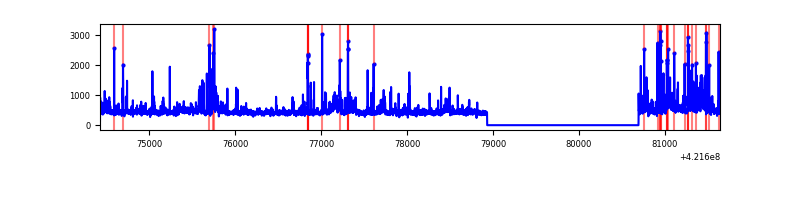 |
Top three noisy pixels from each quadrant. If the there are fewer than three noisy pixels in the level2.evt file, extra rows are filled as -1
| Pixel properties | Quadrant properties | ||||||
|---|---|---|---|---|---|---|---|
| Quadrant | DetID | PixID | Counts | Sigma | Mean | Median | Sigma |
| A | 10 | 83 | 546068 | 4623.92 | 578 | 566 | 118.0 |
| A | 0 | 8 | 25285 | 209.53 | 578 | 566 | 118.0 |
| A | 10 | 255 | 25051 | 207.55 | 578 | 566 | 118.0 |
| B | 0 | 186 | 1007760 | 9253.89 | 567 | 550 | 108.8 |
| B | 0 | 245 | 144776 | 1325.1 | 567 | 550 | 108.8 |
| B | 0 | 190 | 141417 | 1294.24 | 567 | 550 | 108.8 |
| C | 14 | 254 | 332153 | 2562.13 | 559 | 561 | 129.4 |
| C | 15 | 214 | 233121 | 1796.94 | 559 | 561 | 129.4 |
| C | 0 | 10 | 183671 | 1414.85 | 559 | 561 | 129.4 |
| D | 5 | 222 | 185191 | 1328.52 | 564 | 547 | 139.0 |
| D | 13 | 249 | 174103 | 1248.74 | 564 | 547 | 139.0 |
| D | 2 | 120 | 117670 | 842.7 | 564 | 547 | 139.0 |
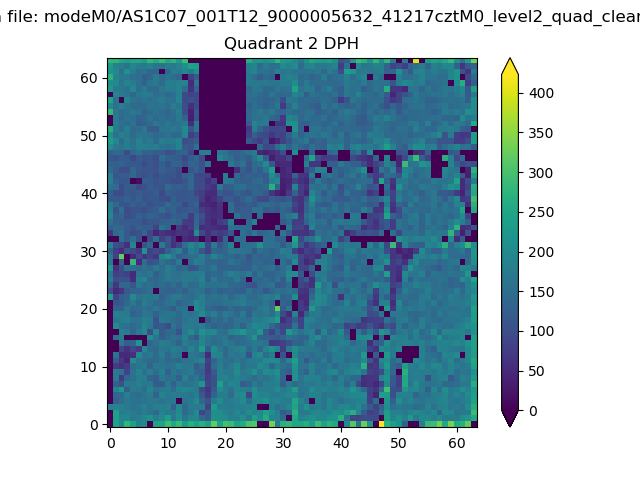
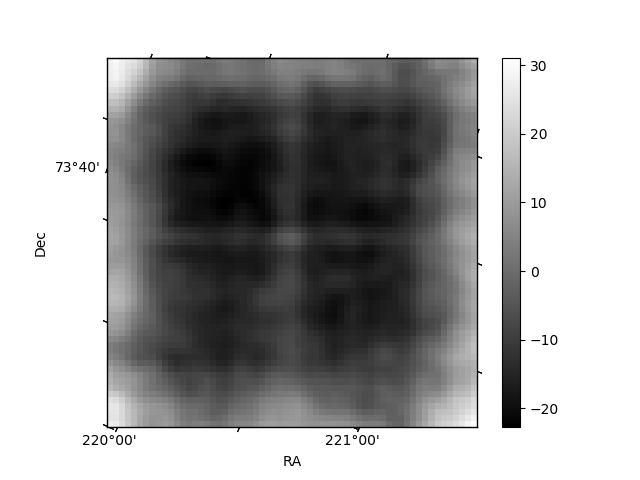
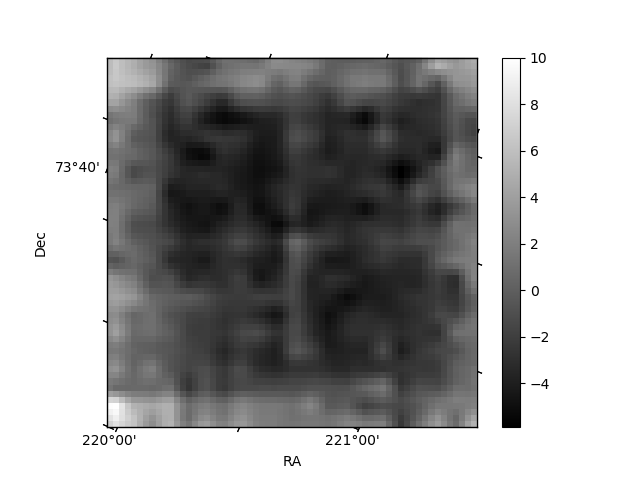
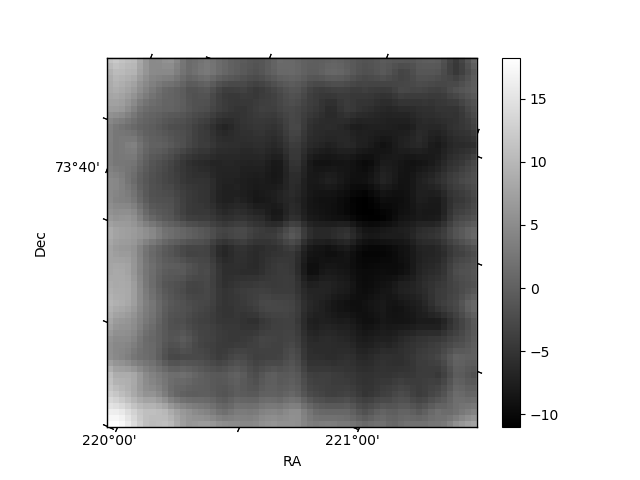
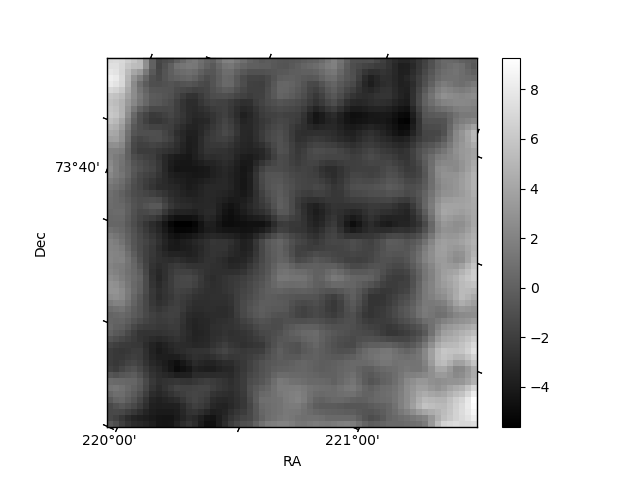
Histogram calculated using DETX and DETY for each event in the final _common_clean file
| Quadrant A | 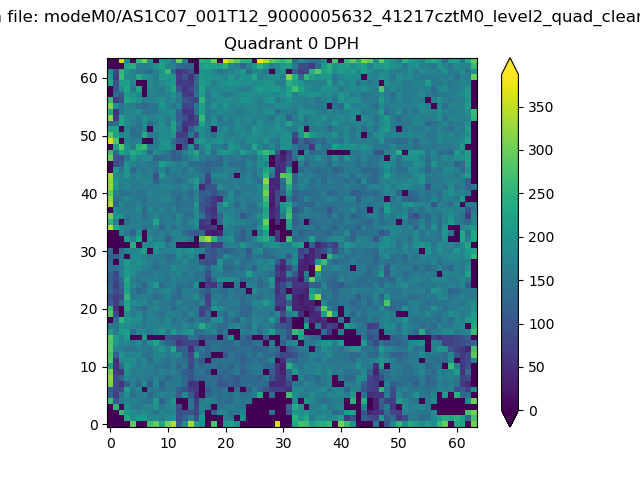 |
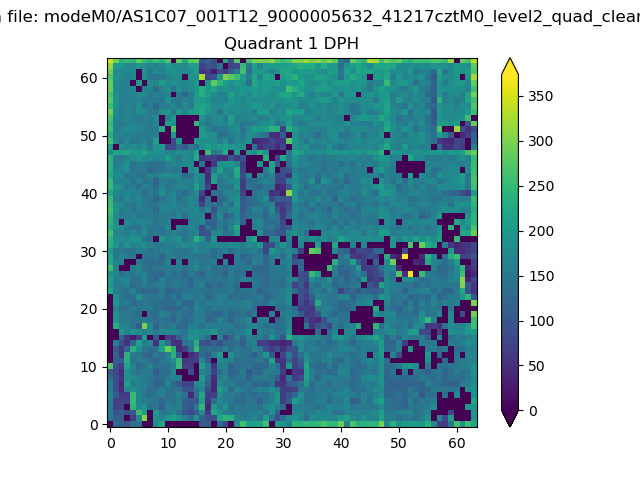 |
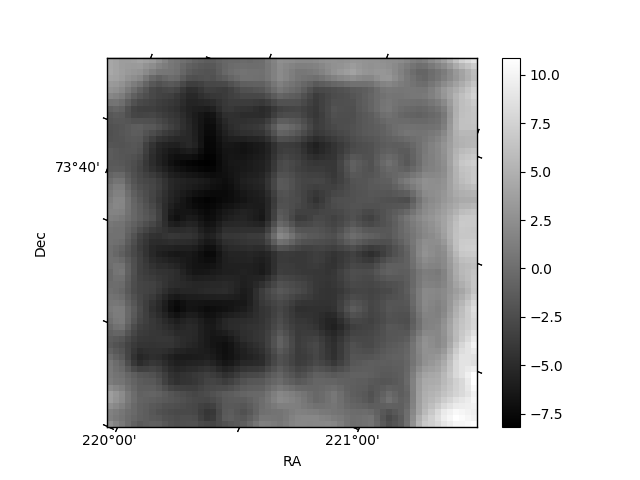
Quadrant B |
|---|---|---|---|
| Quadrant D | 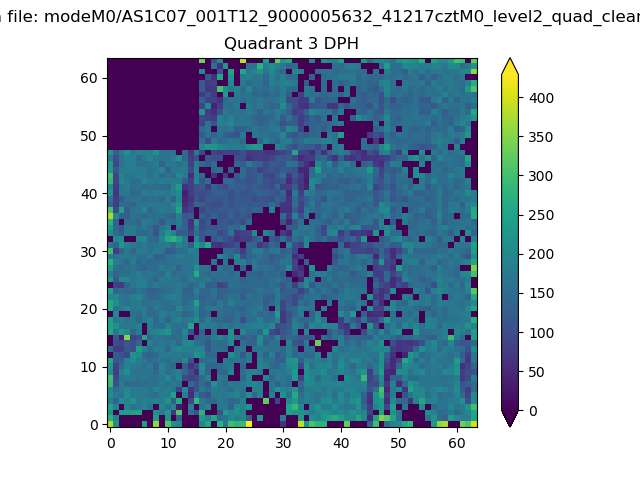 |
 |
Quadrant C |
| Plot type | Count rate plots | Images |
|---|---|---|
| Comparison with Poisson distribution Blue bars denote a histogram of data divided into 1 sec bins. Red curve is a Poisson curve with rate = median count rate of data. |
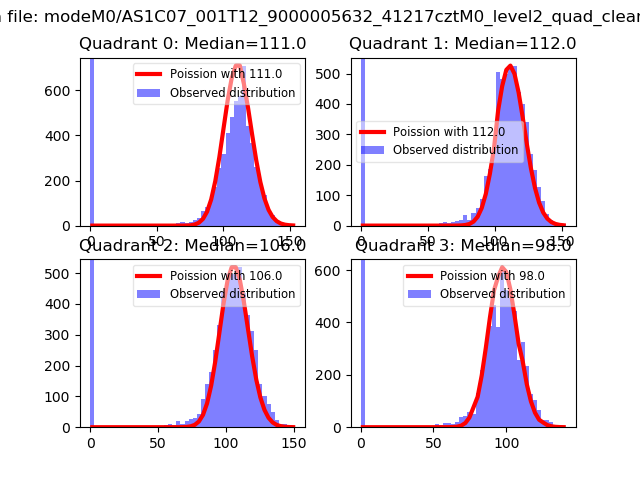 |
 |
| Quadrant-wise count rates Data is divided into 100 sec bins |
 |
|
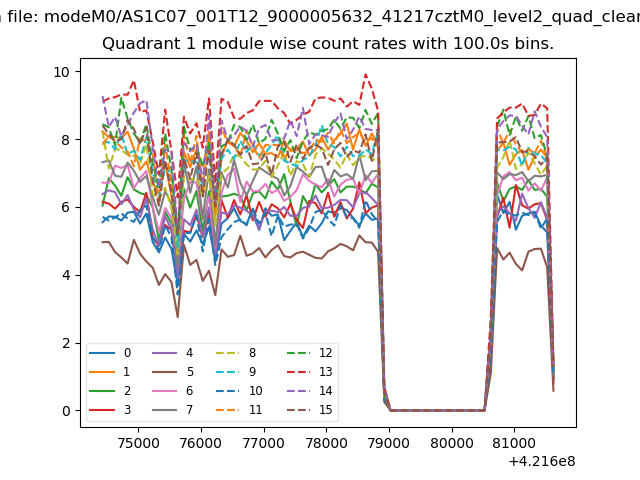
| Module-wise count rates for Quadrant A Data is divided into 100 sec bins |
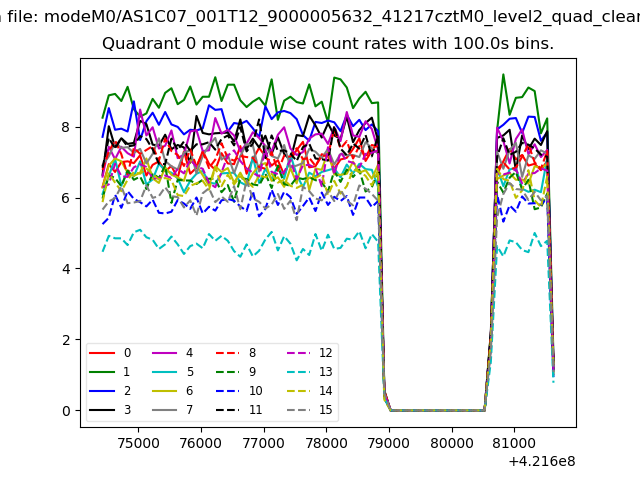 |
 |
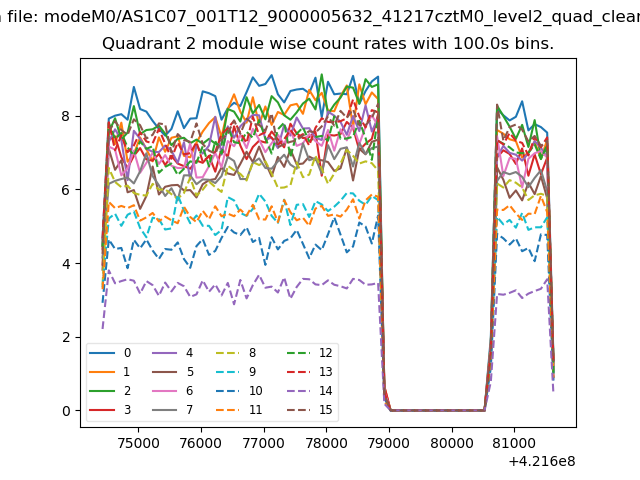
| Module-wise count rates for Quadrant B Data is divided into 100 sec bins |
 |
 |
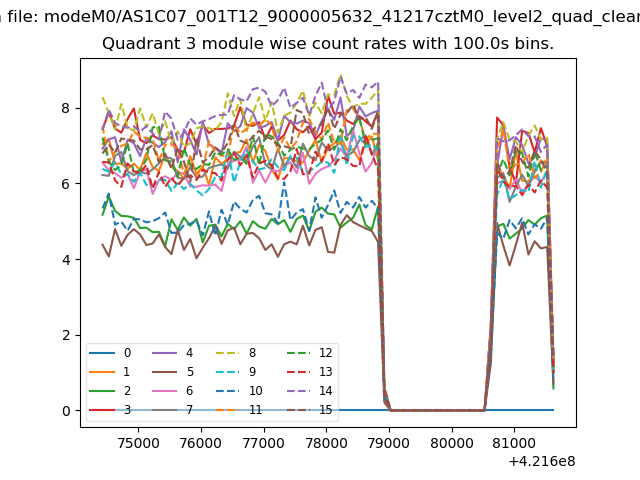
| Module-wise count rates for Quadrant C Data is divided into 100 sec bins |
 |
 |
| Module-wise count rates for Quadrant D Data is divided into 100 sec bins |
 |
 |
| Parameter | Plot |
|---|---|
| CZT HV Monitor | 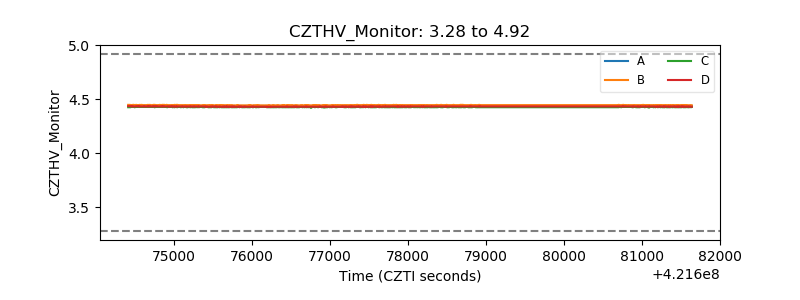 |
| D_VDD | 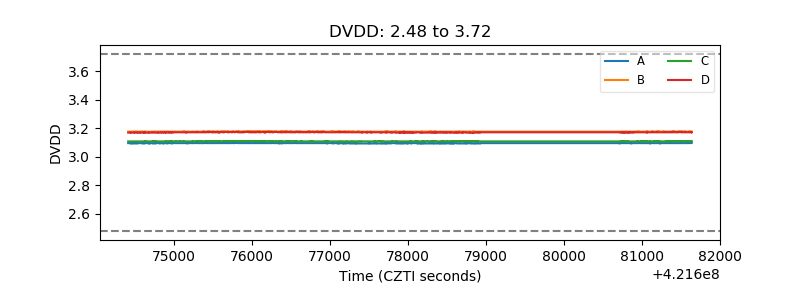 |
| Temperature 1 | 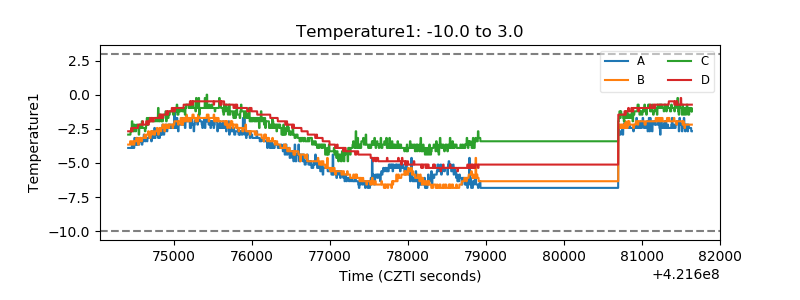 |
| Veto HV Monitor | 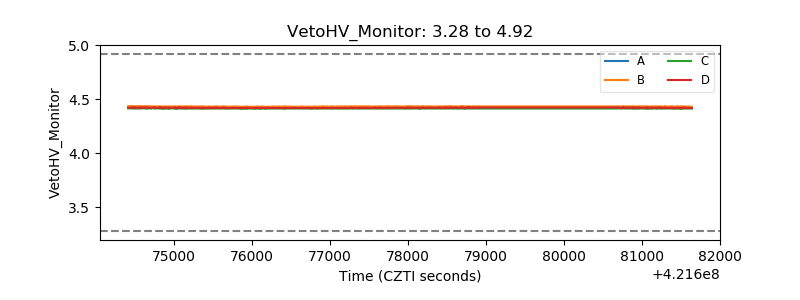 |
| Veto LLD | 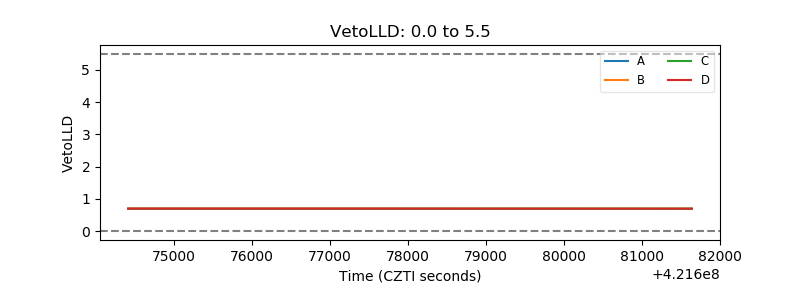 |
| Alpha Counter | 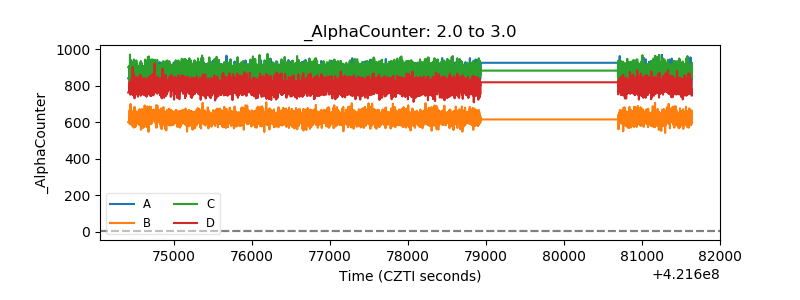 |
| _CPM_Rate | 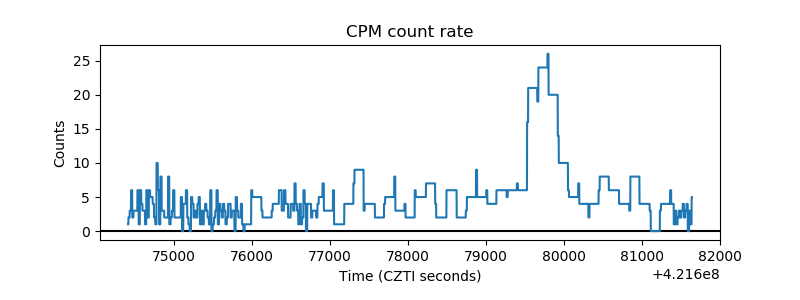 |
| CZT Counter | 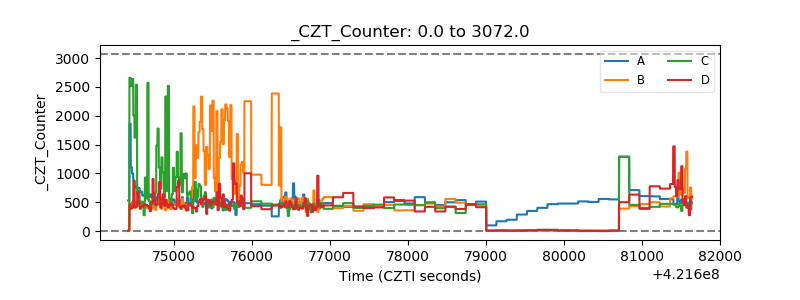 |
| +2.5 Volts monitor | 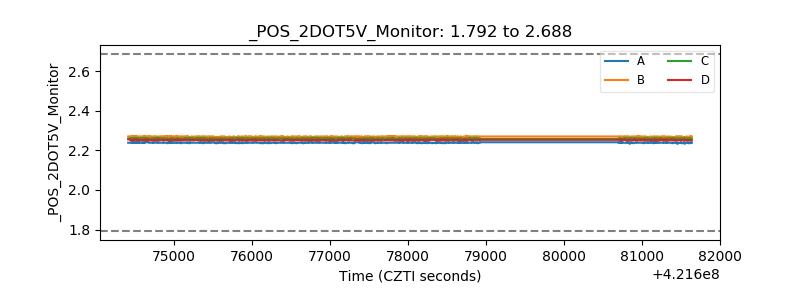 |
| +5 Volts monitor | 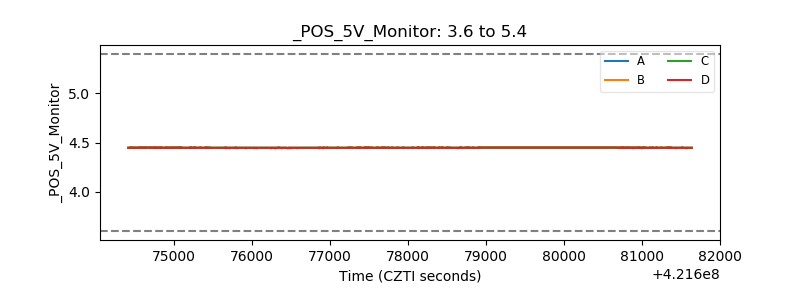 |
| _ROLL_ROT | 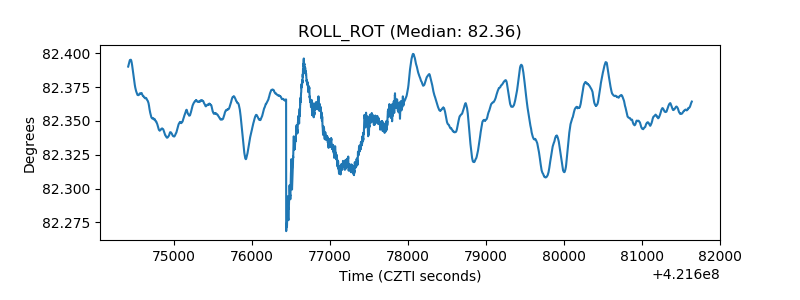 |
| _Roll_DEC | 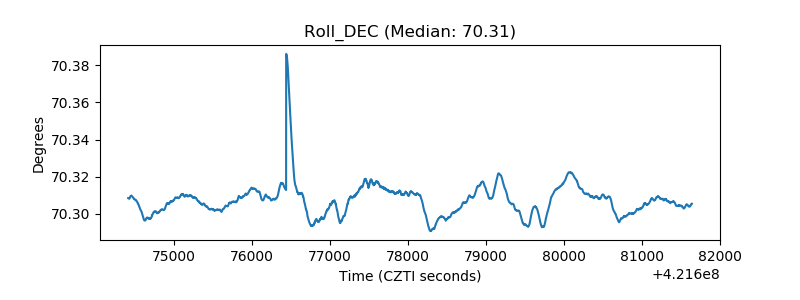 |
| _Roll_RA | 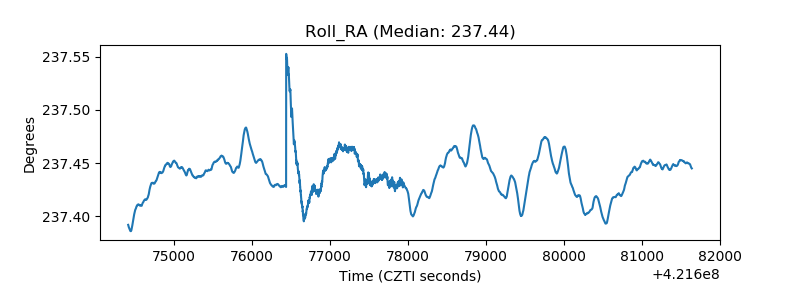 |
| Veto Counter | 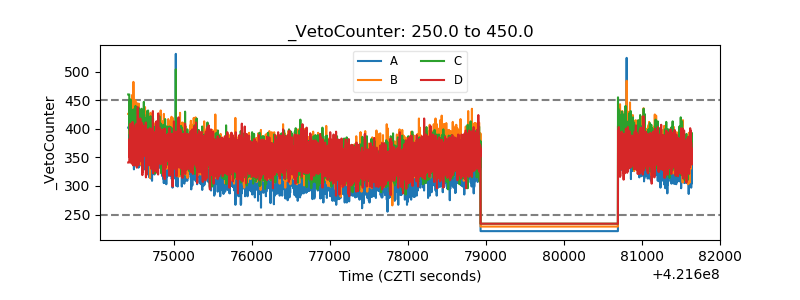 |