| Param | Original file | Final file |
|---|---|---|
| Filename | modeM0/AS1C07_001T12_9000005632_41218cztM0_level2.fits | modeM0/AS1C07_001T12_9000005632_41218cztM0_level2_quad_clean.evt |
| Size (bytes) | 325,560,960 | 90,383,040 |
| Size | 310.5 MB | 86.2 MB |
| Events in quadrant A | 3,042,113 | 606,101 |
| Events in quadrant B | 2,912,653 | 612,548 |
| Events in quadrant C | 2,663,266 | 585,678 |
| Events in quadrant D | 2,998,177 | 541,860 |
| Mode M0 | |||
|---|---|---|---|
| Quadrant | BADHDUFLAG | Total packets | Discarded packets |
| A | 0 | 12505 | 3 |
| B | 0 | 12760 | 2 |
| C | 0 | 11620 | 2 |
| D | 0 | 12876 | 2 |
| Mode M9 | |||
|---|---|---|---|
| Quadrant | BADHDUFLAG | Total packets | Discarded packets |
| A | 0 | 16 | 0 |
| B | 0 | 16 | 0 |
| C | 0 | 16 | 0 |
| D | 0 | 17 | 0 |
| Mode SS | |||
|---|---|---|---|
| Quadrant | BADHDUFLAG | Total packets | Discarded packets |
| A | 0 | 114 | 0 |
| B | 0 | 114 | 0 |
| C | 0 | 114 | 0 |
| D | 0 | 114 | 0 |
| Quadrant | Total seconds | Saturated seconds | Saturation percentage |
|---|---|---|---|
| A | 5583 | 20 | 0.358230% |
| B | 5583 | 40 | 0.716461% |
| C | 5583 | 36 | 0.644815% |
| D | 5583 | 68 | 1.217983% |
Noise dominated data is calculated using 1-second bins in cleaned event files. If a bin has >2000 counts, and if more than 50% of those come from <1% of pixels, then it is considered to be noise-dominated and hence unusable.
| Quadrant | # 1 sec bins | Bins with >0 counts | Bins with >2000 counts | High rate bins dominated by noise | Noise dominated (total time) | Noise dominated (detector-on time) | Marked lightcurve |
|---|---|---|---|---|---|---|---|
| A | 7046 | 5584 | 15 | 15 | 0.21% | 0.27% | 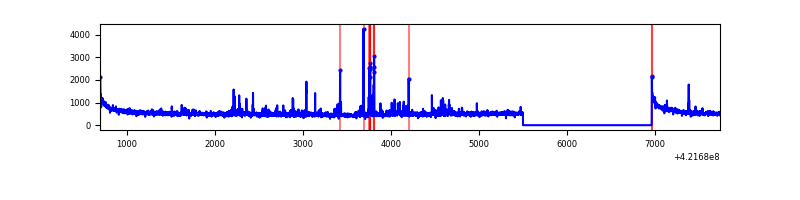 |
| B | 7046 | 5584 | 22 | 22 | 0.31% | 0.39% | 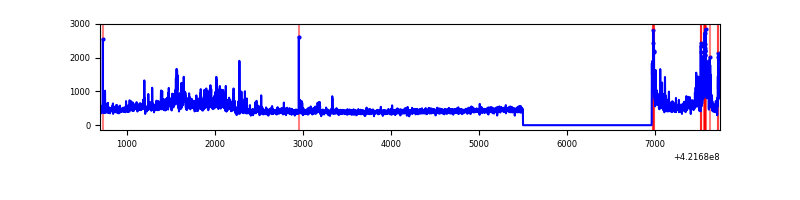 |
| C | 7046 | 5584 | 33 | 33 | 0.47% | 0.59% | 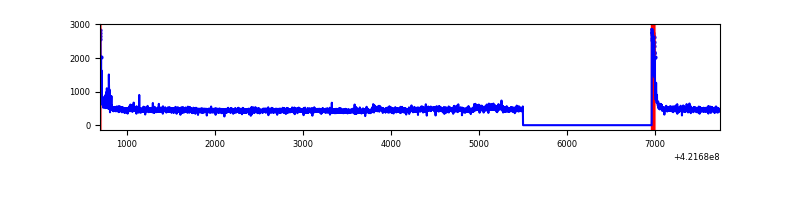 |
| D | 7046 | 5584 | 61 | 61 | 0.87% | 1.09% | 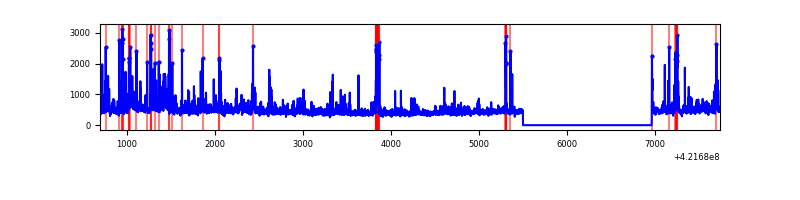 |
Top three noisy pixels from each quadrant. If the there are fewer than three noisy pixels in the level2.evt file, extra rows are filled as -1
| Pixel properties | Quadrant properties | ||||||
|---|---|---|---|---|---|---|---|
| Quadrant | DetID | PixID | Counts | Sigma | Mean | Median | Sigma |
| A | 10 | 83 | 551877 | 4549.09 | 588 | 575 | 121.2 |
| A | 0 | 8 | 130630 | 1073.15 | 588 | 575 | 121.2 |
| A | 7 | 3 | 60407 | 493.71 | 588 | 575 | 121.2 |
| B | 0 | 186 | 405541 | 3585.38 | 583 | 568 | 113.0 |
| B | 0 | 245 | 169785 | 1498.14 | 583 | 568 | 113.0 |
| B | 5 | 185 | 14334 | 121.88 | 583 | 568 | 113.0 |
| C | 15 | 214 | 240709 | 1818.32 | 572 | 574 | 132.1 |
| C | 0 | 10 | 119851 | 903.17 | 572 | 574 | 132.1 |
| C | 3 | 233 | 50509 | 378.11 | 572 | 574 | 132.1 |
| D | 5 | 222 | 247196 | 1773.78 | 572 | 555 | 139.0 |
| D | 2 | 249 | 201217 | 1443.11 | 572 | 555 | 139.0 |
| D | 13 | 249 | 112916 | 808.07 | 572 | 555 | 139.0 |
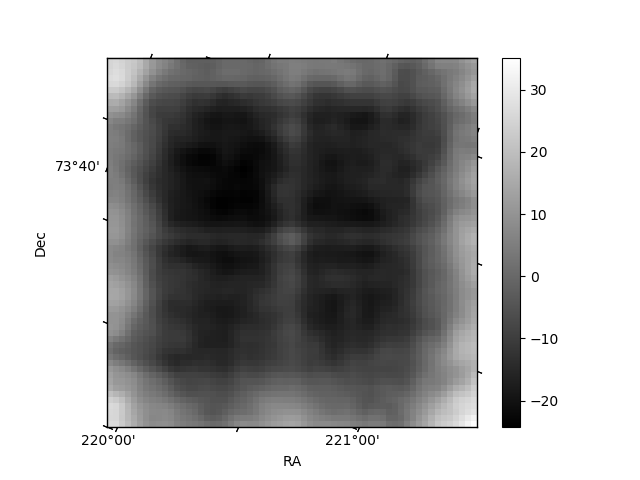
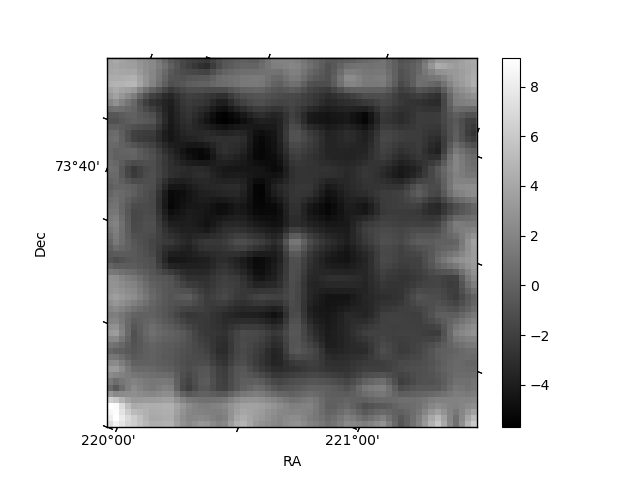
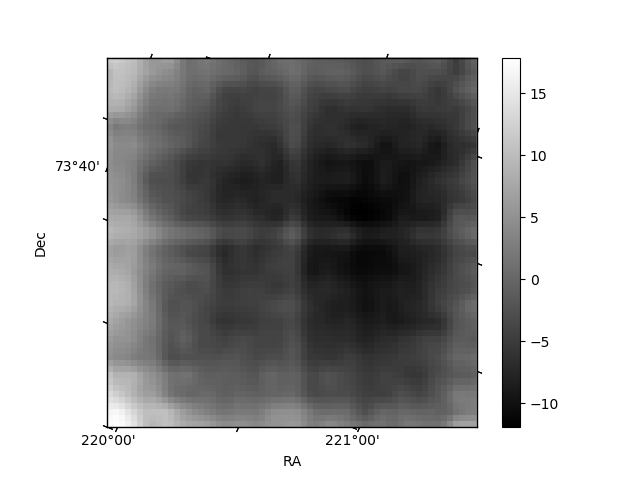
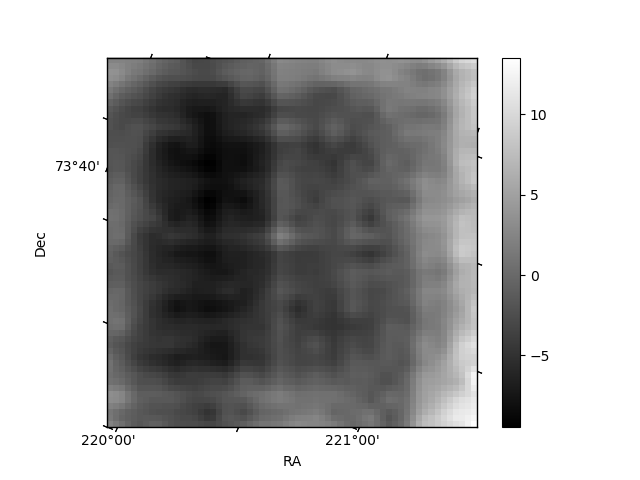
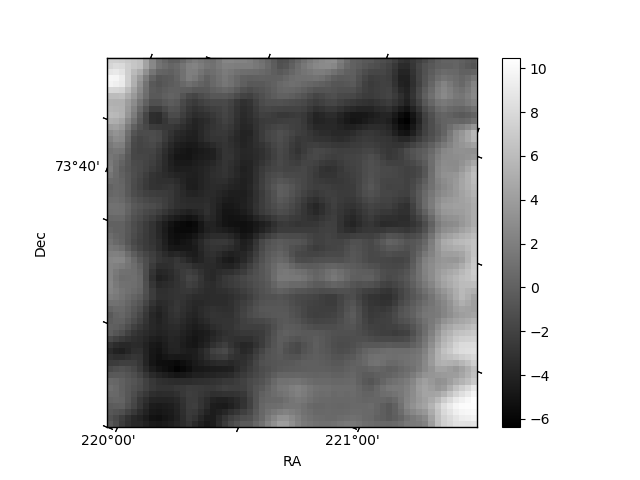
Histogram calculated using DETX and DETY for each event in the final _common_clean file
| Quadrant A | 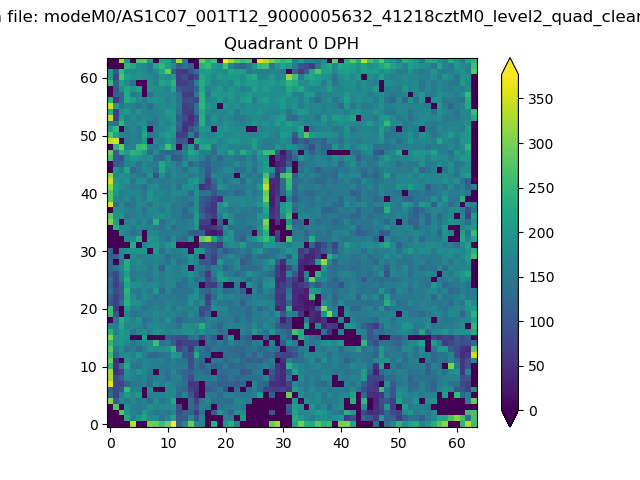 |
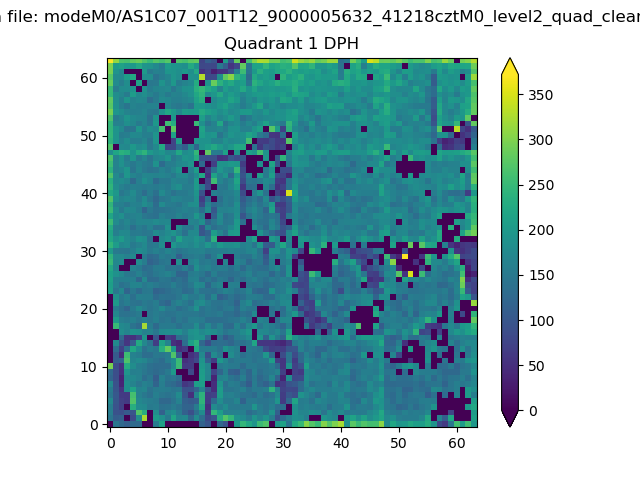 |
Quadrant B |
|---|---|---|---|
| Quadrant D | 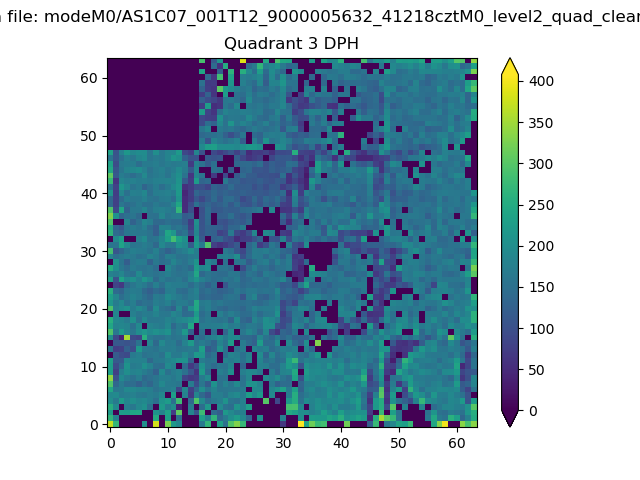 |
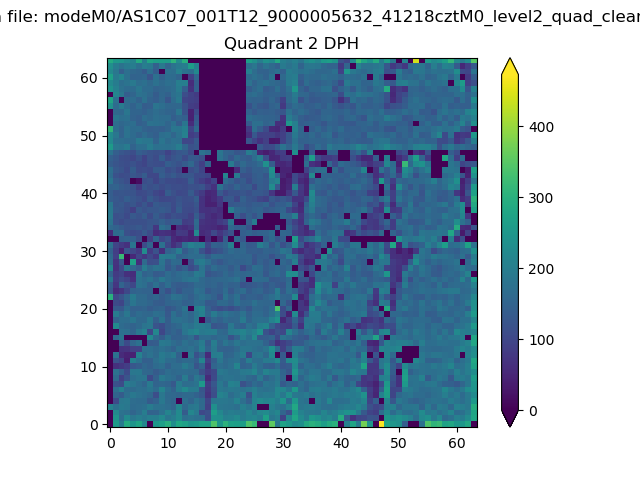 |
Quadrant C |
| Plot type | Count rate plots | Images |
|---|---|---|
| Comparison with Poisson distribution Blue bars denote a histogram of data divided into 1 sec bins. Red curve is a Poisson curve with rate = median count rate of data. |
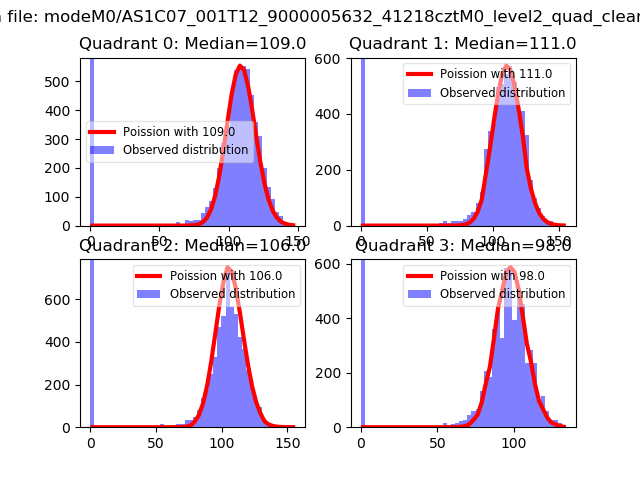 |
 |
| Quadrant-wise count rates Data is divided into 100 sec bins |
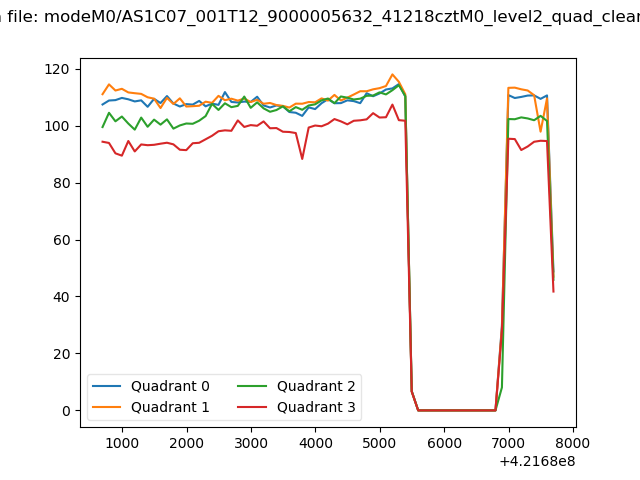 |
|
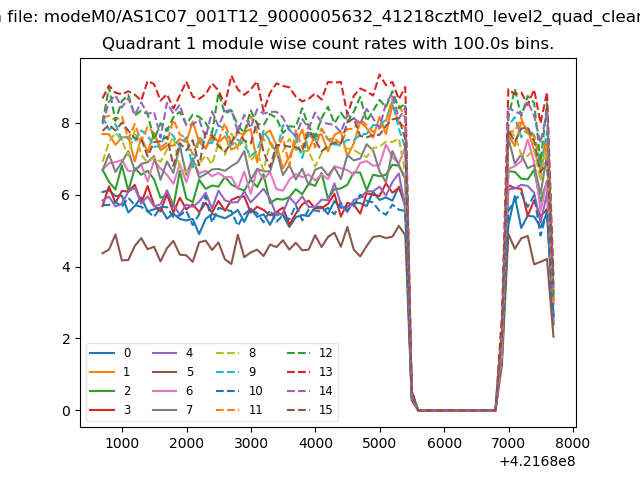
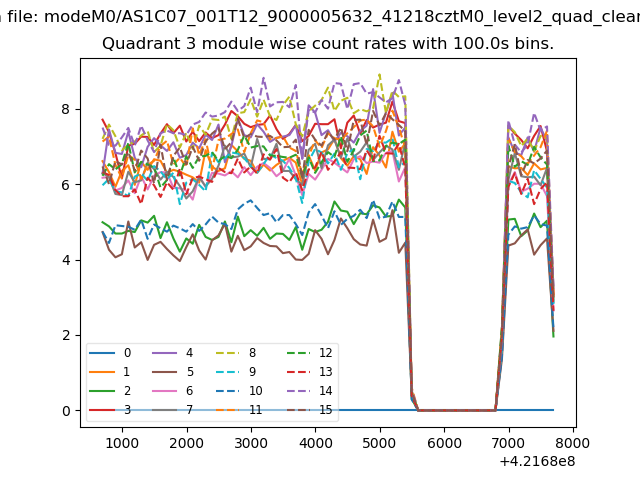
| Module-wise count rates for Quadrant A Data is divided into 100 sec bins |
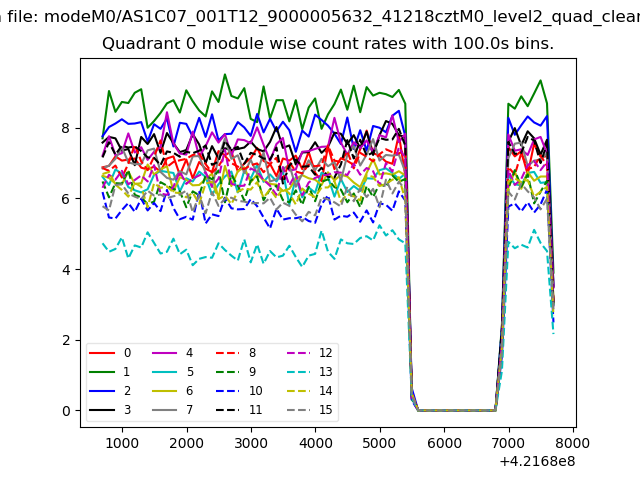 |
 |
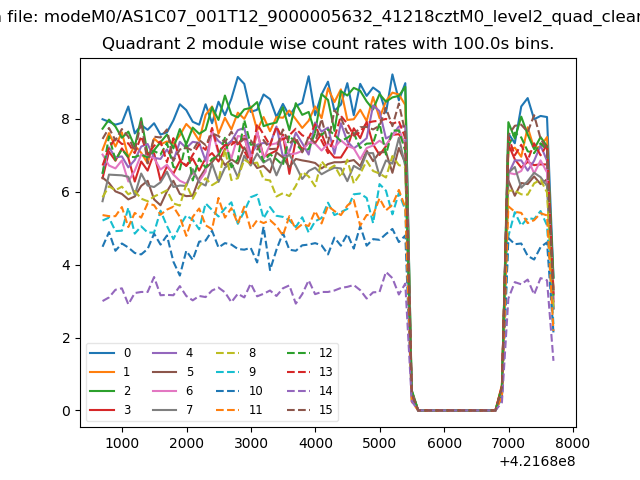
| Module-wise count rates for Quadrant B Data is divided into 100 sec bins |
 |
 |
| Module-wise count rates for Quadrant C Data is divided into 100 sec bins |
 |
 |
| Module-wise count rates for Quadrant D Data is divided into 100 sec bins |
 |
 |
| Parameter | Plot |
|---|---|
| CZT HV Monitor | 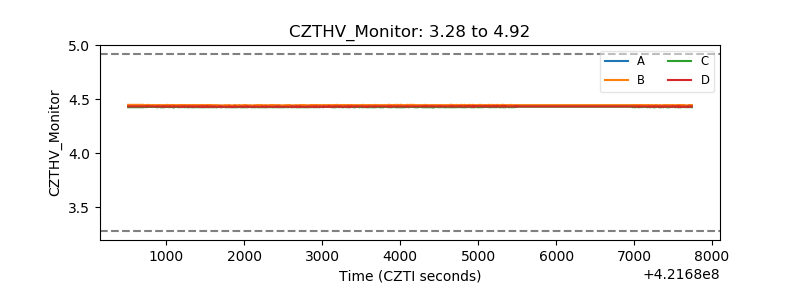 |
| D_VDD | 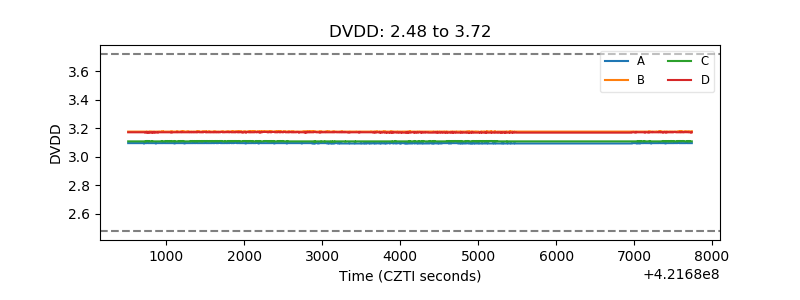 |
| Temperature 1 | 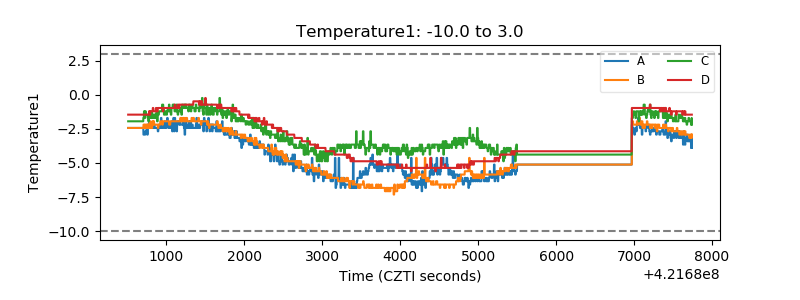 |
| Veto HV Monitor | 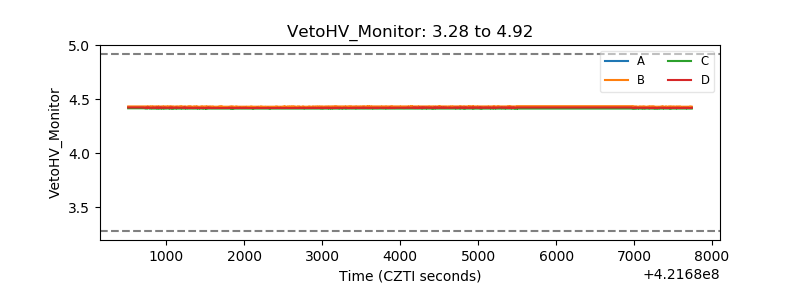 |
| Veto LLD | 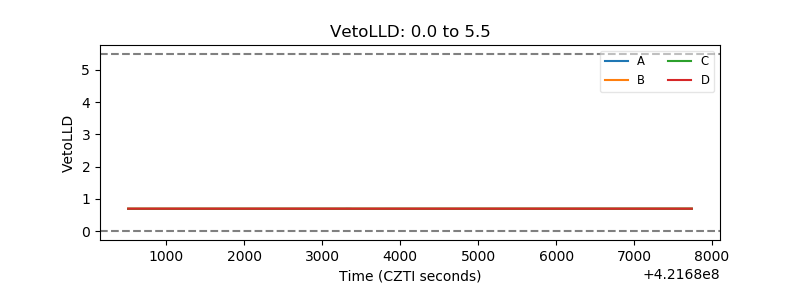 |
| Alpha Counter | 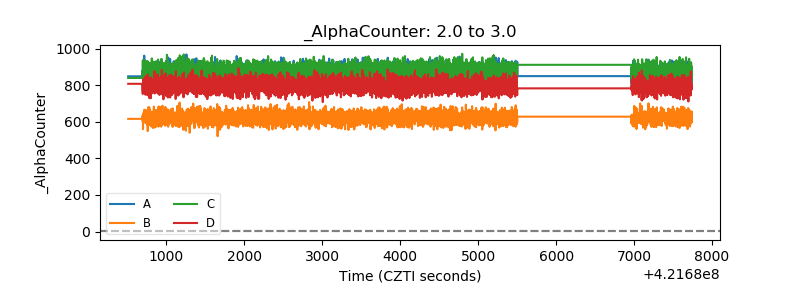 |
| _CPM_Rate | 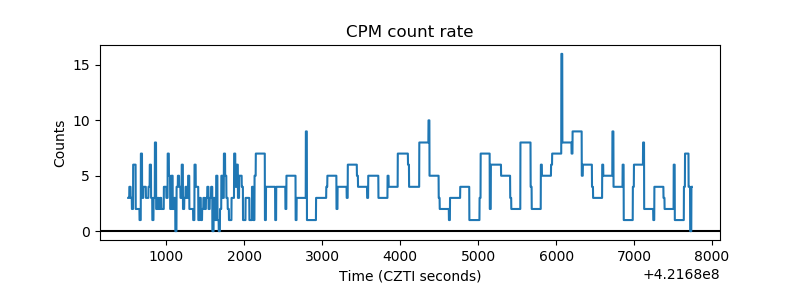 |
| CZT Counter | 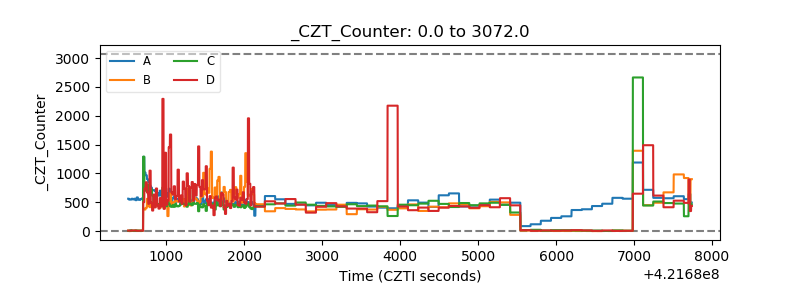 |
| +2.5 Volts monitor | 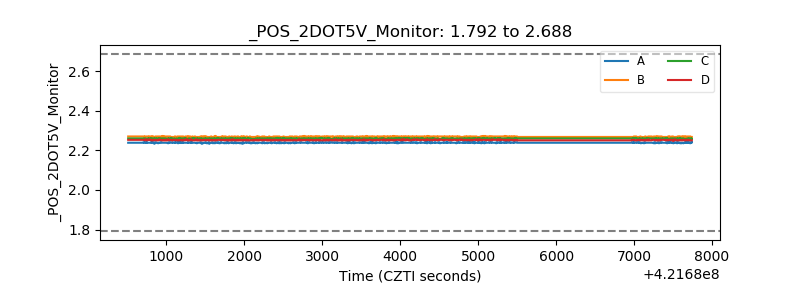 |
| +5 Volts monitor | 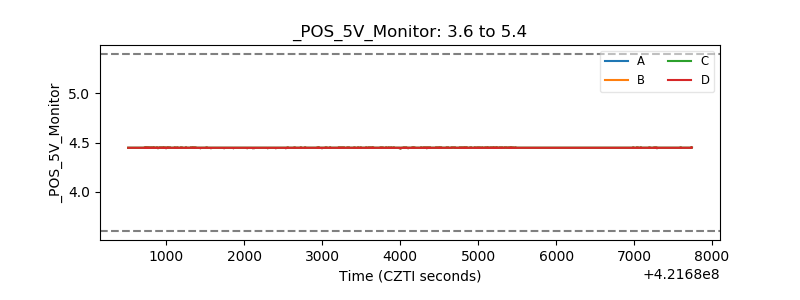 |
| _ROLL_ROT | 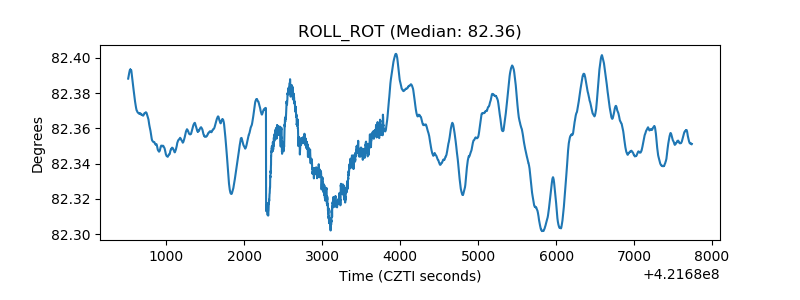 |
| _Roll_DEC | 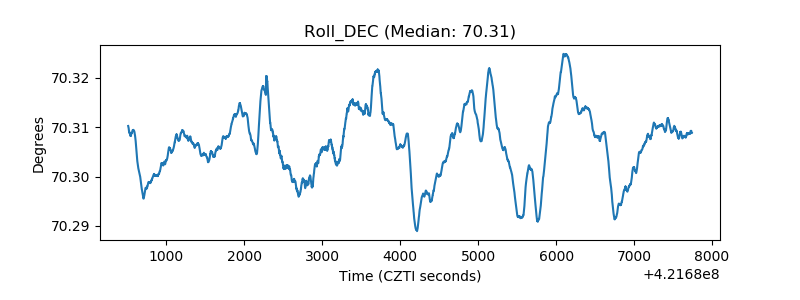 |
| _Roll_RA | 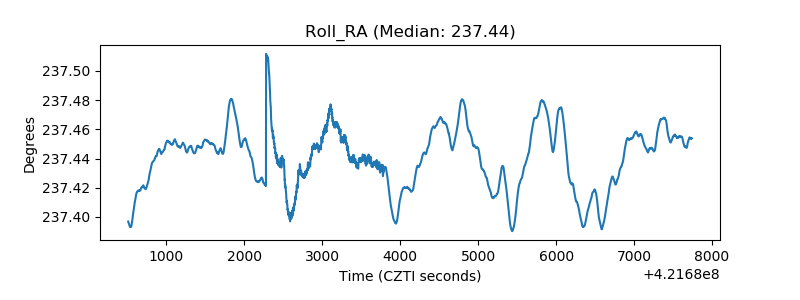 |
| Veto Counter | 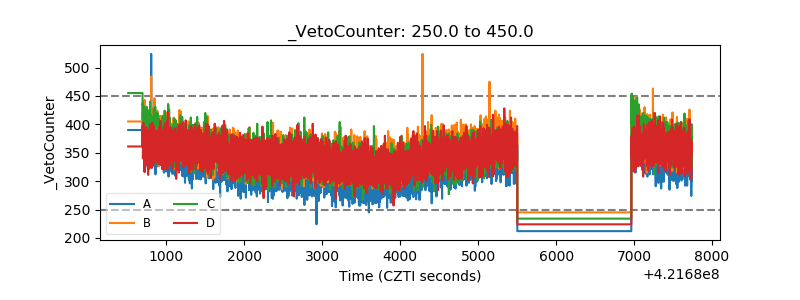 |