| Param | Original file | Final file |
|---|---|---|
| Filename | modeM0/AS1C07_001T12_9000005632_41219cztM0_level2.fits | modeM0/AS1C07_001T12_9000005632_41219cztM0_level2_quad_clean.evt |
| Size (bytes) | 358,125,120 | 92,122,560 |
| Size | 341.5 MB | 87.9 MB |
| Events in quadrant A | 3,054,858 | 624,092 |
| Events in quadrant B | 3,501,000 | 611,852 |
| Events in quadrant C | 2,795,097 | 602,213 |
| Events in quadrant D | 3,455,865 | 546,864 |
| Mode M0 | |||
|---|---|---|---|
| Quadrant | BADHDUFLAG | Total packets | Discarded packets |
| A | 0 | 12694 | 3 |
| B | 0 | 14802 | 2 |
| C | 0 | 12208 | 2 |
| D | 0 | 14390 | 2 |
| Mode M9 | |||
|---|---|---|---|
| Quadrant | BADHDUFLAG | Total packets | Discarded packets |
| A | 0 | 16 | 0 |
| B | 0 | 16 | 0 |
| C | 0 | 16 | 0 |
| D | 0 | 17 | 0 |
| Mode SS | |||
|---|---|---|---|
| Quadrant | BADHDUFLAG | Total packets | Discarded packets |
| A | 0 | 120 | 0 |
| B | 0 | 120 | 0 |
| C | 0 | 120 | 0 |
| D | 0 | 120 | 0 |
| Quadrant | Total seconds | Saturated seconds | Saturation percentage |
|---|---|---|---|
| A | 5776 | 21 | 0.363573% |
| B | 5776 | 257 | 4.449446% |
| C | 5776 | 61 | 1.056094% |
| D | 5776 | 211 | 3.653047% |
Noise dominated data is calculated using 1-second bins in cleaned event files. If a bin has >2000 counts, and if more than 50% of those come from <1% of pixels, then it is considered to be noise-dominated and hence unusable.
| Quadrant | # 1 sec bins | Bins with >0 counts | Bins with >2000 counts | High rate bins dominated by noise | Noise dominated (total time) | Noise dominated (detector-on time) | Marked lightcurve |
|---|---|---|---|---|---|---|---|
| A | 7058 | 5777 | 8 | 8 | 0.11% | 0.14% | 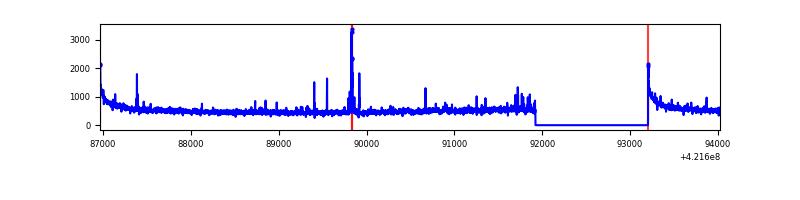 |
| B | 7058 | 5777 | 188 | 188 | 2.66% | 3.25% | 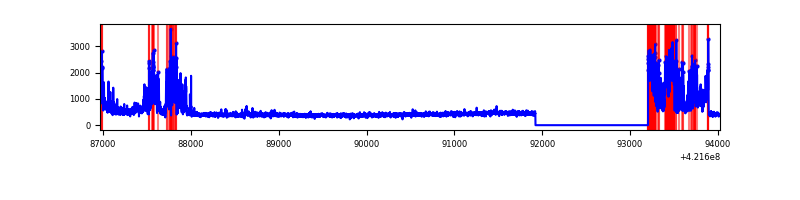 |
| C | 7058 | 5777 | 60 | 60 | 0.85% | 1.04% | 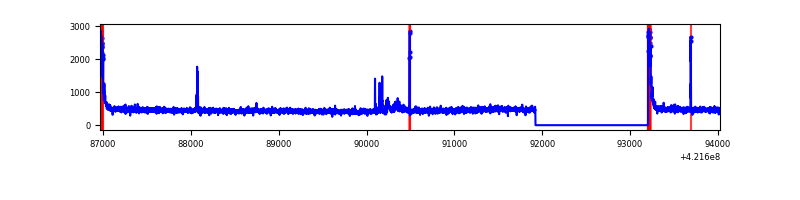 |
| D | 7058 | 5777 | 199 | 199 | 2.82% | 3.44% | 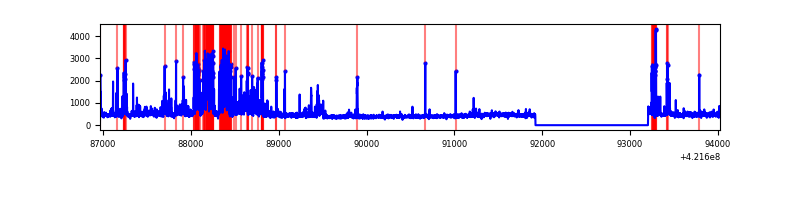 |
Top three noisy pixels from each quadrant. If the there are fewer than three noisy pixels in the level2.evt file, extra rows are filled as -1
| Pixel properties | Quadrant properties | ||||||
|---|---|---|---|---|---|---|---|
| Quadrant | DetID | PixID | Counts | Sigma | Mean | Median | Sigma |
| A | 10 | 83 | 563524 | 4501.42 | 609 | 595 | 125.1 |
| A | 0 | 8 | 97361 | 773.78 | 609 | 595 | 125.1 |
| A | 13 | 248 | 16334 | 125.86 | 609 | 595 | 125.1 |
| B | 0 | 186 | 1050429 | 9038.15 | 596 | 577 | 116.2 |
| B | 0 | 245 | 85753 | 733.28 | 596 | 577 | 116.2 |
| B | 12 | 111 | 14593 | 120.66 | 596 | 577 | 116.2 |
| C | 15 | 214 | 246478 | 1776.12 | 591 | 594 | 138.4 |
| C | 0 | 10 | 175338 | 1262.25 | 591 | 594 | 138.4 |
| C | 9 | 54 | 59808 | 427.73 | 591 | 594 | 138.4 |
| D | 2 | 249 | 577950 | 4018.66 | 588 | 571 | 143.7 |
| D | 13 | 249 | 178523 | 1238.58 | 588 | 571 | 143.7 |
| D | 1 | 47 | 133329 | 924.02 | 588 | 571 | 143.7 |
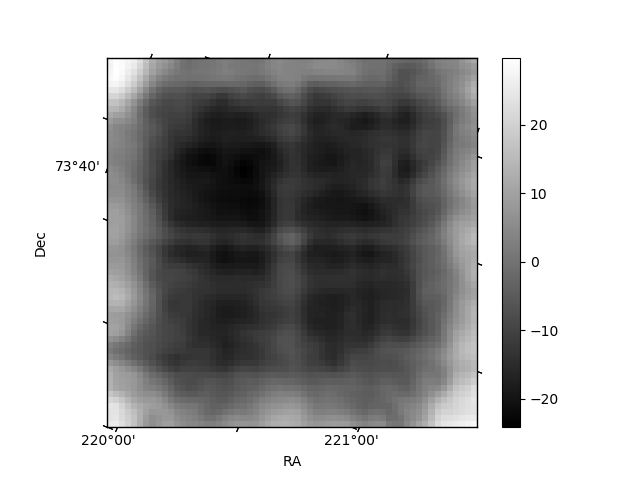
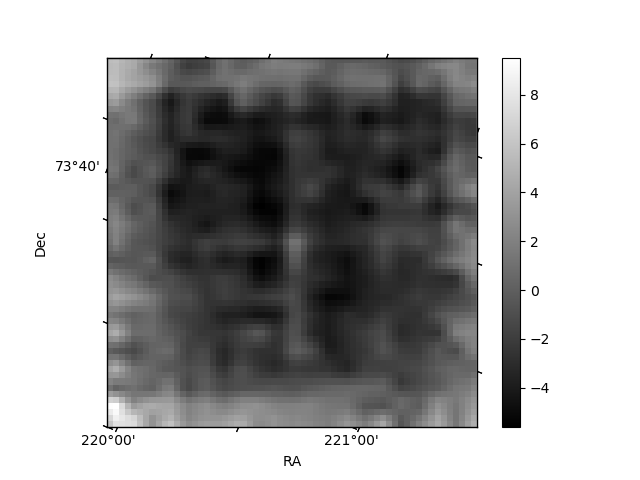
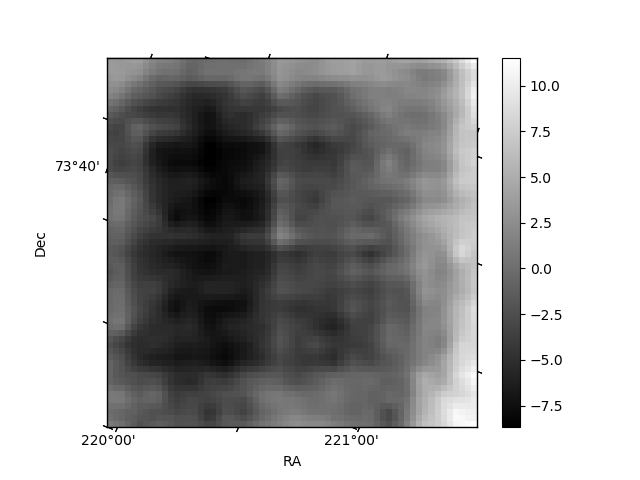
Histogram calculated using DETX and DETY for each event in the final _common_clean file
| Quadrant A | 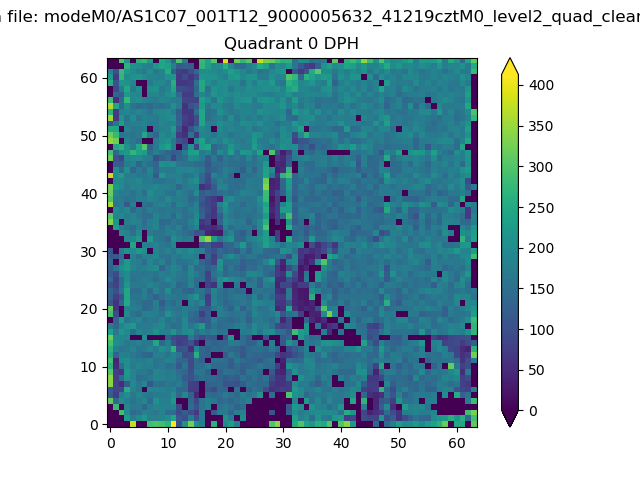 |
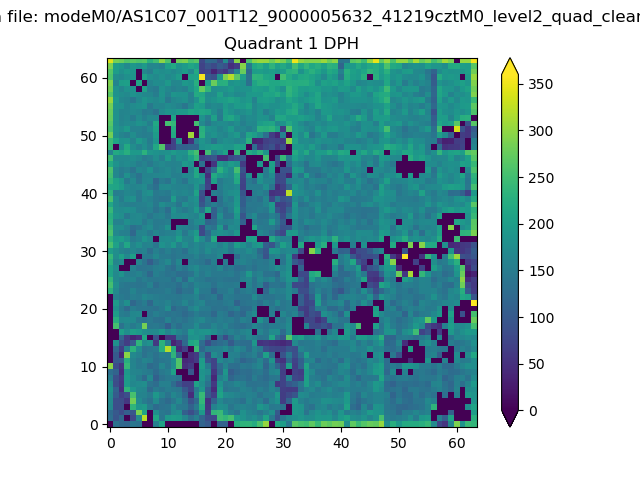 |
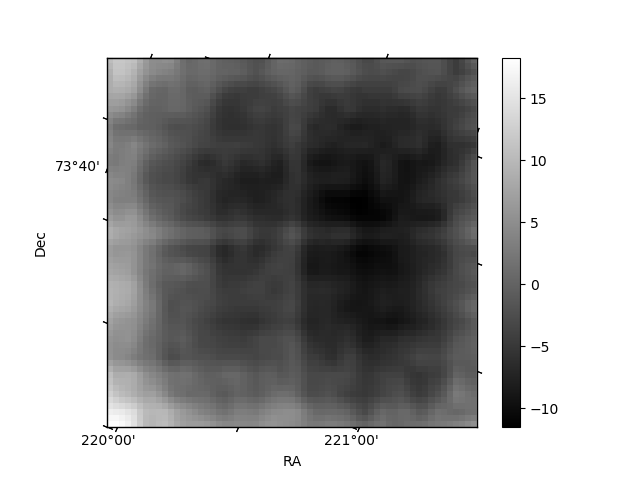
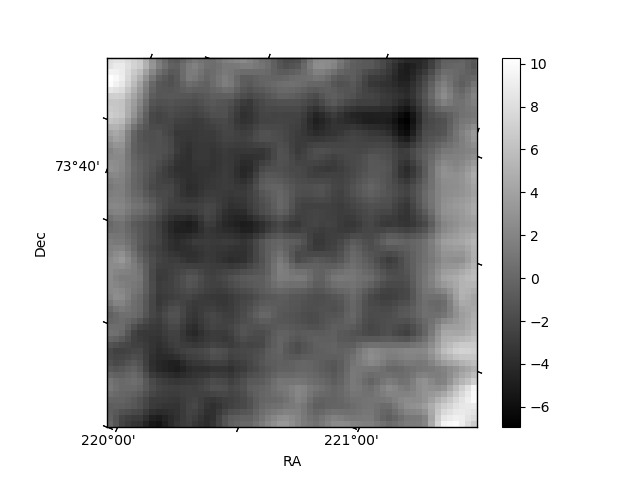
Quadrant B |
|---|---|---|---|
| Quadrant D | 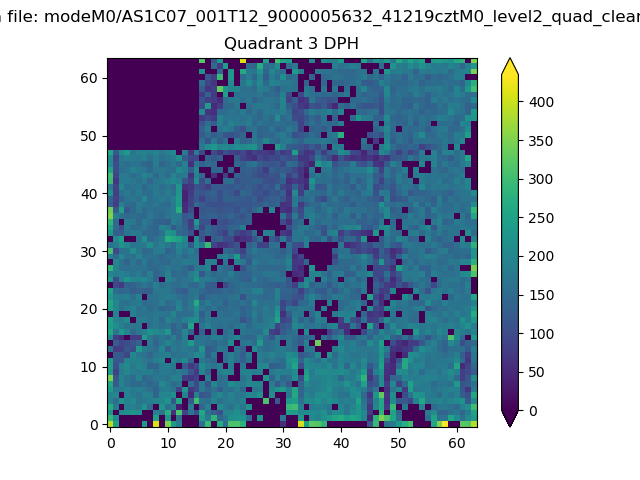 |
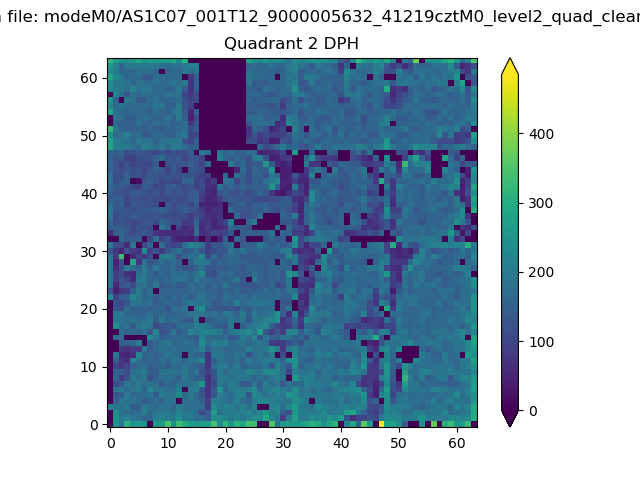 |
Quadrant C |
| Plot type | Count rate plots | Images |
|---|---|---|
| Comparison with Poisson distribution Blue bars denote a histogram of data divided into 1 sec bins. Red curve is a Poisson curve with rate = median count rate of data. |
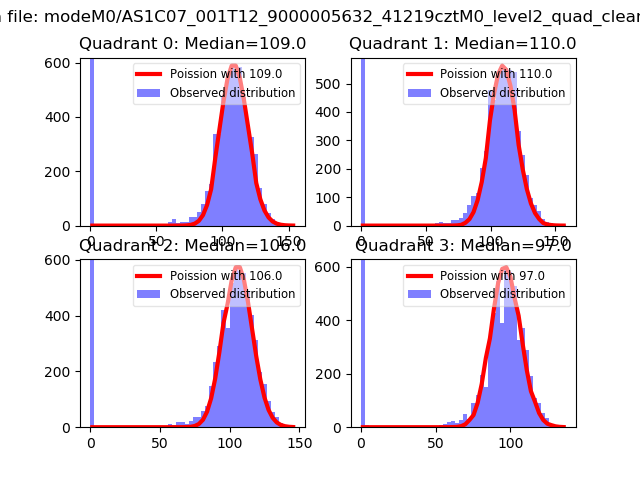 |
 |
| Quadrant-wise count rates Data is divided into 100 sec bins |
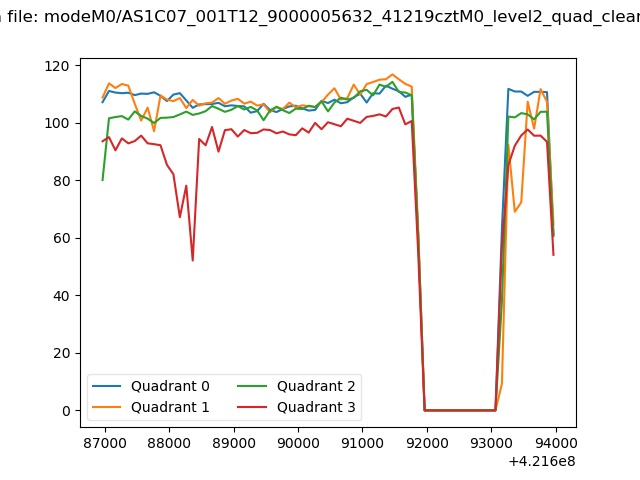 |
|
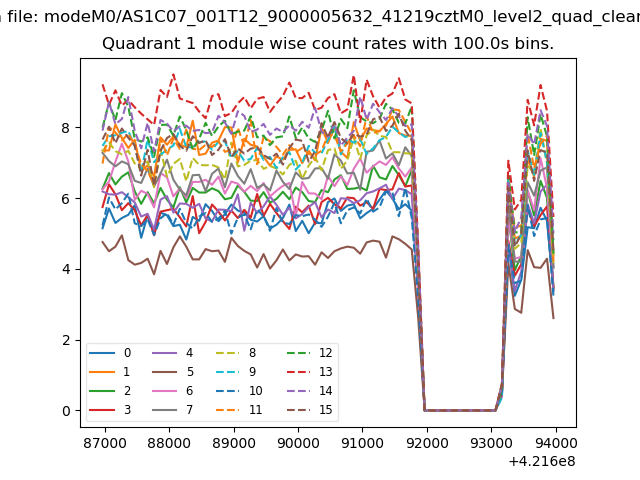
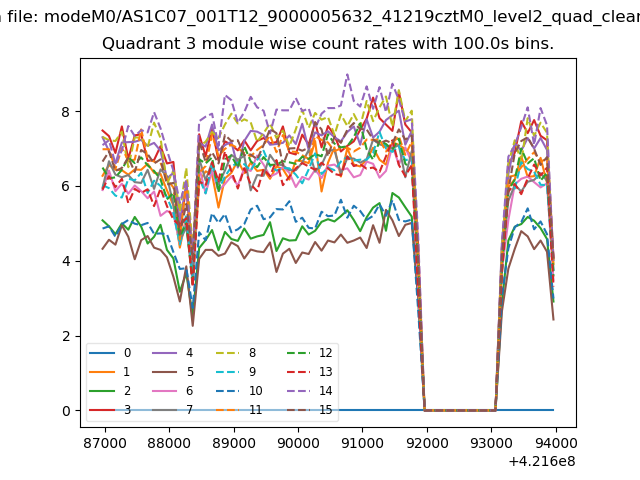
| Module-wise count rates for Quadrant A Data is divided into 100 sec bins |
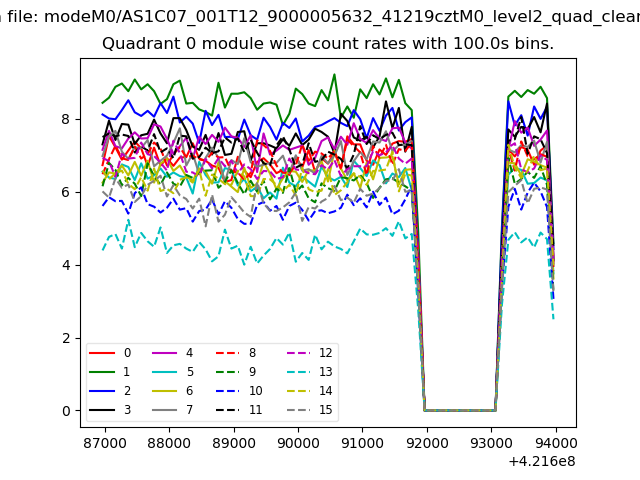 |
 |
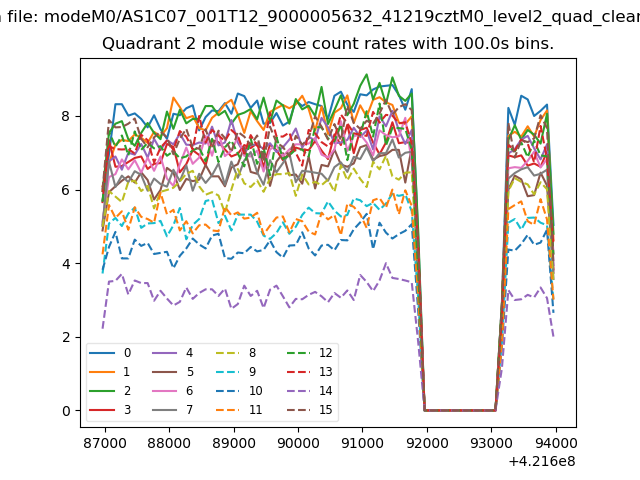
| Module-wise count rates for Quadrant B Data is divided into 100 sec bins |
 |
 |
| Module-wise count rates for Quadrant C Data is divided into 100 sec bins |
 |
 |
| Module-wise count rates for Quadrant D Data is divided into 100 sec bins |
 |
 |
| Parameter | Plot |
|---|---|
| CZT HV Monitor | 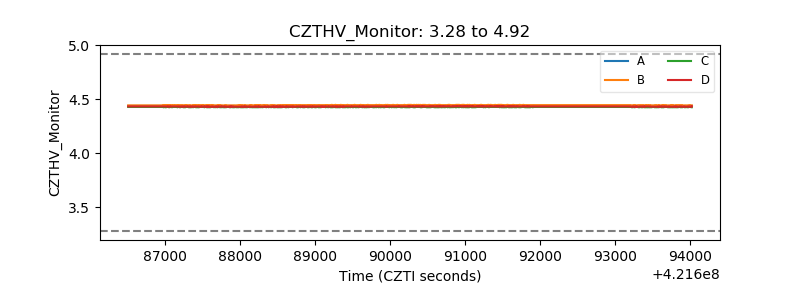 |
| D_VDD | 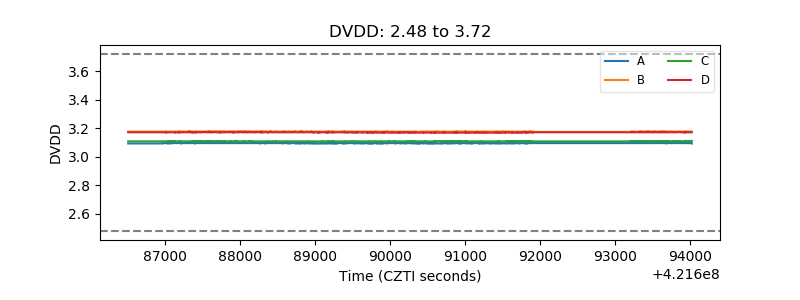 |
| Temperature 1 | 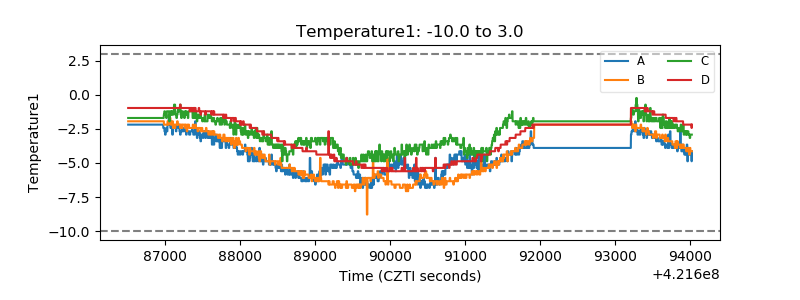 |
| Veto HV Monitor | 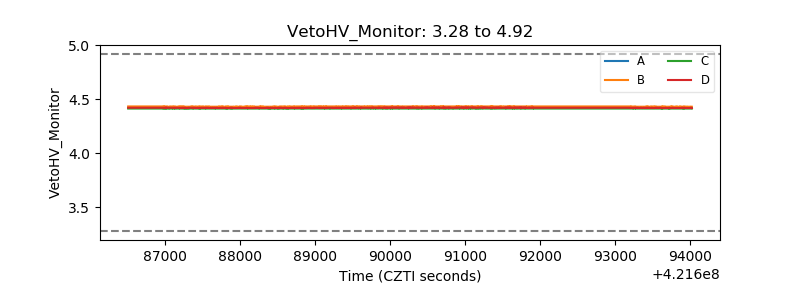 |
| Veto LLD | 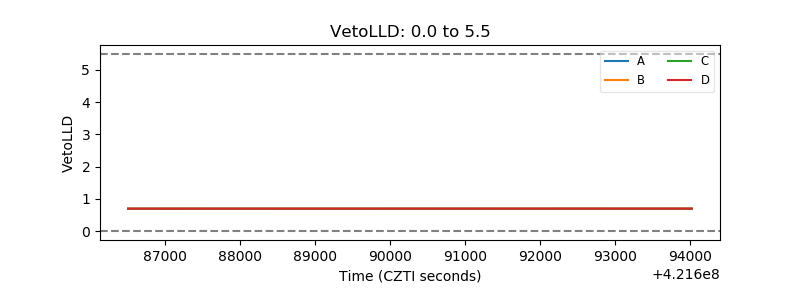 |
| Alpha Counter | 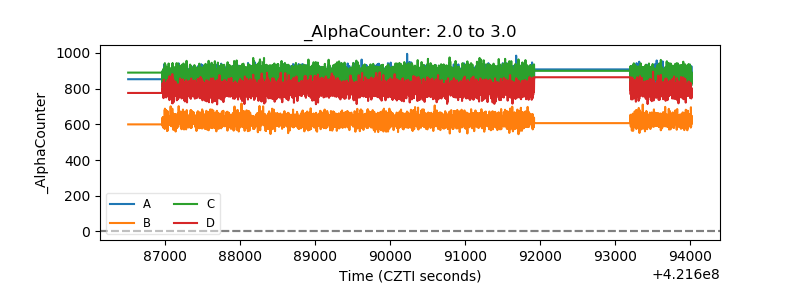 |
| _CPM_Rate | 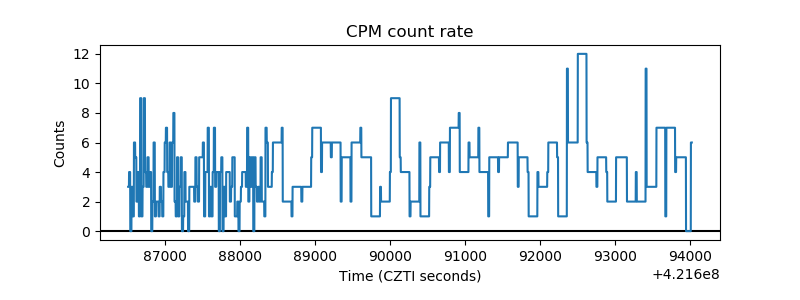 |
| CZT Counter | 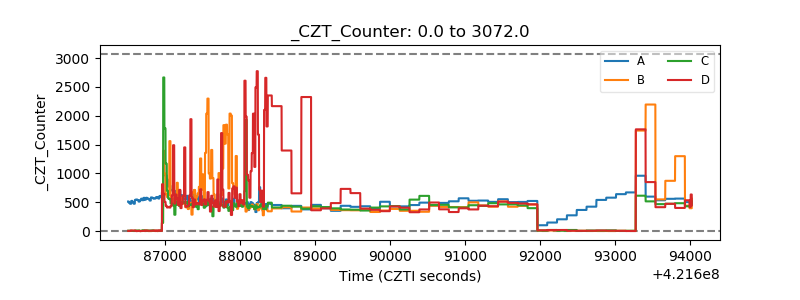 |
| +2.5 Volts monitor | 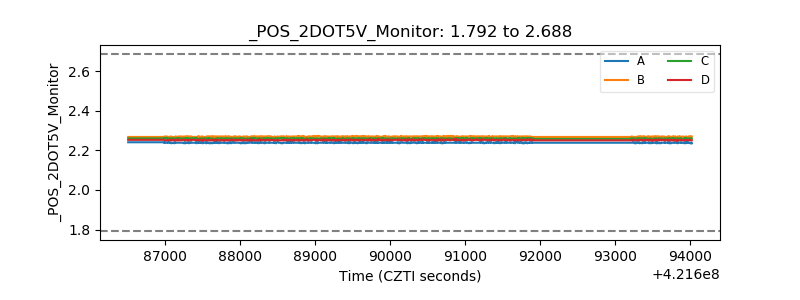 |
| +5 Volts monitor | 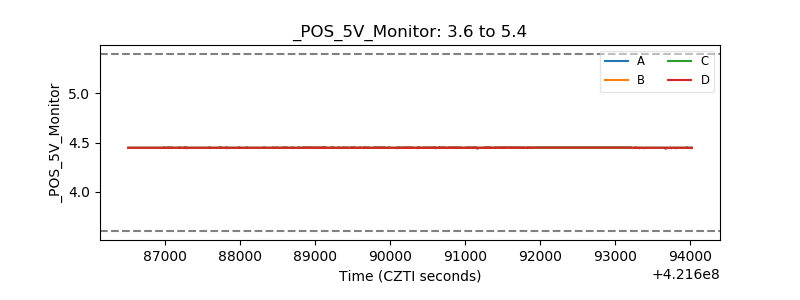 |
| _ROLL_ROT | 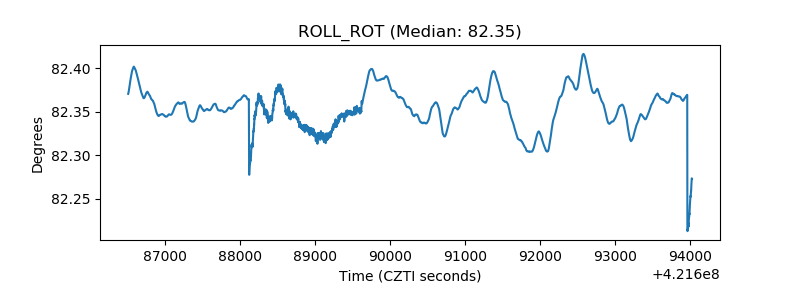 |
| _Roll_DEC | 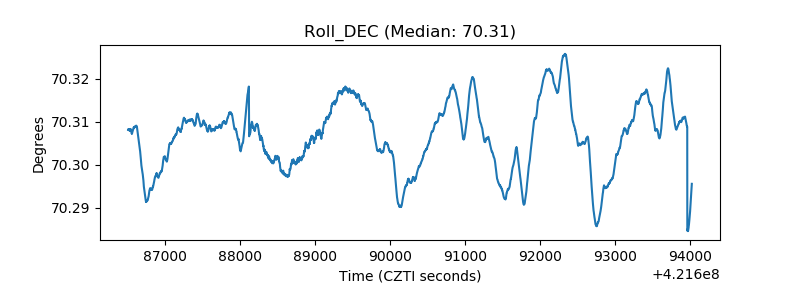 |
| _Roll_RA | 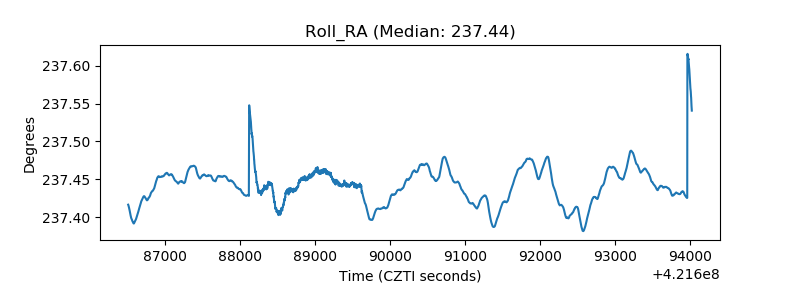 |
| Veto Counter | 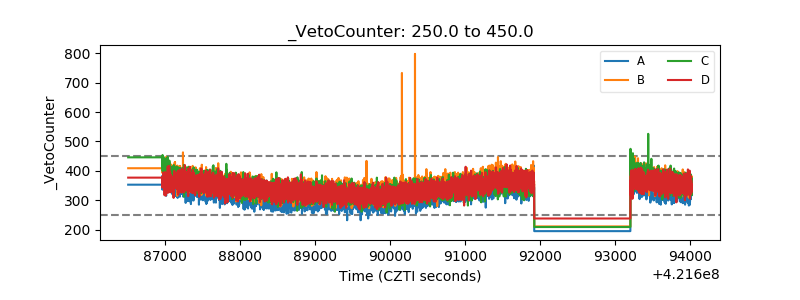 |