| Param | Original file | Final file |
|---|---|---|
| Filename | modeM0/AS1C07_001T12_9000005632_41222cztM0_level2.fits | modeM0/AS1C07_001T12_9000005632_41222cztM0_level2_quad_clean.evt |
| Size (bytes) | 948,061,440 | 246,110,400 |
| Size | 904.1 MB | 234.7 MB |
| Events in quadrant A | 8,701,780 | 1,635,684 |
| Events in quadrant B | 8,672,309 | 1,640,916 |
| Events in quadrant C | 7,379,326 | 1,615,713 |
| Events in quadrant D | 9,131,528 | 1,482,697 |
| Mode M0 | |||
|---|---|---|---|
| Quadrant | BADHDUFLAG | Total packets | Discarded packets |
| A | 0 | 35957 | 5 |
| B | 0 | 37492 | 4 |
| C | 0 | 32633 | 4 |
| D | 0 | 38670 | 4 |
| Mode M9 | |||
|---|---|---|---|
| Quadrant | BADHDUFLAG | Total packets | Discarded packets |
| A | 0 | 49 | 0 |
| B | 0 | 49 | 0 |
| C | 0 | 49 | 0 |
| D | 0 | 50 | 0 |
| Mode SS | |||
|---|---|---|---|
| Quadrant | BADHDUFLAG | Total packets | Discarded packets |
| A | 0 | 318 | 0 |
| B | 0 | 318 | 0 |
| C | 0 | 318 | 0 |
| D | 0 | 318 | 0 |
| Quadrant | Total seconds | Saturated seconds | Saturation percentage |
|---|---|---|---|
| A | 15603 | 181 | 1.160033% |
| B | 15603 | 523 | 3.351920% |
| C | 15603 | 160 | 1.025444% |
| D | 15603 | 418 | 2.678972% |
Noise dominated data is calculated using 1-second bins in cleaned event files. If a bin has >2000 counts, and if more than 50% of those come from <1% of pixels, then it is considered to be noise-dominated and hence unusable.
| Quadrant | # 1 sec bins | Bins with >0 counts | Bins with >2000 counts | High rate bins dominated by noise | Noise dominated (total time) | Noise dominated (detector-on time) | Marked lightcurve |
|---|---|---|---|---|---|---|---|
| A | 19781 | 15606 | 137 | 137 | 0.69% | 0.88% | 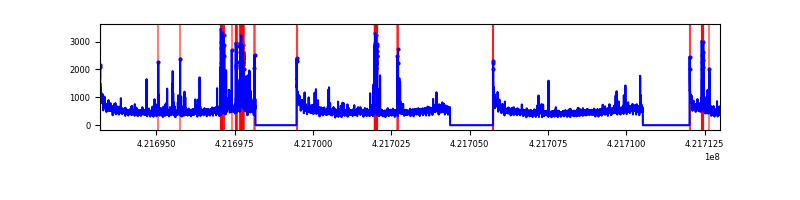 |
| B | 19781 | 15605 | 402 | 402 | 2.03% | 2.58% | 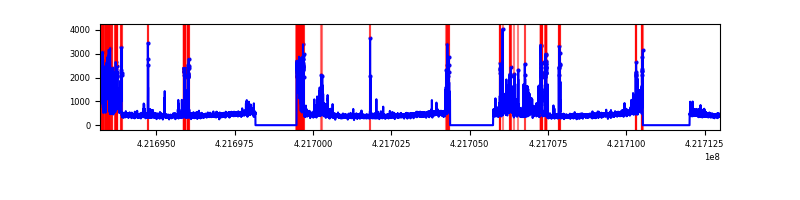 |
| C | 19781 | 15606 | 148 | 148 | 0.75% | 0.95% | 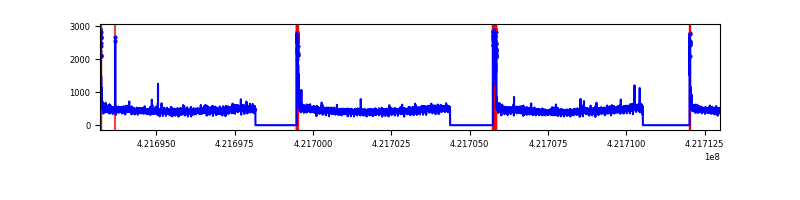 |
| D | 19781 | 15606 | 416 | 416 | 2.10% | 2.67% | 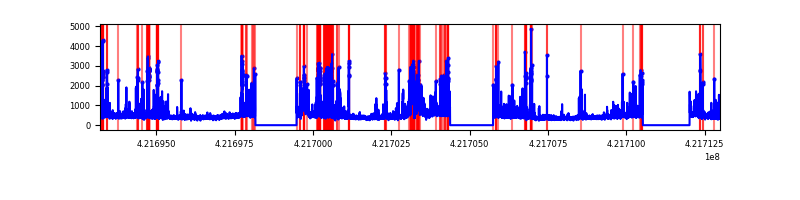 |
Top three noisy pixels from each quadrant. If the there are fewer than three noisy pixels in the level2.evt file, extra rows are filled as -1
| Pixel properties | Quadrant properties | ||||||
|---|---|---|---|---|---|---|---|
| Quadrant | DetID | PixID | Counts | Sigma | Mean | Median | Sigma |
| A | 10 | 83 | 1336243 | 4042.97 | 1626 | 1588 | 330.1 |
| A | 0 | 8 | 825140 | 2494.73 | 1626 | 1588 | 330.1 |
| A | 2 | 79 | 174792 | 524.67 | 1626 | 1588 | 330.1 |
| B | 0 | 186 | 1147260 | 3731.09 | 1604 | 1559 | 307.1 |
| B | 0 | 229 | 801472 | 2605.0 | 1604 | 1559 | 307.1 |
| B | 5 | 255 | 152744 | 492.35 | 1604 | 1559 | 307.1 |
| C | 15 | 214 | 651724 | 1768.05 | 1593 | 1604 | 367.7 |
| C | 0 | 10 | 453516 | 1229.01 | 1593 | 1604 | 367.7 |
| C | 9 | 54 | 42295 | 110.66 | 1593 | 1604 | 367.7 |
| D | 13 | 249 | 1037553 | 2706.64 | 1583 | 1537 | 382.8 |
| D | 2 | 120 | 840345 | 2191.43 | 1583 | 1537 | 382.8 |
| D | 2 | 249 | 276879 | 719.34 | 1583 | 1537 | 382.8 |
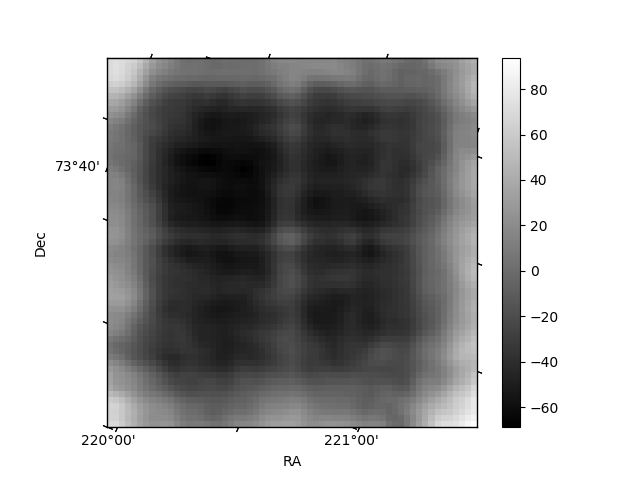
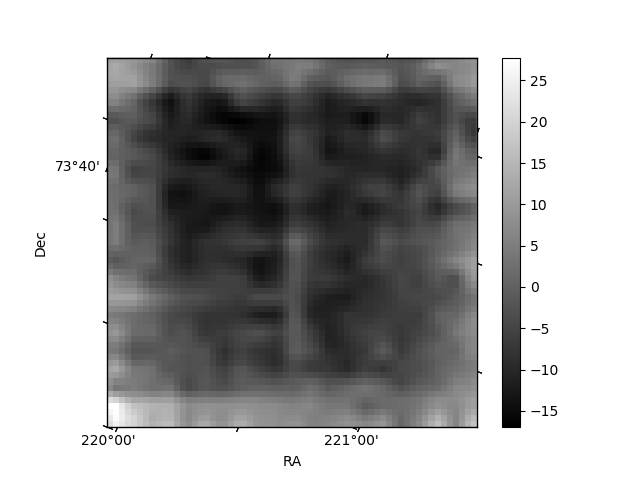
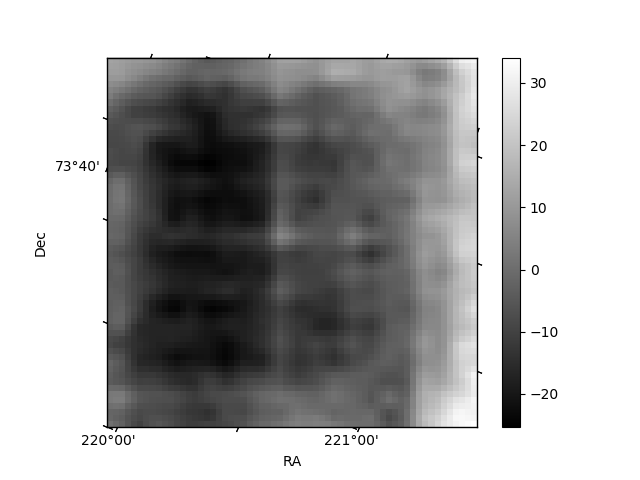
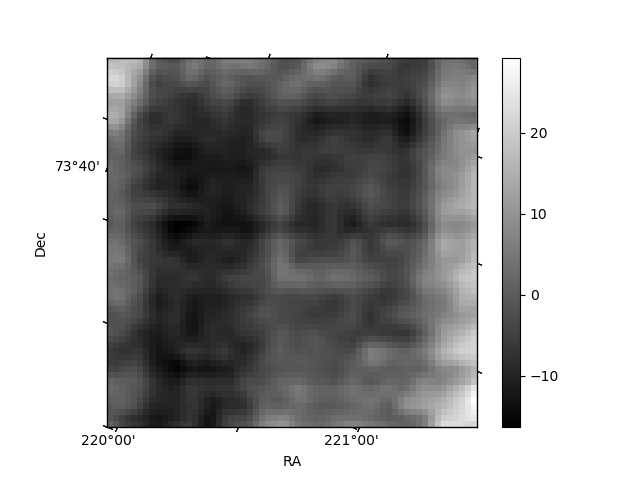
Histogram calculated using DETX and DETY for each event in the final _common_clean file
| Quadrant A | 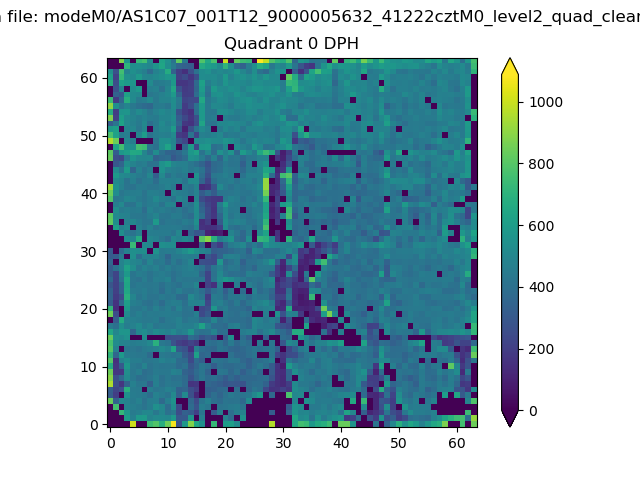 |
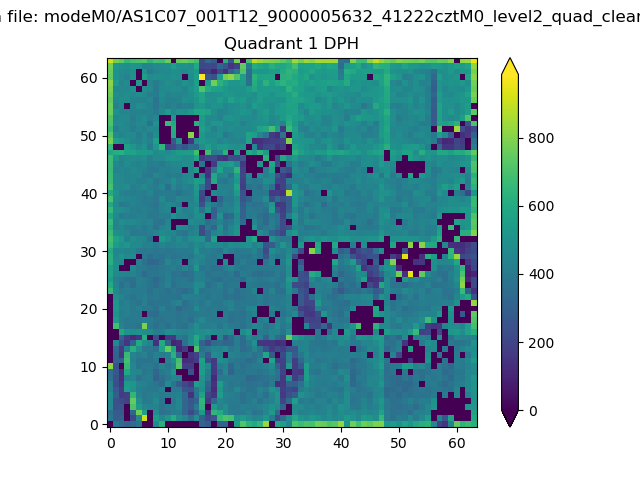 |
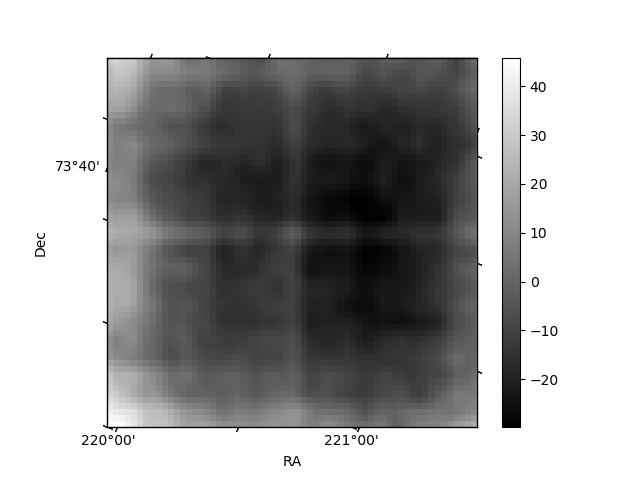
Quadrant B |
|---|---|---|---|
| Quadrant D | 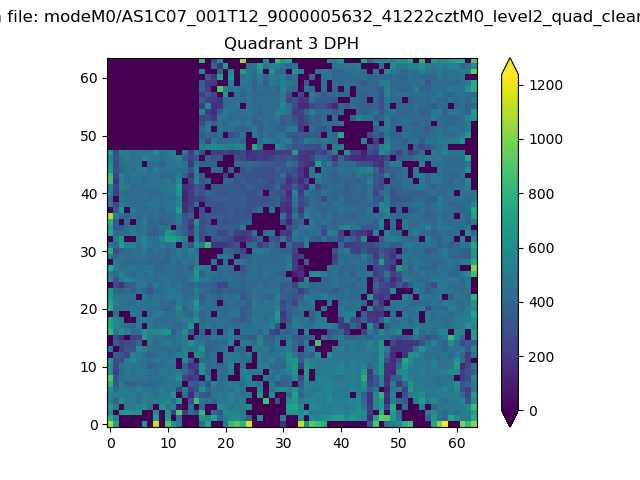 |
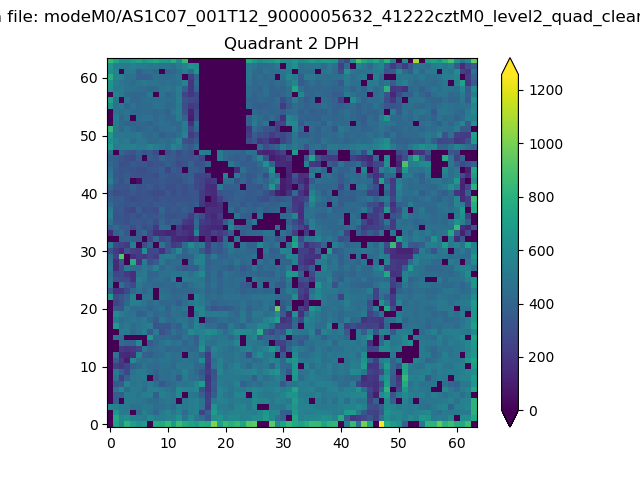 |
Quadrant C |
| Plot type | Count rate plots | Images |
|---|---|---|
| Comparison with Poisson distribution Blue bars denote a histogram of data divided into 1 sec bins. Red curve is a Poisson curve with rate = median count rate of data. |
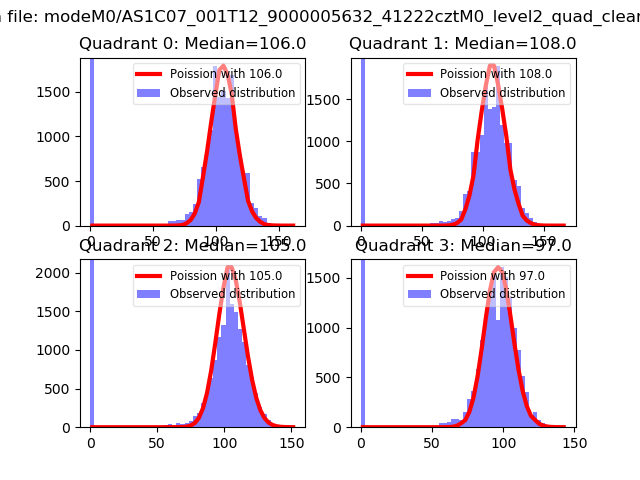 |
 |
| Quadrant-wise count rates Data is divided into 100 sec bins |
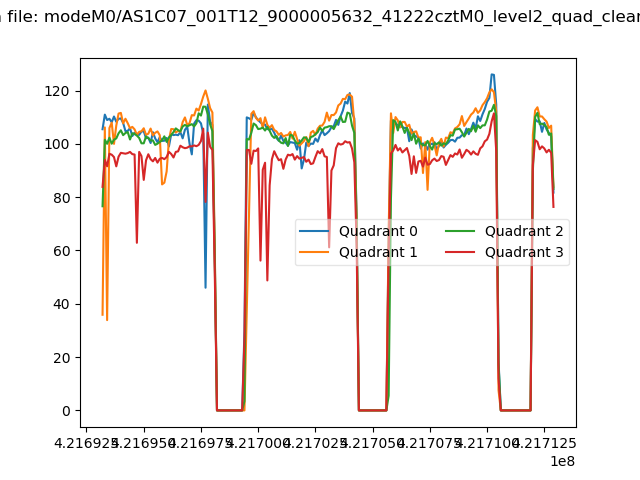 |
|
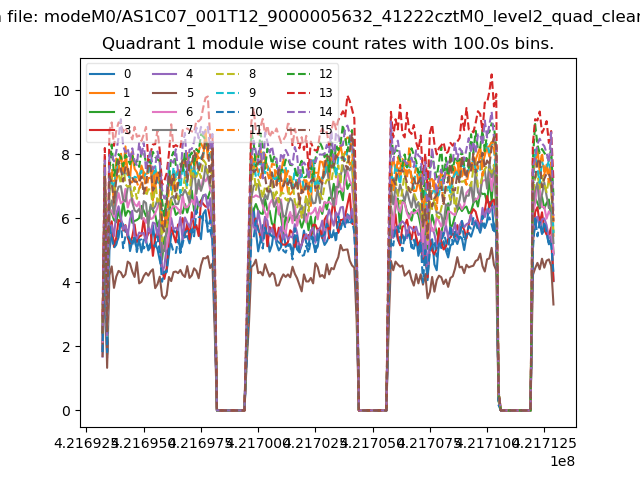
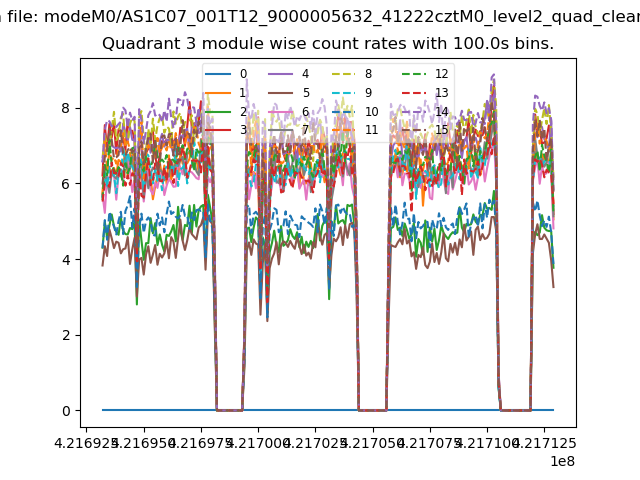
| Module-wise count rates for Quadrant A Data is divided into 100 sec bins |
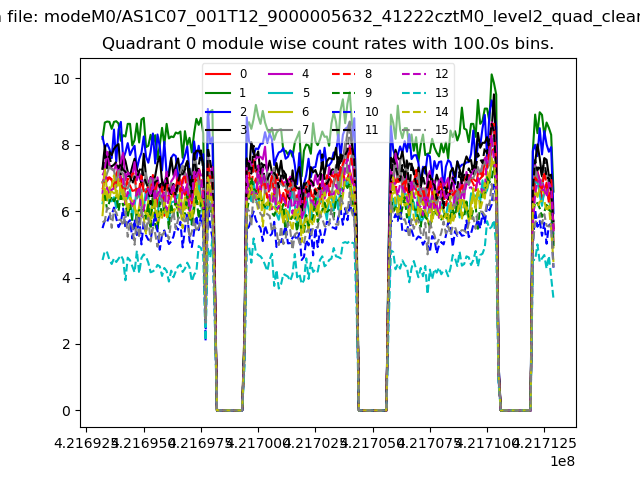 |
 |
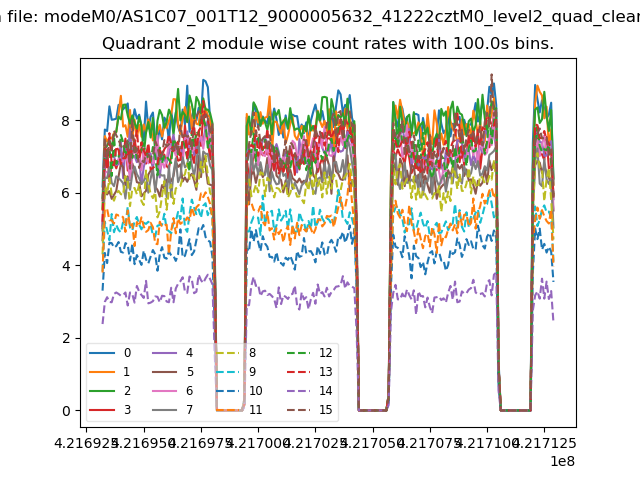
| Module-wise count rates for Quadrant B Data is divided into 100 sec bins |
 |
 |
| Module-wise count rates for Quadrant C Data is divided into 100 sec bins |
 |
 |
| Module-wise count rates for Quadrant D Data is divided into 100 sec bins |
 |
 |
| Parameter | Plot |
|---|---|
| CZT HV Monitor | 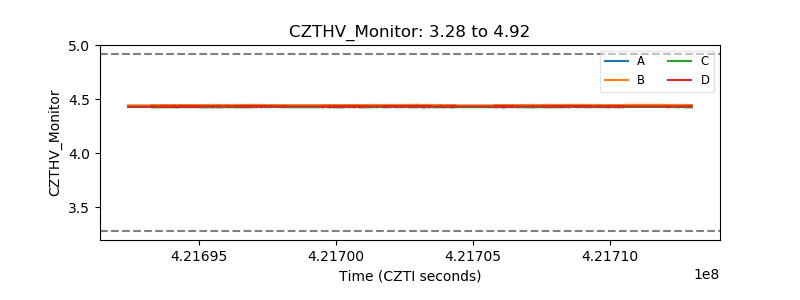 |
| D_VDD | 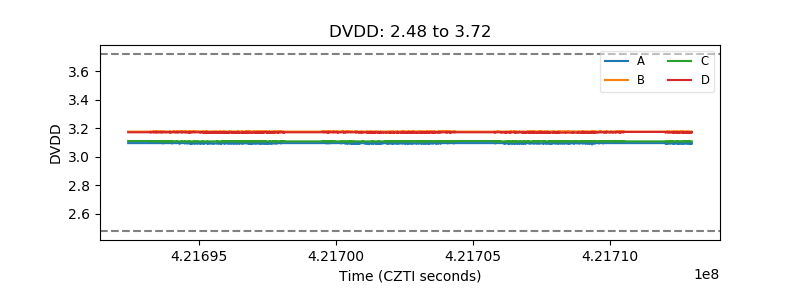 |
| Temperature 1 | 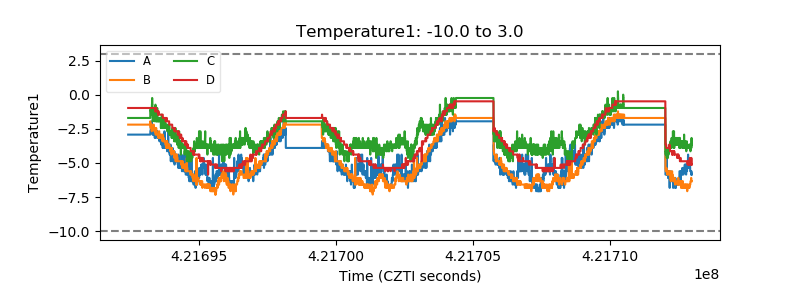 |
| Veto HV Monitor | 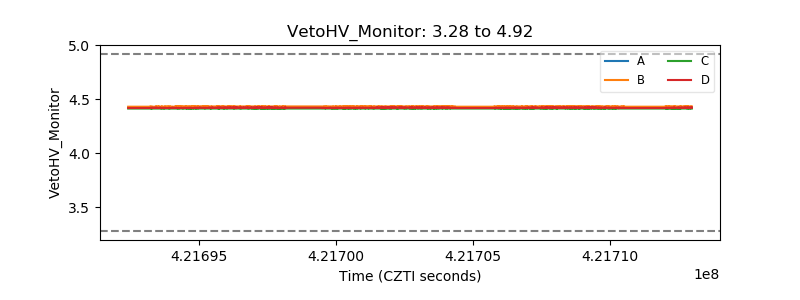 |
| Veto LLD | 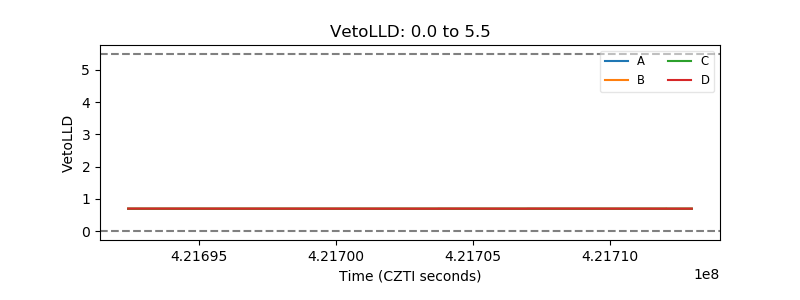 |
| Alpha Counter | 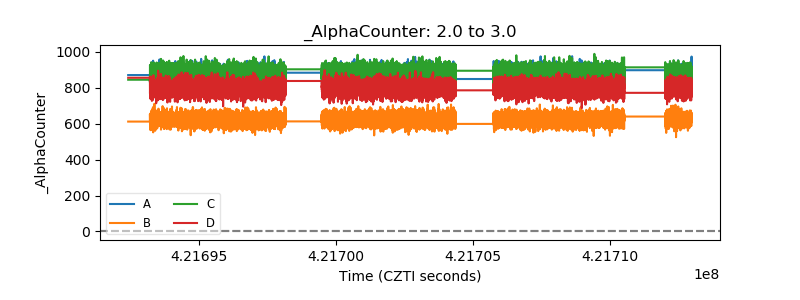 |
| _CPM_Rate | 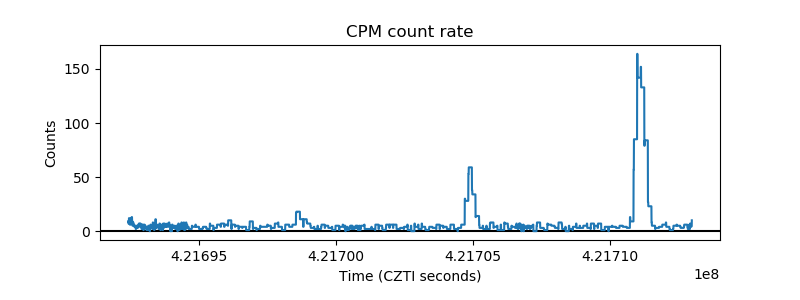 |
| CZT Counter | 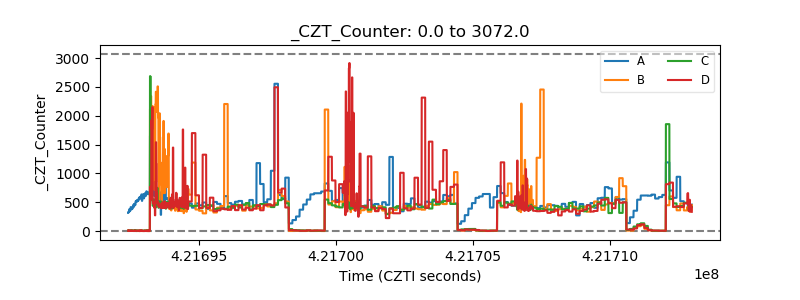 |
| +2.5 Volts monitor | 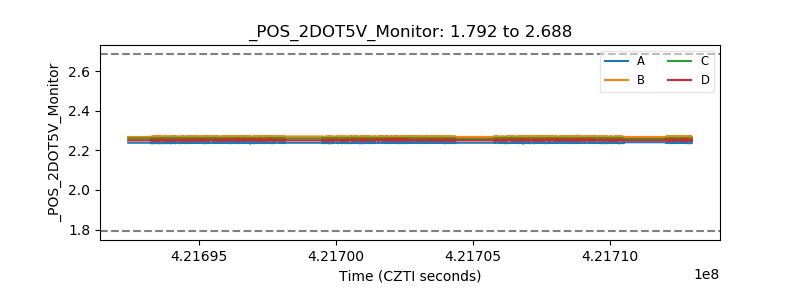 |
| +5 Volts monitor | 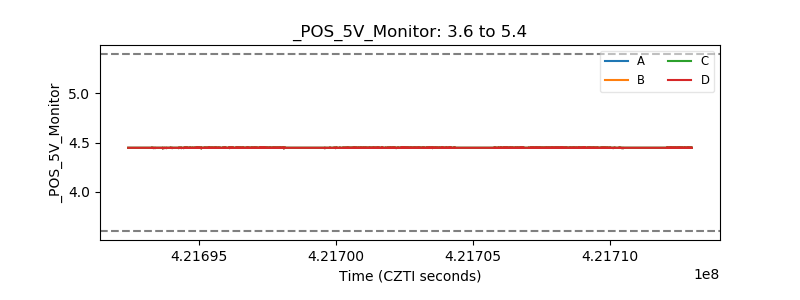 |
| _ROLL_ROT | 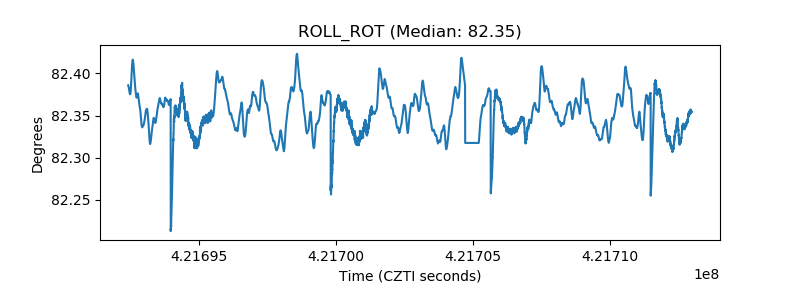 |
| _Roll_DEC | 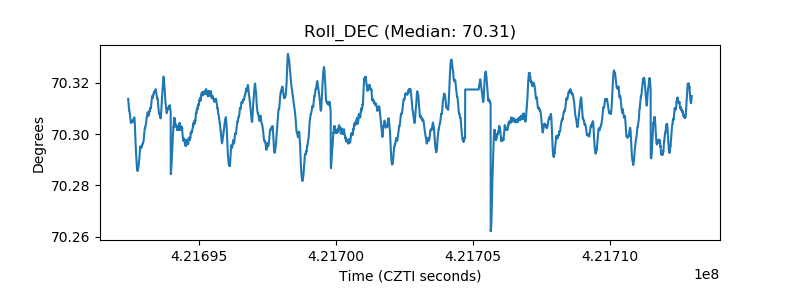 |
| _Roll_RA | 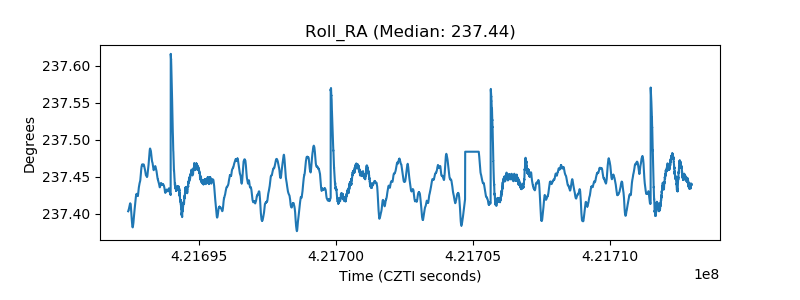 |
| Veto Counter | 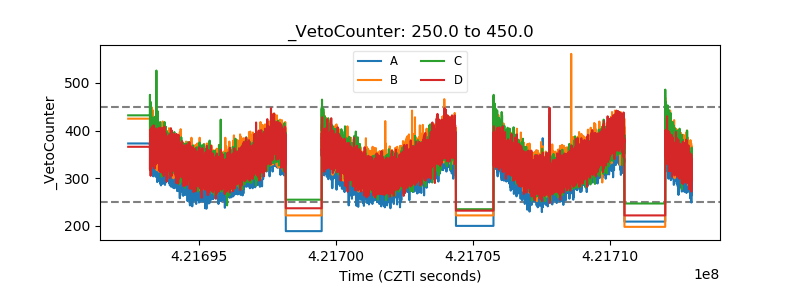 |