| Param | Original file | Final file |
|---|---|---|
| Filename | modeM0/AS1C07_001T12_9000005632_41226cztM0_level2.fits | modeM0/AS1C07_001T12_9000005632_41226cztM0_level2_quad_clean.evt |
| Size (bytes) | 60,986,880 | 17,447,040 |
| Size | 58.2 MB | 16.6 MB |
| Events in quadrant A | 689,610 | 114,335 |
| Events in quadrant B | 436,587 | 118,030 |
| Events in quadrant C | 522,666 | 113,744 |
| Events in quadrant D | 526,661 | 104,859 |
| Mode M0 | |||
|---|---|---|---|
| Quadrant | BADHDUFLAG | Total packets | Discarded packets |
| A | 0 | 2760 | 1 |
| B | 0 | 2028 | 1 |
| C | 0 | 2208 | 1 |
| D | 0 | 2360 | 1 |
| Mode M9 | |||
|---|---|---|---|
| Quadrant | BADHDUFLAG | Total packets | Discarded packets |
| A | 0 | 11 | 0 |
| B | 0 | 11 | 0 |
| C | 0 | 11 | 0 |
| D | 0 | 12 | 0 |
| Mode SS | |||
|---|---|---|---|
| Quadrant | BADHDUFLAG | Total packets | Discarded packets |
| A | 0 | 20 | 0 |
| B | 0 | 20 | 0 |
| C | 0 | 20 | 0 |
| D | 0 | 20 | 0 |
| Quadrant | Total seconds | Saturated seconds | Saturation percentage |
|---|---|---|---|
| A | 1010 | 8 | 0.792079% |
| B | 1010 | 2 | 0.198020% |
| C | 1010 | 15 | 1.485149% |
| D | 1010 | 17 | 1.683168% |
Noise dominated data is calculated using 1-second bins in cleaned event files. If a bin has >2000 counts, and if more than 50% of those come from <1% of pixels, then it is considered to be noise-dominated and hence unusable.
| Quadrant | # 1 sec bins | Bins with >0 counts | Bins with >2000 counts | High rate bins dominated by noise | Noise dominated (total time) | Noise dominated (detector-on time) | Marked lightcurve |
|---|---|---|---|---|---|---|---|
| A | 1010 | 1010 | 4 | 4 | 0.40% | 0.40% | 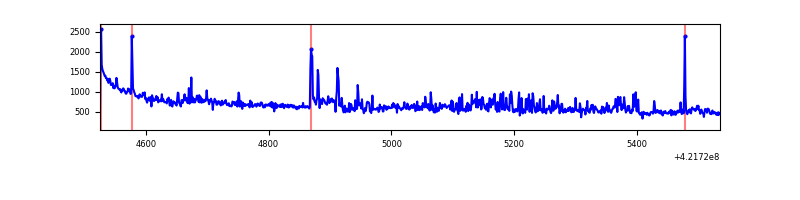 |
| B | 1010 | 1010 | 0 | 0 | 0.00% | 0.00% | 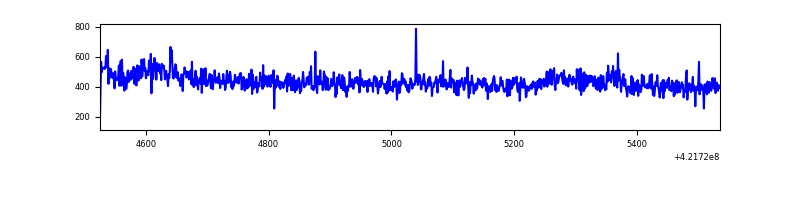 |
| C | 1010 | 1010 | 12 | 12 | 1.19% | 1.19% | 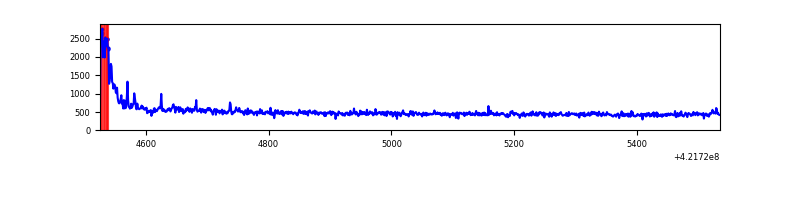 |
| D | 1010 | 1010 | 16 | 16 | 1.58% | 1.58% | 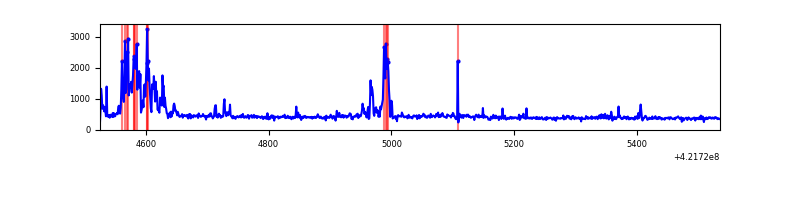 |
Top three noisy pixels from each quadrant. If the there are fewer than three noisy pixels in the level2.evt file, extra rows are filled as -1
| Pixel properties | Quadrant properties | ||||||
|---|---|---|---|---|---|---|---|
| Quadrant | DetID | PixID | Counts | Sigma | Mean | Median | Sigma |
| A | 10 | 83 | 155281 | 6694.0 | 105 | 103 | 23.2 |
| A | 0 | 8 | 110735 | 4772.39 | 105 | 103 | 23.2 |
| A | 13 | 6 | 5427 | 229.66 | 105 | 103 | 23.2 |
| B | 0 | 183 | 7266 | 305.82 | 107 | 104 | 23.4 |
| B | 0 | 229 | 4324 | 180.2 | 107 | 104 | 23.4 |
| B | 12 | 111 | 2668 | 109.48 | 107 | 104 | 23.4 |
| C | 0 | 10 | 51174 | 1958.86 | 105 | 105 | 26.1 |
| C | 15 | 214 | 47858 | 1831.67 | 105 | 105 | 26.1 |
| C | 9 | 54 | 13174 | 501.29 | 105 | 105 | 26.1 |
| D | 13 | 249 | 73574 | 2742.72 | 102 | 99 | 26.8 |
| D | 2 | 249 | 38651 | 1439.09 | 102 | 99 | 26.8 |
| D | 5 | 222 | 11342 | 419.69 | 102 | 99 | 26.8 |
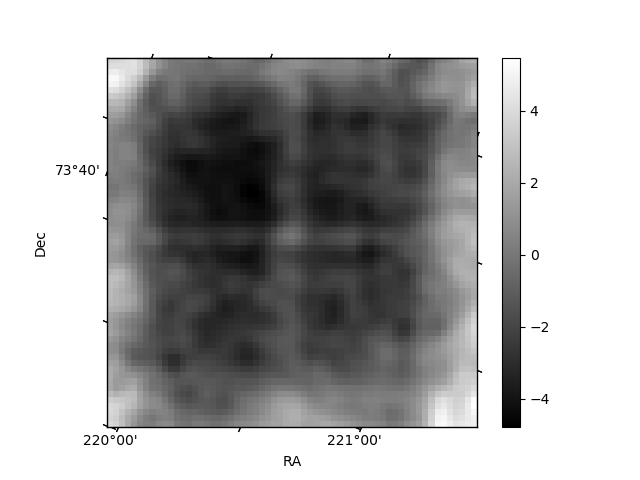
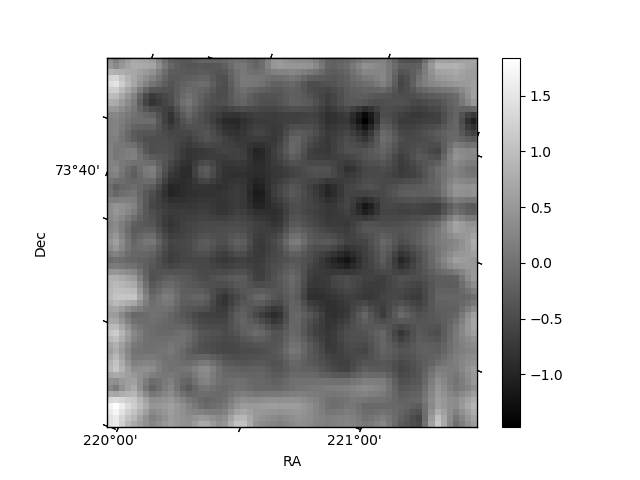
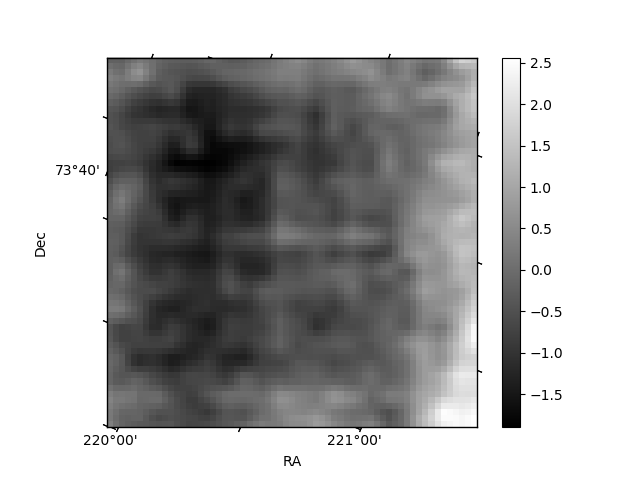
Histogram calculated using DETX and DETY for each event in the final _common_clean file
| Quadrant A | 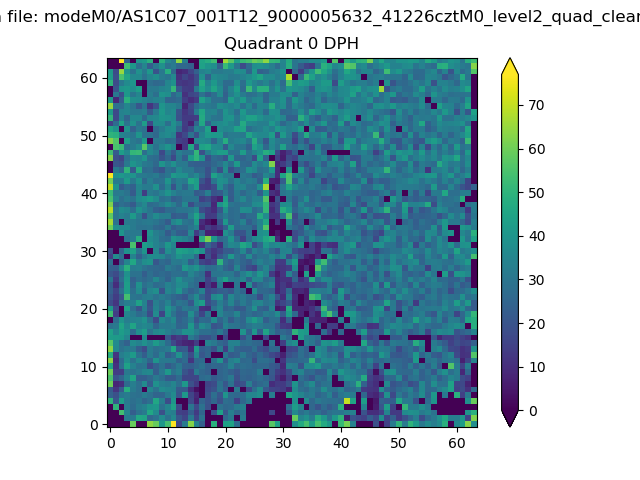 |
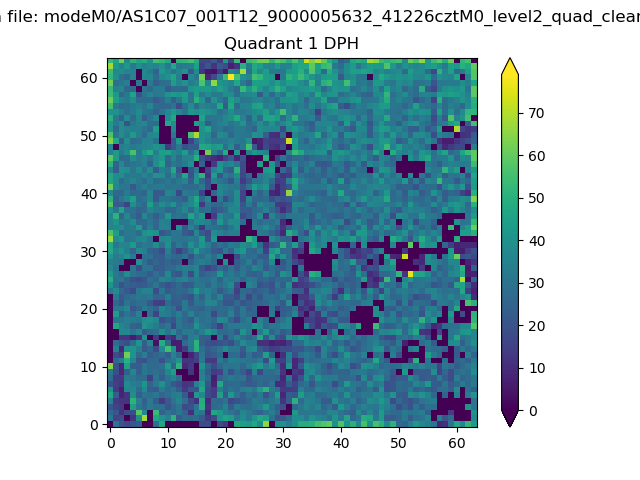 |
Quadrant B |
|---|---|---|---|
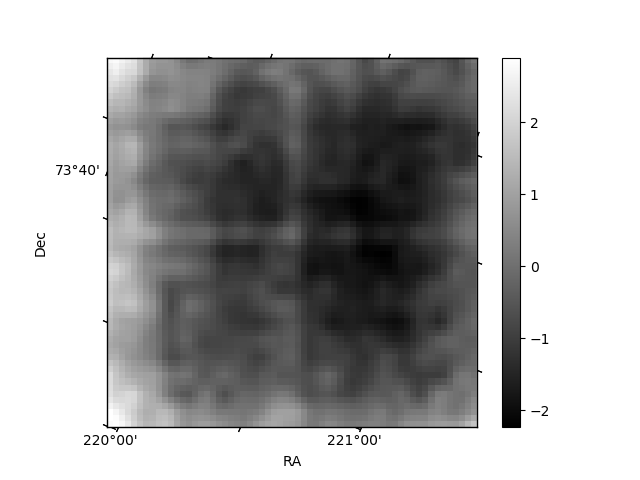
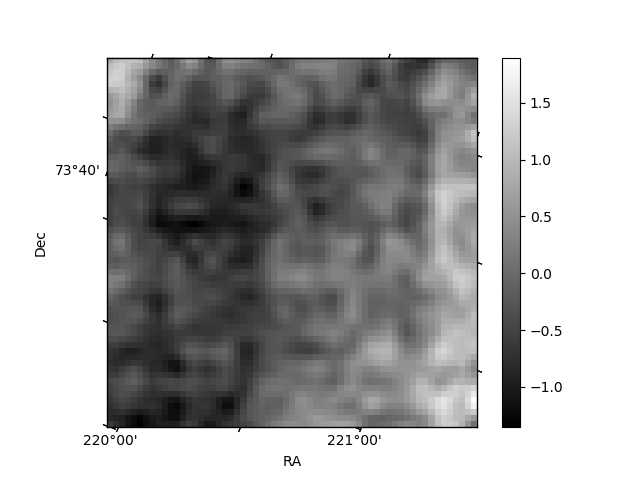
| Quadrant D | 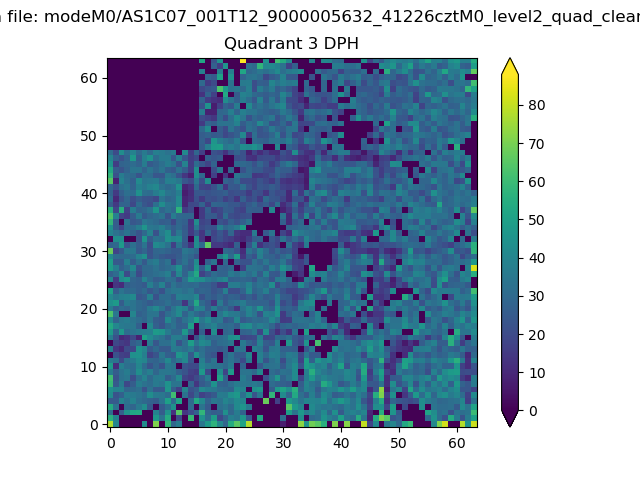 |
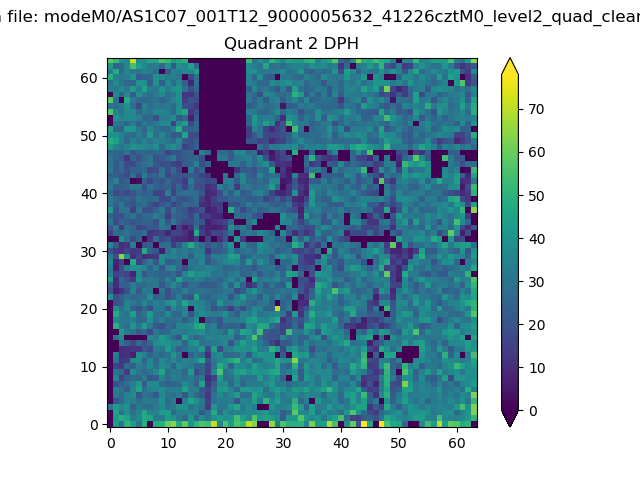 |
Quadrant C |
| Plot type | Count rate plots | Images |
|---|---|---|
| Comparison with Poisson distribution Blue bars denote a histogram of data divided into 1 sec bins. Red curve is a Poisson curve with rate = median count rate of data. |
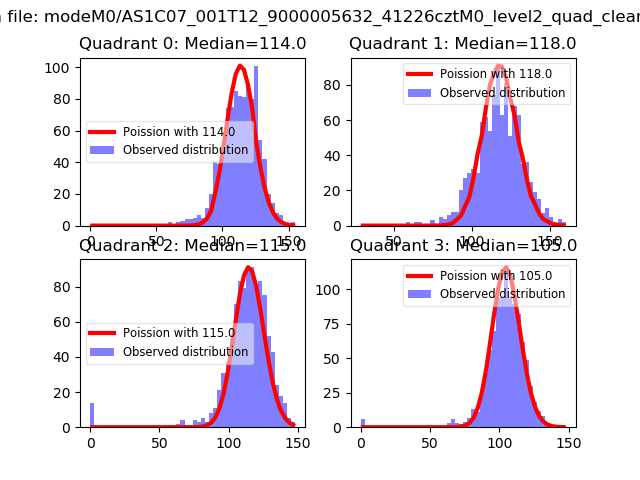 |
 |
| Quadrant-wise count rates Data is divided into 100 sec bins |
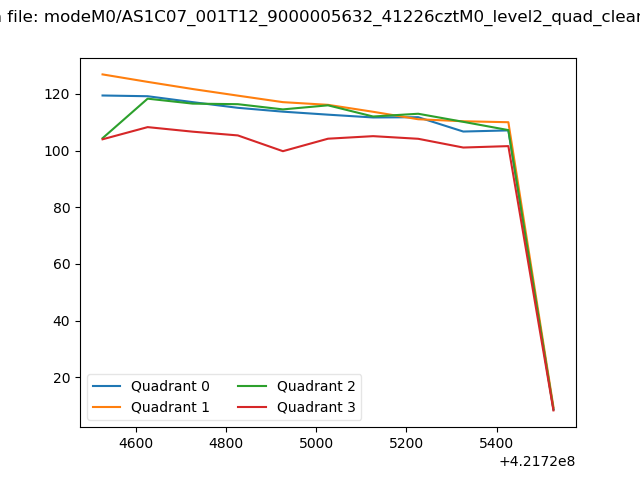 |
|
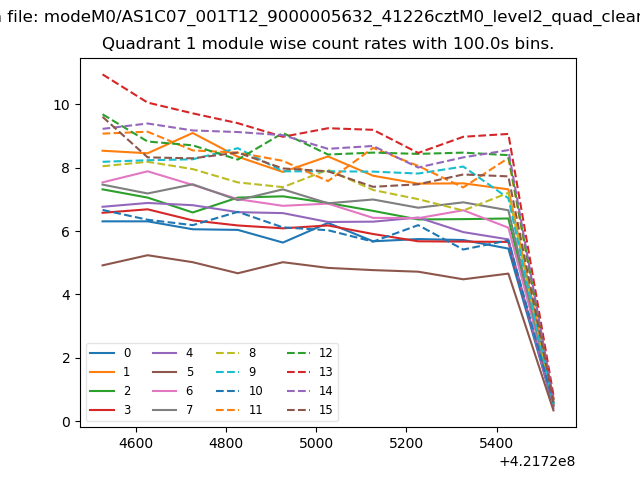
| Module-wise count rates for Quadrant A Data is divided into 100 sec bins |
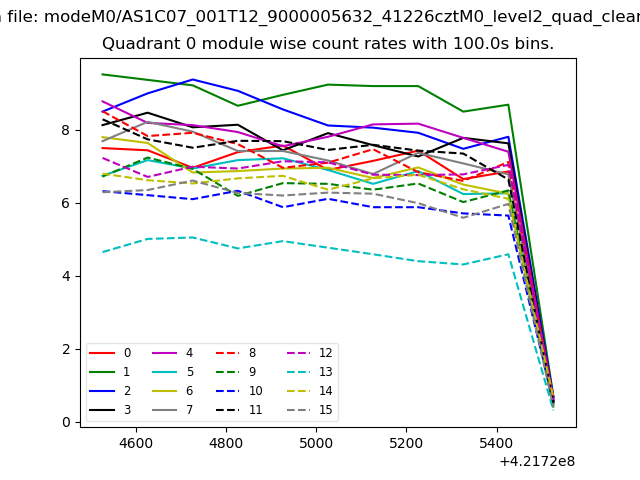 |
 |
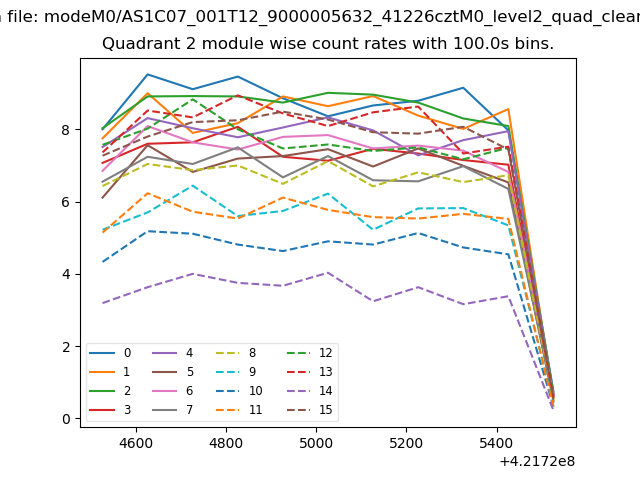
| Module-wise count rates for Quadrant B Data is divided into 100 sec bins |
 |
 |
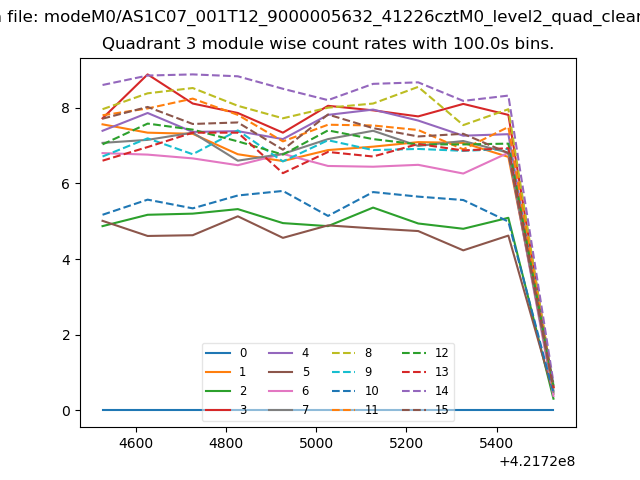
| Module-wise count rates for Quadrant C Data is divided into 100 sec bins |
 |
 |
| Module-wise count rates for Quadrant D Data is divided into 100 sec bins |
 |
 |
| Parameter | Plot |
|---|---|
| CZT HV Monitor | 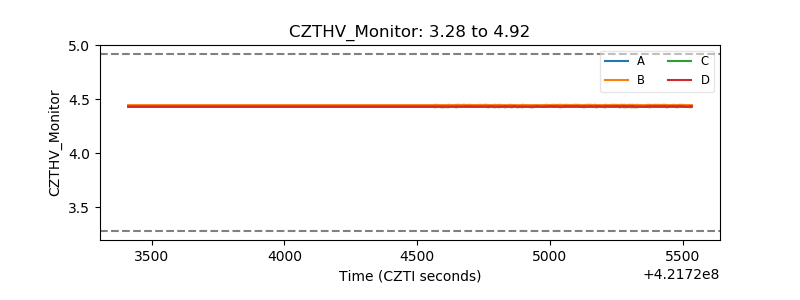 |
| D_VDD | 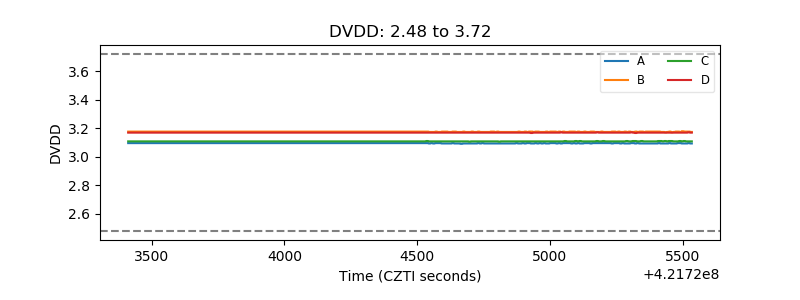 |
| Temperature 1 | 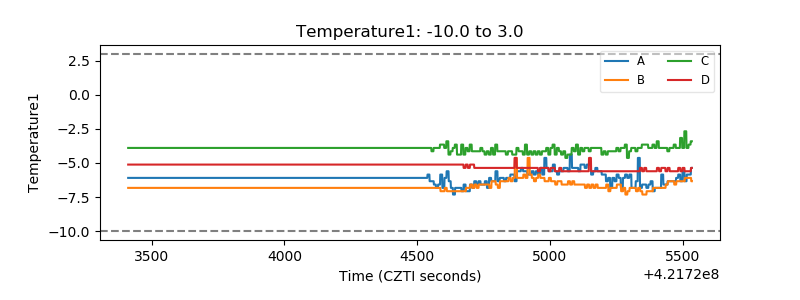 |
| Veto HV Monitor | 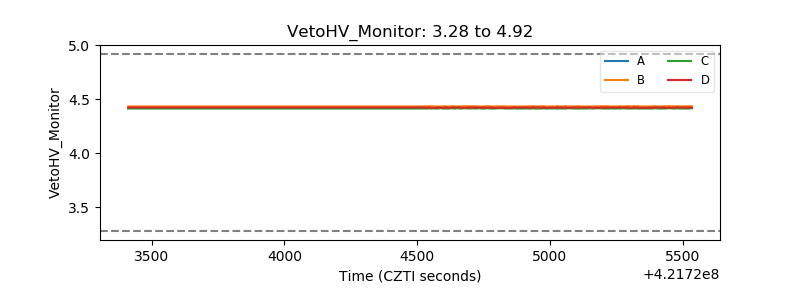 |
| Veto LLD | 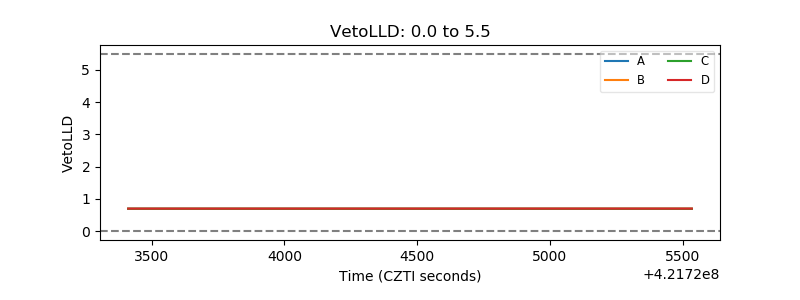 |
| Alpha Counter | 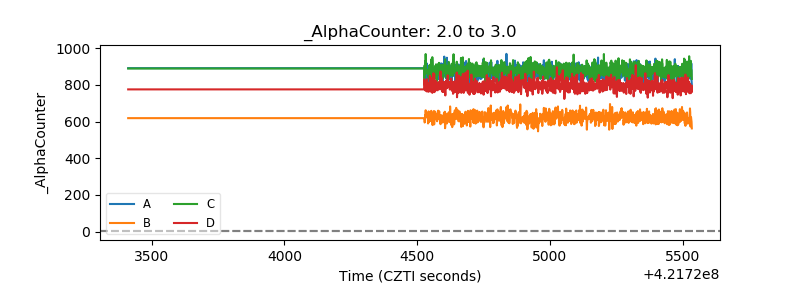 |
| _CPM_Rate | 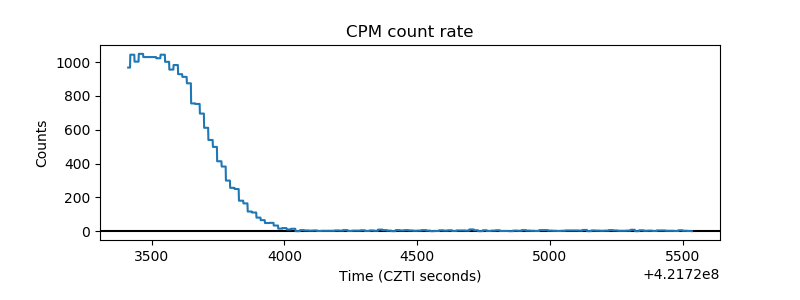 |
| CZT Counter | 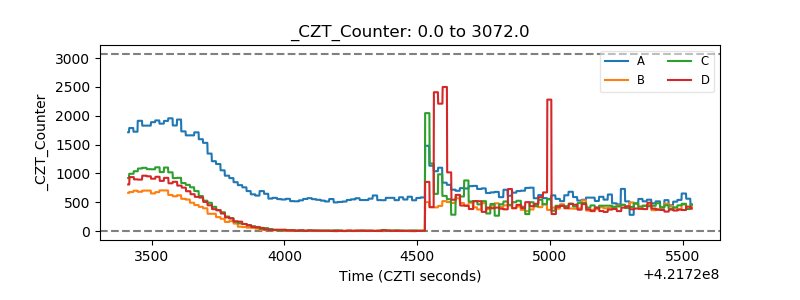 |
| +2.5 Volts monitor | 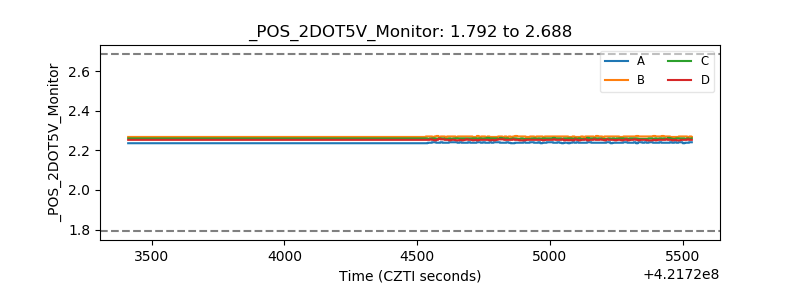 |
| +5 Volts monitor | 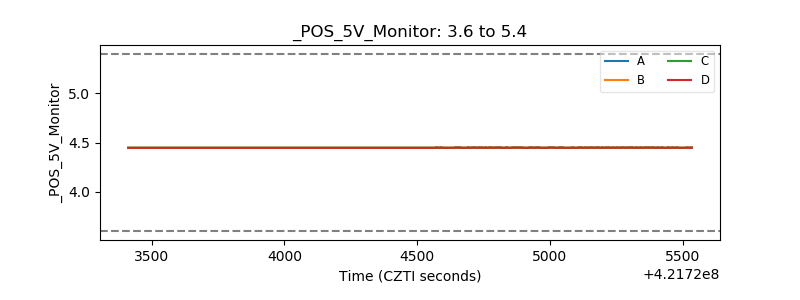 |
| _ROLL_ROT | 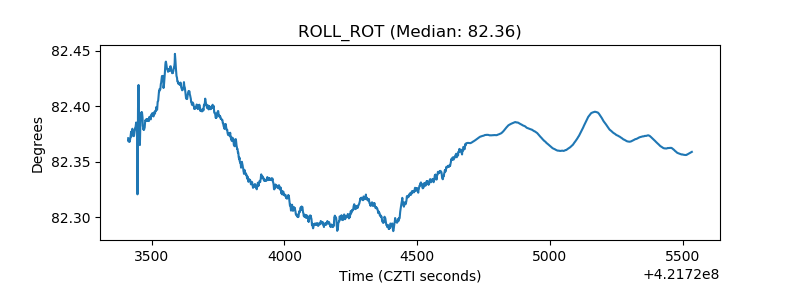 |
| _Roll_DEC | 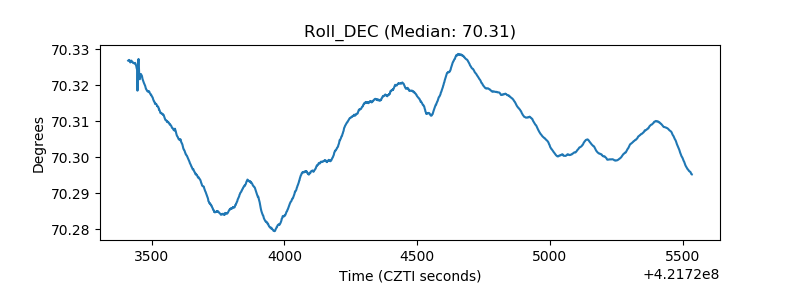 |
| _Roll_RA | 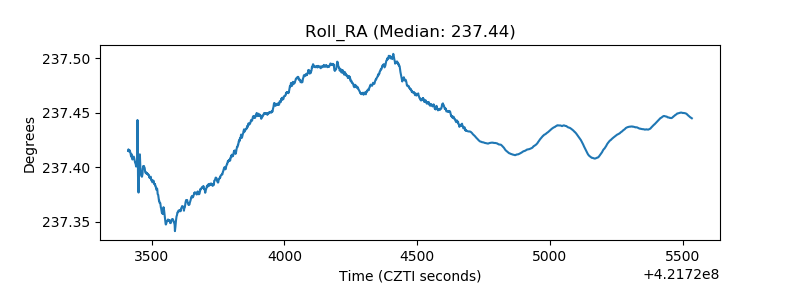 |
| Veto Counter | 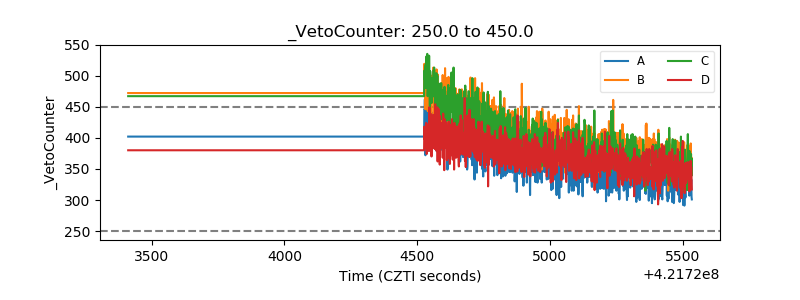 |